Effect Of Using Dynamic Graphical Utilities On Students' Achievements And Attitudes To Enhance Mathematics Teaching And Learning At The Elementary ...
←
→
Page content transcription
If your browser does not render page correctly, please read the page content below
Journal of Positive School Psychology                                                 http://journalppw.com
2023, Vol. 7, No. 1, 106-116

Effect Of Using Dynamic Graphical Utilities On Students’
Achievements And Attitudes To Enhance Mathematics Teaching
And Learning At The Elementary Level In Pakistan: Enhancing
And Impeding Factors
1FarahNaz Makhdum , 2Mahnaz Makhdum , 3Dr. Afifa Khanam , 4Humaira Rasool
Sandhu

1
  PhD Scholar, Department of STEM education, Lahore College for Women University (LCWU), Lahore, Pakistan.
(Principal /Corresponding Author) fmakhdum121@gmail.com
2
  Associate Professor at Govt. Graduate College (W), Gulberg, Lahore, Pakistan, Ph.D Scholar, National College of
Business Administration and Education (NCBA&E), Lahore, Pakistan. mahnaz.stats@gmail.com
3
  Assistant Professor, Department of STEM Education Lahore College for Women University (LCWU), Lahore,
Pakistan. dr.khanam.wattoo@gmail.com
4
  PhD Scholar, Department of STEM education, Lahore College for Women University (LCWU), Lahore, Pakistan

Abstract
Utilizing and integrating technology into teaching practices has become a necessity at all levels to develop
students’ cognitive in mathematics. This research is a mixed method research to identify differences in the
mean scores of teaching with Desmos and GeoGebra graphic utilities with intervention and with no
intervention on student’s achievement and attitudes to enhance mathematics teaching and learning at the
elementary level in Pakistan. Also, to discover the enhancing and impeding factors of using graphical tools
in mathematics classrooms by applying a survey questionnaire and asked open-ended questions to obtain
information from the participants regarding the factors for using Desmos and Gebgra in Pakistani schools.
The findings present that the inclusion of graphical tools in teaching and learning process effected the
students understanding positively and significantly. Result showed that pretest and post-test of the
experimental group does not imply a significant difference, since the interest shown by the students in using
the said dynamic graphical soft wares.

Keywords: Desmos, GeoGebra, grade 7, Mathematics, Pakistan, Experimental Design

Introduction                                                 empower students’ interest and focus, enhance
Nowadays, everybody has digital devices to use               the classroom environment and overall students’
for teaching and learning. In any occasion, we can           learning experience. That is why this research
see adults, children, man or woman bring cell                aimed to identify the effect of Desmos and
phones, tabs, laptops, in their hands and seemed             GeoGebra tools on student’s achievement and
inseparable. In this 21st century, teaching and              attitudes at the elementary level for private
learning environment cannot be separated from                schools in Pakistan. Also, to determine the
the use of technology (Guggemos, & Seufert,                  enhancing and impeding factors of using the
2021) as it is a basic tool for education. This              graphical tools in mathematics classrooms and
phenomenon, somehow, challenges the teachers                 for the purpose, students’ and teachers
to integrate technology into their teaching to               perceptions and experience towards the use of
107                                                                   Journal of Positive School Psychology

graphical smart tools were taken. The study was         web-based tools. Desmos and GeoGebra were
conducted at a private school of Lahore, Pakistan.      used to help students make better link between
Over the two decades, teachers and students have        math concepts and graphical illustrations.
access to number of smart tools for teaching and        These are used as math practice at different levels
learning mathematics particularly. However, not         and are one of the more popular online graphing
every teachers integrate technology into their          utilities. These web-based graphical utilities are
teaching. Good and quality teaching for                 available as a website and as an app. Desmos and
mathematics mainly depends on the way it is             GeoGebra are a similar online graphing utilities
taught and learned (Li, Schoenfeld, 2019).              that have many extra options with the ability to
Desmos and GeoGebra are online graphical                plot, solve for a parameter, and explore, calculus,
calculators that are freely available and accessible    trigonometry, linear algebra and solves equations
for everyone. These tools facilitate students to        with intermediate explanations that provide
comprehend the concepts conceptually will lead          practical information about the topic. Another
towards students to think and reason more               app ‘Symbolab’ that gives a user-friendly online
mathematically. Pakistani students face many            graphing utility that shares very similar
difficulties in conceptualizing many math               functionality to Desmos and GeoGebra. Since,
concepts. They face problems in understanding,          there are many practice problems on it, which
recalling and retaining concepts in mathematics         allow them to practice in different areas such as
particularly (Ali, 2011). Moreover, in Pakistan,        algebra and calculus. Considerable research on
teachers usually fail to instill and nurture critical   various math topics investigated the effect of
abilities in students in the subject of math. The       using the utilities on different levels of education
use of web-based applications help to reduce            and assessed the overall performance and
learning loss in understanding the content of the       attitudes in classroom, learning skills, and
subject conceptually.                                   students’ hand-held written graph-work to
In our education system, mathematics is a tough         measure their conceptual understanding,
subject for teachers and students respectively.         visualization, problem-solving skills, and
Teacher’s role in this regard is crucial for            reasoning.
implementing the instructional practices for the        In past few decades, these tools have had a broad
subject while its effectiveness is measured             Impact. The National Council of Mathematics
through the performance of students. To add             Teachers in 1980 suggested that the students at all
more, technology positively effects the classroom       levels take advantage of these web-based tools in
environment. GeoGebra and Desmos are freely             learning the subject with time, teachers have
accessible graphical tools and used specifically        improved their teaching styles to enhance
created to be used for mathematics learning for         students learning and designed such activities that
all types of students.                                  help to explore and visualize math concepts.
Technology can play its effective role in teaching      Thus, activities, achievements and their attitudes
and learning the subject to develop conceptual          have changed in today’s technological world.
development and even more effective when                Hence, long, time taking and complicated
technology creates interactive classroom                graphical representations can be conceptualized
environment to successfully complete tasks.             using technology in classroom. The ways that
According to Huang et, al., 2012, graphical             students produce and report graphical analysis
techniques could highly support students' solving       can be affected by technology. The main concern
processes. Technology concerns about students'          of teaching-learning math is to create and develop
understanding of math concepts with graphical           concept-related images in the minds of students.
Farah Naz Makhdum 108
For this purpose, graphical soft wares are the best To determine the enhancing and
tools that enable them to understand the concept impeding factors of using graphical tools
by doing on the screen to support cognitive skills. in mathematics classrooms at the private
Through the graphical soft wares, students can schools of Pakistan.
draw dynamically as a result different insight
graphs of a topics evoke in a meaningful way Research Questions:
(Khalil, Farooq, Çakıroğlu, Khalil, & Khan, How does dynamic graphical tools effect
2018). Thus, these concept-developmental tools on students' performance and their
are to formalize the concepts to engage students attitudes in the mathematics classroom?
in the learning process. Technology enhances What are the factors that enhance and
students' learning as they can discover and impede while using dynamic graphical
construct cognition of different concepts. tools of mathematics in Pakistani
Utilizing technology in education improves the classrooms?
exploratory potential, abilities and skills of How do mathematics students of grade 7
students. For example, using web-based graphing observe enhancing and impeding factors
calculators allow them to explore how various in Pakistani schools?
functions behave. What are the impediments of using the
The existing research explored the effect of desmos and GeoGebra at the elementary
technology based and hand held graphing level for students in Pakistani
calculators, ‘Desmos and GeoGebra’ on students’ classrooms?
understanding and organization of paper-pencil
work as it relates to their conceptual Attitude Terminology
understanding in the presence of technology is According to Heddy, Danielson, Sinatra, &
presented. Graham, (2017), in the context at hand, the
terminology 'attitude' can be referred to as
Hypothesis perceived behavioral control predict the intention
There is a positive relationship between the to use technology-related content in instruction.
learning graphs using desmos and GeoGebra Therefore, attitudes toward technology-mediated
tools and the results obtained on the manual way teaching implied to as positive evaluation of
of creating graphs. teaching with digital technologies.
Objectives Achievement Terminology
To identify differences in the mean According to Good, (1973, P-7), achievement
scores of teaching with Desmos and means, “Knowledge attained or skills developed
GeoGebra graphical utilities with in the school subjects usually designed by test
intervention and with no intervention on scores assigned by teachers”
student’s mathematics achievement and
attitudes at the elementary level in Desmos & GeoGebra
Pakistan. GeoGebra is free and multi-platform dynamic
To identify the effect of Desmos and software for teaching-learning math (Ramadhani,
GeoGebra tools on student’s & Narpila, 2018) whereas Desmos is an
achievement and attitudes at the innovative and modern online graphing
elementary level in Pakistan. calculator (https://teacher.desmos.com/). Math
requires cognitive process that further needs109 Journal of Positive School Psychology proper systematic strategy. In mathematics, graphical tools along with positive attitude cognitive process focusses solely on intellectual towards learning. To add more, the students on with no emotional components and places the their own activities also achieved the geometrical students and social context in the learning progression through stages as teachers used process. Both these graphical soft wares are free, Desmos and GeoGebra for teaching mathematics. very intuitive and easy to use as students can draw Considerable research has assessed the graphs of circles, equation of a line, inequalities effectiveness of using graphing calculators on and relations. They can use colors and colors are students' achievement on various mathematical easy to change. These educational soft wares runs topics. Harvey (1993) collected data from fifty- in any browser such as Google chrome and five schools by comparing the mean scores in pre- students can save their work. Desmos is higher calculus test using graphing calculators. Out of quality, full-featured, 21st century math software which 22 schools considered as control groups as also, offers combination of geometry and and were taught by conventional ways. The algebra up to calculus using sliders with click and remaining schools were taken as treatment and drag option created by ‘Desmos’ (Desmos, 2017). were taught using graphing calculators. The Whereas in GeoGebra, everything is treated findings of the study revealed that there were geometrical, algebraically and automatically significantly positive improvement in the measured https://tube.geogebra.org/ (Sharing treatment schools on the mean scores over the area). control groups. Research Related to GeoGebra and Methodology Desmos Aided Instruction In this technological era, everyone is having Participants technology and various smart tools have been As recommended by Palinkas, Horwitz, Green, developed being used to support teaching and Wisdom, Duan, & Hoagwood, (2015), purposive learning. Features of Desmos and GeoGebra are sampling is a useful technique for the offering dynamic learning environment, as these implementation of mixed method research and are very simple and straightforward in usage. In provides useful information to achieve study one study of Erbas and Yenmez (2011) revealed objectives. Population for the research comprised that there is a highly significant effect in of all the private schools of Punjab, Pakistan. achievement, interest and motivation in learning Thirty students were chosen purposively from a geometry and showed effective result in private school in Lahore, Pakistan for the pre- retention. experimental study and out of them 3 students Likewise, (Cakir, & Yildirim, 2013) selected pre- and 2 teachers were taken for the semi-structured service teachers and observed their positive interview, constituted the sample of the study. attitude towards integrating technology in Study has been carried out with a sample of 30 classroom setting and resulted in that their students of grade 7 from 12 to 14 years old for the positive attitudes are major cause of permanence evaluation of the graphical calculators in math for of knowledge. Wassie, Y., & Zergaw, G., (2019) the treatment group. None of these students had observed performance groups for treatment not used the graphical soft wares before. Hence, whose performance was lower in comparison to it is the first time that the treatment group faced the control group whose performance was higher. the smart tools for drawing graphs in math They showed that results were effective and classroom. It is also descriptive since the distinguished of the treatment group using intention is also to know their experiences and
Farah Naz Makhdum                                                                                   110

opinions on the graphical tools they used in the          the conceptual understanding of mathematical
study. Once the results of the intervention               graph topics. The experimental group has taken
achieved from the participants of the study by the        the pre-test to measure their learning prior to the
teacher, an interview data was collected from the         implementation of Desmos and GeoGebra. The
experiences of the treatment group. The data              post-test was administered after to see the
enabled us to immediately detect possible gaps in         differences of their conceptual understanding of
the knowledge of content. To clarify the graphs           the topics being evaluated. During the analysis,
that has been properly learnt by the students, a          paired sample t-test was administered to compare
thinking process based on the analysis of findings        the significant differences between the pre-test
is crucial in order to clear doubts. The data             and post-test of the experimental group.
analysis obtained from the semi-structured
interview enabled the discussion to discover the          Achievement test
effect of the graphical tools on students’ learning       The mathematics teacher administered the
achievement and attitudes in math during the              achievement test as an instrument of the study.
academic year 2022-2023. Two instruments were             There were ten questions, designed by the
used to explore the effectiveness of Desmos and           coordinator of the math subject. The topics on the
GeoGebra on students' learning achievement and            achievement test were graphs of horizontal and
their perceptions on the use of the smart tools. A        vertical line, gradient of a straight line,
semi-structured interview seeking open-ended              transformation of a graph, linear and quadratic
answers was administered for the study and the            equations, solving simultaneous equations
pretest for the intervention was made by the              graphically and its applications in real-world
teacher to commensurate the improvement of                contexts using Desmos and geoGebra apps.
their performance due to the implementation of            Students had more opportunities to use graphing
the intervention. The participants’ experiences           calculators 'Desmos and GeoGebra' for answers.
were discussed under each question. All six               However, ten questions were graphing calculator
participants were interviewed within the duration         neutral, and that could be answered with or
of 15 minutes on average.                                 without graphing calculators.

Pre-Experimental Design                                   Results and Discussion
The existing study focuses on achievement and             It was found that the group who involved free
attitudes of respondents by comparing pretest and         software using desmos and geogebra in their
posttest of the intervention group, where the tests       teaching and learning pretest and post-test scores
are multiple choice type items and involved 30            were used to measure students' Math learning
math students. The questions used in the pre-test         acquisition.
and post were conceptual based and involved on

                   Kolmogorov-Smirnov
                                              Statistics        df         Sig.
                   Pre Test – Experimental .081                 30         .200*
                   Group
                   Post Test – Experimental .103                30         .200*
                   Group
                   *. This is a lower bound of the true significance.
111 Journal of Positive School Psychology
Test of Normality
It is evident from the table of normality test for N = 30 Total No. of students
the data that the value of the Kolmogorov– M = Means
Smirnov Test (KS) is > 0.05, therefore, the data SD = standard deviation
is normal. Df degrees of freedom
The tables below showed that the comparison t-value the difference of means
between the pre and post-tests of the Level of significance is 5%, (0.05)
experimental groups. In these tables,
Mean N SD Std. Error Mean
Pre Test Experimental Group 57.33 30 11.018 2.012
Post Test Experimental Group 76.53 30 13.390 2.445
Paired Samples Statistics
The table above represents descriptive statistical test and 13.390 for the post-test. The standard
data of students’ comparative score in mean and error mean was 2.012 for pre-test and 2.445 for
standard deviation. The two places of the test the post-test. The results stated that intervention
were pre-test and post-test while in between might affect the students’ achievement with
researcher had given treatment to the students. reference to technological-mediated instruction.
The result of both the tests were calculated The table below represents that the mean score
through SPSS ver. 25 which provided that the paired difference is 19.200 with a SD of 15.176.
mean score of the pre-test was 57.33 and the It has a standard error mean of 2.771 while with
result of post-test was 76.53 among 30 students. 0.05 confidence interval it has a paired difference
The standard deviation was 11.018 for the pre- of -24.867.
Paired Differences
95% Confidence
Interval of the
Difference
Mean SD Std. Error Lower Upper T df Sig. (2-
Mean tailed)
Pre Test
Experimental -- 15.176 2.771 -24.867 -13.533 -- 29 .000
Group
Post Test
Experimental 19.200 6.930
Group
Paired Samples Test
Thus, the difference between the pre-test and the rules of quantitative analysis, if p-value < 0.05
post-test scores is significant at (29) degrees of the results are not statistically significant, as
freedom (df) at 5% alpha. The two-tailed shown. Overall result confirms that intervention
significant level is 0.000 < 0.05 which is a has a positive and significant effect on
significant value for paired sample test. Again, by participants’ achievement and attitudes. Use ofFarah Naz Makhdum 112
graphical smart tools significantly improved their of time in teaching graphs to students with pen
mathematics learning from the pre-test scores to and paper approach for sketching graphs and
the post-test marks. visualizing concepts.
I also observed that the students were able to
Semi-Structured Interview – Analysis & better access, learn and practice the topics and
Results they were interested in doing so. I agreed that the
For the purpose of anonymity of respondents of use of these apps, of course, increases effective
the present study, the interviews were given teaching and learning in the classroom.
codes as student1, student2, student3 respectively
for grade 7 students and teacher1 and teacher2 for Qs2. What are main impediments for
teachers. The responses of participants and their implementing this kind of instruction?
analysis are given below.
Teacher1: There are insufficient technical
Qs1. What are the factors to consider that support that may cause us to be less confident
influence or enhance technology-mediated about technology-mediated instruction. With this,
instruction using Desmos & GeoGebra in I mean, smart boards, computer access for every
mathematics classroom at grade 7 level? student of the class with smooth internet facility,
Teacher1: I would say that most students felt that as there are plethora of additional technology for
technology usage in math classroom was teaching in a math classroom. To add more,
motivating and engaging with the content. Albeit attitudes of teachers and students especially for
the use of these smart graphical tools, the teaching-learning math to use technology is
coursework was completed at a fast and hesitant.
accelerated pace.
Qs3. Do you recommend continuing this
What strategies can be more enhancing kind of technology-mediated instruction?
within the math classroom for the Give one reason.
learners?
As a teacher, I experienced that learning graphs Teacher1: Yes, I recommend continuing these
with smart tools improves interaction between smart tools in math classroom and teachers must
students and teacher. We are able to track continue to innovate and fully embrace
students’ learning easily and in an organized way. technology. Teachers should participate in
According to the needs of the students, these apps training of such smart tools in classroom they
solve problems to draw graphs and fully support seem to unable to describe the content based
individual needs of the student. Moreover, these technological knowledge.
are meaningful educational graphical soft wares Teacher2: I would strongly recommend these
to develop conceptual understanding and fluency productive and educational tools; however,
in the topic. school policies should provide suffice amenities,
devices and equipment to all students and should
Teacher2: These tools are very convenient support technological integration.
learning platforms as these are easily accessible These will definitely be the strongest factor for
and available in schools that increases enhancing math learning. Schools must provide
motivation. Students learn with conceptual and the relevant resources, materials and fast internet
full understanding with the use of soft wares. facility.
However, without these soft wares it takes a lot113 Journal of Positive School Psychology
Teachers’ perception – Qualitative Data time in conceptualizing and understanding graphs
Analysis with pen-paper approach. We can access, learn
Thus, teachers should consider maximum and practice the graphs better. I agreed that the
learning benefits of technological integration in use of these apps is really interesting.
math classroom particularly for overall
achievement. With time, they should increase Qs2. What are some common
their technological pedagogical content impediments that make Desmos and
knowledge. Teachers much consider teacher- GeoGebra possible in the math
learner interaction, track learning process and classroom?
keep records with new trends and advancing Student1: One student said that there should be
professional teaching-learning goals according to proper opportunities and resources of using
the needs of the student. School should also graphing calculators.
provide teachers with the resources to support Student2: Internet facilities must be available all
and encourage them to increase their confidence the time to easily browse the data related to
to use technology in math classroom and to mathematics topics.
interact with other teachers. Student3: Some students in math classroom said
to the teacher that there should be training courses
Qs1. How do these graphical free soft to teach and learn with these tools.
wares enhance or influence your learning
performance and attitude? Students’ Perception – Qualitative Data
Analysis
Student1: We found these smart graphical apps Students found these smart graphical calculators
free and easy to use as these are web-based soft easy to use, explore and learn as these are freely
wares. These tools help us to understand the math available web-based soft wares. These tools fully
concepts better. support conceptual understanding of the
Student2: These soft wares are easy to mathematical content. Technically speaking,
understand, learn and explore as these web-based these graphical apps are consistent with the
apps are designed based on simplicity. These learning theories as well and can be suitable to
smart apps improves communication during the use as a part of math curriculum. Teaching and
lesson. learning with Desmos and GeoGebra help
Student3: Math is a tough subject and especially teachers to choose suitable applications for
drawing graphs have always been complicated drawing and graphing effectively.
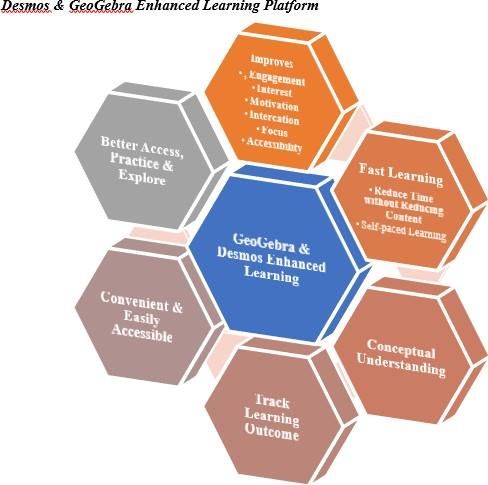
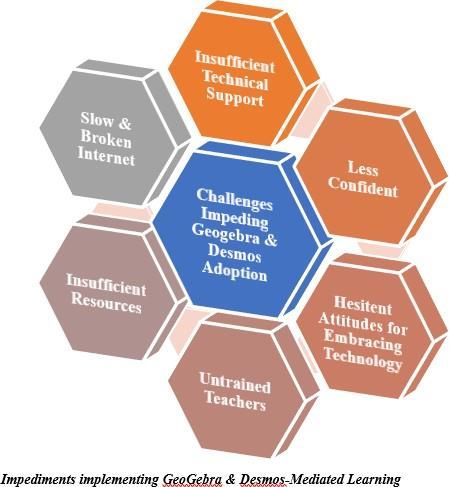
and difficult topic for us. However, Desmos and Impeding and enhancement factors for Desmos
GeoGebra offer self-paced learning and more and GeoGebra mediated instruction and learning
importantly, it produces low stress. It takes much are shown in figures below.Farah Naz Makhdum 114
115                                                               Journal of Positive School Psychology

Discussion & Conclusion                              of using technology in math classroom improved
The first section addresses pre experimental         their understanding and in less time, they
method for the implementation of technology in       understand more. All teachers and students
math classrooms with students of grade 7. The        recommended continuing the use of the smart
second data source was a semi-structured             approaches for dissemination of mathematical
interview, which was administered to three           content in the classroom. All participants agreed
students and two teachers that consisted of five     on usage of these graphic calculators as these had
open-ended questions. Out of which three             a positive effect on academic achievement and
questions were shared with the math teachers and     attitudes of students. These smart tools are the
two questions with the students. The perceptions     fast media and are the effective way to
of students and teachers about the use of            disseminate information and knowledge of the
technology-mediated instruction with Desmos          content as technology has a great potential for
and GeoGebra in math classroom at school were        disseminating math education.
documented. ICT tools and techniques are to
facilitate students’ learning and results declared   References
that the use of Desmos and GeoGebra were found
very useful for students’ better learning at the         1. Digital Technology, (2018). National
elementary level. Teachers were suggested to                 Academies of Sciences, Engineering, and
know how to deliver smoothly and teach smartly               Medicine. How People Learn II:
with these digital graphical tools in mathematics            Learners, Contexts, and Cultures.
classroom. The use of graphical apps as                      Washington,      DC:     The     National
educational technology is to support students in             Academies                           Press.
their studies and teachers in their profession.              https://doi.org/10.17226/24783.
Results from analysis revealed that the students         2. Ali, T. (2011). Exploring students’
could use Desmos, GeoGebra in future as tools to             learning difficulties in secondary
solve math problems easily with complete, and                mathematics classroom in Gilgit-
conceptual understanding in less time that they              Baltistan and teachers’ effort to help
could not solve before. Students perform better if           students overcome these difficulties.
they use these hand-held calculators. The                    Bulletin of Education and Research,
findings from the study demonstrated that math               33(1), 47-69.
students who used Desmos and GeoGebra to                 3. Cakir, R., & Yildirim, S. (2013). ICT
draw and sketch graphs had a better                          Teachers’ Professional Growth Viewed
understanding of x and y intercept, equation of              in terms of Perceptions about Teaching
horizontal     and     vertical   lines,   solving           and      Competencies.      Journal     of
simultaneous equations graphically and finding               Information Technology Education:
the point of intersection of linear and quadratic            Innovations in Practice. 12. 221-237.
equations. The performance of students using                 10.28945/1889.
graphical calculators was better than the students       4. Desmos, (2017). Desmos user guide:
without using Desmos and GeoGebra. The                       variables and sliders. Retrieved online
students who were taught with free graphical                 from
software were able to make a better connection               https://desmos.s3.amazonaws.com/Des
between mathematics topics and their real-world              mos_User_Guide.pdf in 14.08.2017.
applications. Whereas, the results of the                5. doi.org/10.1016/j.chb.2020.106613
qualitative analysis showed that their experience
Farah Naz Makhdum                                                                        116

  6. Erbas, A. K., & Yenmez, A. A. (2011).           13. National Council of Teachers of
      The effect of inquiry-based explorations           Mathematics (NCTM) (1980). An
      in a dynamic geometry environment on               agenda for action. Reston, VA: National
      sixth grade students' achievements in              Council of Teachers of Mathematics.
      polygons. Computers & Education,               14. Palinkas, L. A., Horwitz, S. M., Green,
      57(4),                        2462–2475.           C. A., Wisdom, J. P., Duan, N., &
      https://doi.org/10.1016/j.compedu.2011.            Hoagwood, K. (2015). Purposeful
      07.002                                             Sampling for Qualitative Data Collection
  7. Good. (1973). Dictionary of education.              and Analysis in Mixed Method
      New York: McGraw Hill Book                         Implementation                 Research.
      Company. New York. P. 7, 267.                      Administration and policy in mental
  8. Guggemos, J., Seufert, S., (2021).                  health,          42(5),        533–544.
      Teaching with and teaching about                   https://doi.org/10.1007/s10488-013-
      technology – Evidence for professional             0528-y
      development of in-service teachers.            15. Ramadhani, R., & Narpila, S.D., (2018).
      Computers in Human Behavior. 115-                  Problem based learning method with
      0747-5632                                          geogebra in mathematical learning.
  9. Harvey, J. G., Ed., Mathematical                    International Journal of Engineering and
      Association of America Placement Test              Technology. 7. 774-777.
      Newsletter; v1-9 1978-87. Washington,          16. Wassie, Y., & Zergaw, G., (2019). Some
      D.C. (p-148).                                      of the Potential Affordances, Challenges
  10. Heddy, B. C., Danielson, R. W., Sinatra,           and Limitations of Using GeoGebra in
      G. M., & Graham, J. (2017). Modifying              Mathematics Education. Eurasia Journal
      knowledge, emotions, and attitudes                 of Mathematics, Science and Technology
      regarding genetically modified foods.              Education. 15. 10.29333/ejmste/108436.
      The Journal of Experimental Education,
      85(3),                          513–533.
      https://doi.org/10.1080/00220973.2016.      Acknowledgement
      1260523
                                                  I acknowledge the valuable assistance of my
  11. Khalil, M., Farooq, R. A., Çakıroğlu, E.,
                                                  father, Mr. Makhdum Tariq Salim, for ever-
      Khalil, U., & Khan, D. M. (2018). The
                                                  friendly and loving attitude.
      Development         of      Mathematical
      Achievement in Analytic Geometry of
      Grade-12 Students through GeoGebra
      Activities.     Eurasia     Journal   of
      Mathematics, Science and Technology
      Education, 14(4), 1453-1463.
      https://doi.org/10.29333/ejmste/83681
  12. Li, Y., Schoenfeld, A.H., (2019).
      Problematizing teaching and learning
      mathematics as “given” in STEM
      education. IJ STEM Ed 6, 44.
      https://doi.org/10.1186/s40594-019-
      0197-9
You can also read