Effects of rainfall and land use on river nutrient dynamics in the Brazilian semiarid region
←
→
Page content transcription
If your browser does not render page correctly, please read the page content below
Effects of rainfall and land use on river nutrient
dynamics in the Brazilian semiarid region
Letícia Lacerda Freire
Federal University of Ceara: Universidade Federal do Ceara
Alexandre Cunha Costa
UNILAB: Universidade da Integracao Internacional da Lusofonia Afro-Brasileira
Iran Eduardo Lima Neto ( iran@deha.ufc.br )
Federal University of Ceara: Universidade Federal do Ceara https://orcid.org/0000-0001-8612-5848
Research Article
Keywords: Phosphorus, Nitrogen, Water quality monitoring, Intermittent rivers, Sources of pollution,
Pearson’s Correlation, Backward stepwise regression
Posted Date: April 13th, 2022
DOI: https://doi.org/10.21203/rs.3.rs-1487251/v1
License: This work is licensed under a Creative Commons Attribution 4.0 International License.
Read Full License
Page 1/20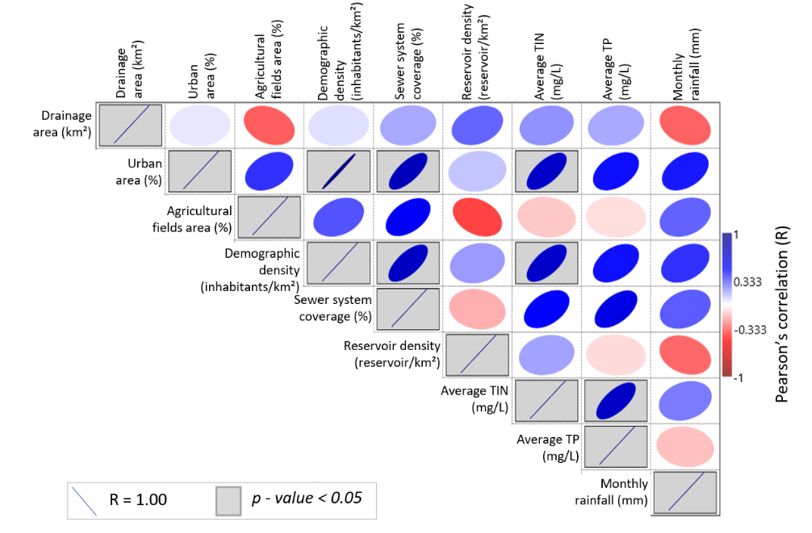
Abstract
This paper investigated the effects of rainfall and land use on the dynamics of total phosphorus (TP) and
total inorganic nitrogen (TIN) in the Brazilian semiarid region. The study covered eleven watersheds
within an area of 142,381 km². TP and TIN were monitored between 2013 and 2018 at 92 river water
quality monitoring sites. The monthly rainfall (Rn) was obtained from 575 rain gauges. Pearson’s
correlation (R) between Rn and nutrient concentration was performed. The correlation patterns were also
analysed based on land use data: urban area (%), agricultural field area (%), demographic density
(inhabitants/km²), sewer system coverage (%), and reservoir density (reservoir/km²). Backward stepwise
regression was carried out to identify predictors of nutrient concentrations. The results revealed that in
watersheds with high demographic density, the rainfall is not the most influential factor in the
concentration of nutrients (marginal effect). However, in regions with greater accumulated rainfall and
lower reservoir density, the rainfall was related to a linear increase in nutrient concentrations (positive
effect) (R > 0.8). On the other hand, in watersheds with less accumulated rainfall and greater inter-basin
hydrological disconnection due to a high-density reservoir network, there was a linear decrease in nutrient
concentration (inverse effect) (R
reservoirs are vulnerable to eutrophication due to increased phosphorus concentrations and under
climate change scenarios (Raulino et al., 2020). Moreover, the seasonality of rainfall also has a great
influence on the dynamics of nutrients (Rocha and Lima Neto et al., 2021; Xue et al., 2016). The oldest
reservoirs become a source instead of a sink of phosphorus (Lima Neto et al., 2022). Retention of
nutrients by reservoirs is counterbalanced by high rates of sedimentation, which over time increase
internal loads (Rocha and Lima Neto, 2022). Moreover, the water allocation is performed after the rainy
season, in other words, after the period of the highest inflow of water to the reservoirs (Souza Filho et al.,
2008). Knowledge of how the nitrogen and phosphorus concentrations change during the rainy season is
necessary to understand the processes of transport of these nutrients to the reservoirs, which are the
main source of water supply for multiple activities in the region (De Araújo et al., 2018).

It should be observed that intermittent and ephemeral streams associated with several reservoirs also
modify the dynamics of water quality (Lima Neto et al., 2011; Nascimento Filho et al., 2019; Marques et
al., 2019). In the Brazilian semiarid region, less rainfall and thousands of reservoirs favour lower
phosphorus loads compared to the national average, except for urban basins with low sanitation
coverage (Rocha and Lima Neto, 2021). Some issues also deserve attention in this region: nutrient
availability and changes in river flow resulted in the growth of phytoplankton communities, restricting
water uses (Santana et al., 2016); the decrease in rainfall in recent years has often been associated with
eutrophication due to agriculture, urbanization, and land-use changes (Soares et al., 2021); most rivers
are heavily impacted by high concentrations of phosphorus and nitrogen (Freire et al., 2021).

Therefore, the main objective of this paper was to evaluate the influence of rainfall and land use on total
phosphorus (TP) and total inorganic nitrogen (TIN) concentrations in watersheds in the Brazilian
semiarid region, on a spatial scale. The specific objectives were to assess whether rainfall influences the
dilution or concentration of nutrients, and investigate the relationship between land use indicators and
nutrient concentrations in intermittent rivers.

2. Material And Methods
2.1 Study area
The study area comprises eleven hydrographic regions in the State of Ceará (Fig. 1), mostly located in the
Brazilian semiarid region, covering 142,384 km². The hydrographic regions of the State of Ceará are water
resources planning units, which consider similar hydrological conditions, in addition to political-
administrative issues. In this sense, eleven of the twelve hydrographic regions are included in the National
Water Quality Monitoring Program and, therefore, were selected for the present research. They are named
as follows: Acaraú (AC), Banabuiú (BN), Coreaú (CO), Alto Jaguaribe (AJ), Médio Jaguaribe (MJ), Baixo
Jaguaribe (BJ), Litoral (LT), Metropolitanas (MT), Salgado (SL) and Sertões de Crateús (SC). In these
hydrographic regions, the average rainfall is about 550 to 1600 mm for driest (central and northwestern
zones) and humid (coastal and plateau zones) zones of the territory, respectively (Uvo e Berndtsson,
1996). Watersheds in the vicinity of the coastal zone are influenced by instability lines due to the
                                                   Page 3/20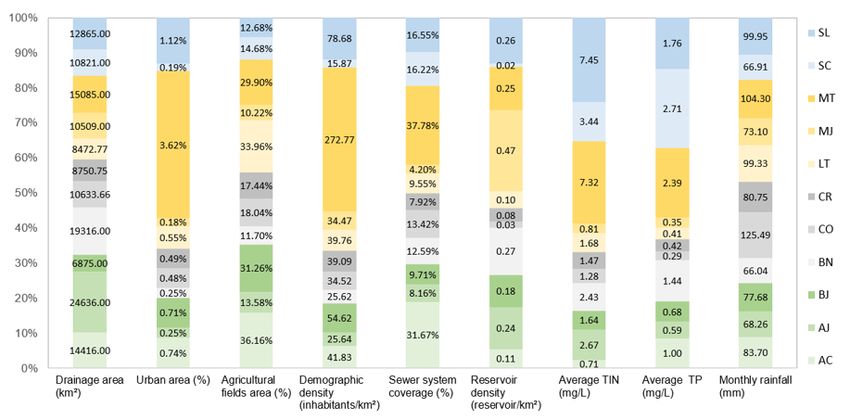
formation of rain clouds from solar incidence in the tropics (Gaiser et al., 2002). In the south of the State
of Ceará, orographic rains are recurrent, influenced by the windward area of the SL watershed, where air
masses from the coast reach the region and ascend through the relief (Costa et al., 2021). After the
effects of the Intertropical Convergence Zone (ITCZ), the equatorial Atlantic mass starts to influence the
formation of rain clouds from the formation of two air currents: one cool and wet and the other hot and
dry (Uvo and Berndtsson, 1996). The rise of these currents, associated with thermal discontinuity and
temperature reduction with altitude, generates heavy rains on the coast and drought in the interior and in
the most central regions of the State of Ceará, where SC, BN and AJ are located. The rainy season, in
general, occurs between December and June, with more intense rains concentrated between February and
May, which is favoured by the ITCZ. The other synoptic factors are easterly waves, cyclonic vortices and
climate change by El Niño-Southern Oscillation (ENSO). The El-Niño generates the displacement of the air
mass ascendancy zone of the Walker cell and favours the occurrence of drier years in Northeastern Brazil,
while the La-Niña is associated with the opposite condition in this region (Lim et al., 2017).

2.2 Data sources and statistical assessment
To assess whether precipitation influences the dilution or concentration of nutrients, two monitored
variables were used: monthly rainfall and nutrient concentrations (TP and TIN). Ammonia, nitrite and
nitrate concentrations were considered as TIN. The monthly rainfall (Rn) for each hydrographic region
was provided by the Ceará Meteorology and Water Resources Foundation (Funceme). Rn was determined
by the Thiessen Polygon Method (Thiessen, 1911) in 575 rain gauges in the study area. The nutrient
concentrations were monitored by the State Environmental Superintendence (Semace). The TP and TIN
concentrations were analysed quarterly from 2013 to 2018. In total, the data used came from 92 river
water quality monitoring sites (Fig. 1).

First, simple linear regression and Pearson’s correlation were performed with the log-transformed values
of the average monthly nutrient concentrations and monthly rainfall, during the rainy season. Second, the
linear relationship between the concentrations of TP and TIN was verified to understand the similarity of
the dynamics of these nutrients.

Regarding the investigation of the influence of land use indicators on the nutrient concentrations, the
following indicators of anthropogenic interference were selected: urban area (%), agricultural fields area
(%), demographic density (inhabitants/km²), sewer system coverage (%) and reservoir density
(reservoir/km²).

The urban area was determined from vector files made available by the Research and Economic Strategy
Institute of the State of Ceará (IPECE), using Quantum GIS 3.16. The municipal population data used to
determine the demographic density and the sewer system coverage was made available by the National
Sanitation Information System, whose average values were determined between 2013 and 2018. The
agricultural fields area was made available by the Brazilian Institute of Statistical Geography (IBGE) for
the year 2016. From these municipal data, the sum was carried out by hydrographic region. Then, the
percentages were determined for the urban area, for the sewer system coverage and for the agricultural
                                                  Page 4/20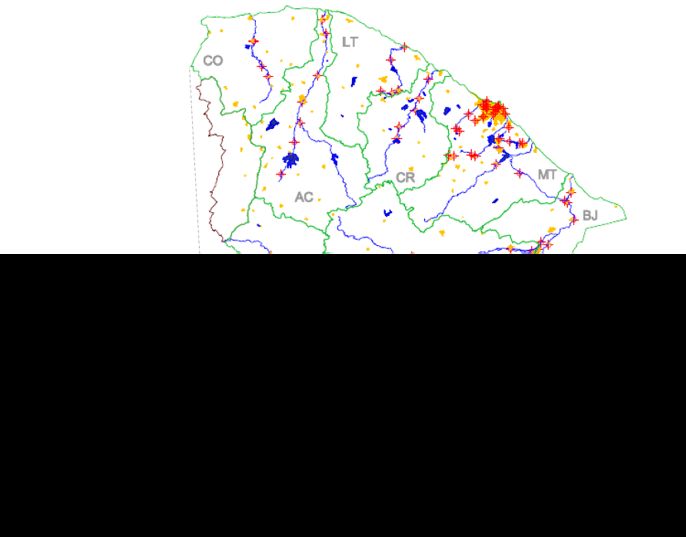
field area. Finally, the number of reservoirs to calculate the reservoir density was obtained from a map
provided by Funceme, which defines the number of surface reservoirs per hydrographic region (Funceme,
2016).
Pearson's correlation and backward stepwise regression were performed between all analysed variables,
including the average of Rn in the rainy season, the average concentration of TIN and TP and the
previously listed anthropogenic interference indicators. The backward stepwise method was used to infer
the magnitude of the relationship between possible predictors of water quality (Wunderlin et al., 2001;
Wang et al., 2013). The indicators of anthropogenic interference and the monthly rainfall were considered
as independent variables, while nutrient concentrations were considered as dependent variables.
3. Results And Discussion
3.1 Land use, rainfall and nutrient concentration at the
hydrographic region scale
The indicators of anthropogenic interference, the average nutrient concentration and the average monthly
rainfall were presented in Fig. 2. There is a similarity between the drainage area of the hydrographic
regions; however, the metropolitan watersheds (MT) were the most urbanised, followed by SL. The least
urbanised hydrographic regions were MJ and SC. In addition to the percentage of urban area,
demographic density was also considerably higher in MT and SL, but lower in SC and BN. The percentage
of agricultural fields area was higher in the AC watershed, followed by the LT and BJ, and was lower in
MJ, BN and SL. Thus, MT and SL are hydrographic regions strongly influenced by urbanisation, while AC,
LT and BJ are more influenced by agricultural activities. However, in all hydrographic regions, agriculture
is an important economic activity. In BJ and BN, for example, 70% of the available water is consumed by
irrigated agriculture and, in these regions, the rapid agricultural expansion has caused conflicts in the use
of water and intensified the risk of desertification and pollution (Lemos and Oliveira, 2004). Furthermore,
according to Reis et al. (2020), the hydrographic region of the BJ is the one with the greatest vulnerability
to drought, especially due to the high water demands for irrigation and shrimp farming.
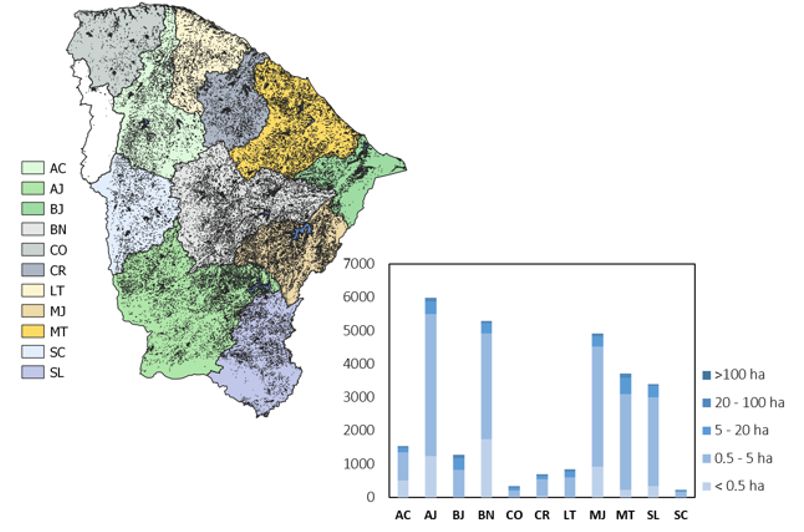
Regarding the reservoir density (reservoir/km²), it is also necessary to observe Fig. 3. The reservoirs in the
region have different storage capacities. Most reservoirs have a maximum of 20 ha of lake surface area,
as shown in Fig. 3. Northeastern Brazil has a linear relationship between the drainage area and the
surface area of reservoirs (Freitas et al., 2021). The largest volumes stored are in the AJ, BN and MJ. In
AJ, for example, every 5 km² there would be one dam of water if these were evenly distributed. This
number of reservoirs per area is the same as identified by Mamede et al. (2018) in a watershed in the
State of Ceará.
The average concentrations of TP and TIN (Figs. 2 and 6) were higher in the more populated areas (MT
and SL). In the case of SC that does not present high urbanisation rates, the values are directly influenced
by the location of the monitoring rivers sites, as they are downstream of the stabilization pond systems
Page 5/20(Freire et al., 2021). A more detailed approach to the relationship between the variables will be discussed
below, with Pearson's correlation and the backward stepwise results.
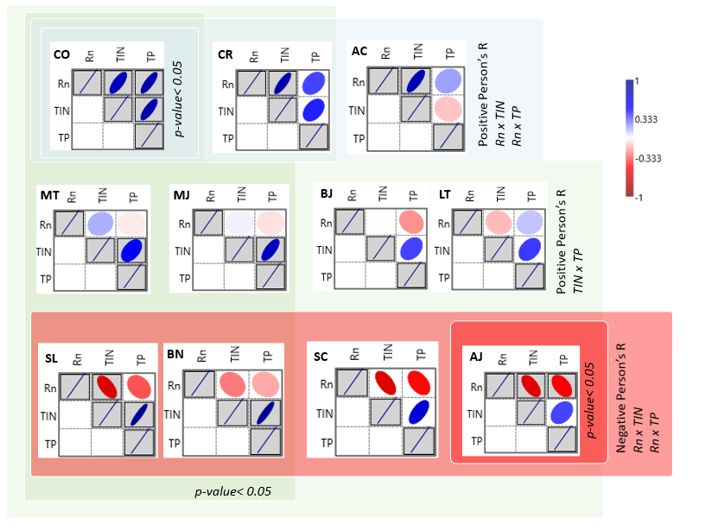
Based on the results of the correlation between monthly rainfall and nutrient concentrations, it was
possible to group the hydrographic regions, as shown in Fig. 4. The eccentricity of the ellipses is directly
proportional to the magnitude of the correlation. This means that the greater the eccentricity, the closer is
the correlation coefficient to the value of 1. Note that blue ellipses show positive correlations and red
ellipses show negative correlations. In hydrographic regions, TIN and TP are strongly correlated, except in
AC, where the ratio between average TIN and TP was higher than in all other hydrographic regions. This
may be related to higher phosphorus inputs, mainly from diffuse sources in agricultural fields along river
banks. In this watershed, agriculture has been developed through irrigated perimeters in the vicinity of the
main rivers (Cogerh, 2022), which may have contributed to the higher concentrations of TP in relation to
TIN, because phosphorus may be more related to agricultural sources, while ammonia nitrogen with point
pollution source of wastewater (Wang et al., 2015).
A positive relationship between rainfall and nutrients was identified for CO, CR and AC, with CO being
significant for both Rn versus TIN and Rn versus TP. On the other hand, a strong negative correlation
coefficient for SL, SC and AJ, with AJ being significant for the relationship between precipitation and both
nutrient concentrations. The linear regression plots for these hydrographic regions were shown in Fig. 5.
This result reveals that the increase in monthly rainfall may have a marginal effect - not being a
significant influence factor for nutrient concentrations; however, it may influence different responses,
even with similar climatic conditions, as the processes are influenced by anthropic changes on a local
scale.
The existence of several water dams (see Fig. 3) favours the trapping of nutrients by the reservoir
network, through sedimentation and biological uptake, especially in years with below-average rainfall
(Molisani et al., 2012; Lima Neto et al., 2011). Therefore, the inflow generated by rainfall reduced the
concentration of nutrients (inverse relationship between Rn and nutrients, see Fig. 5) in urban rivers,
which are strongly impacted by point source pollution of wastewater. This occurrence is consistent with
the one identified by Rocha and Lima Neto (2021) for 21 reservoirs located in the same region of the
present study, where, in rural basins with thousands of small reservoirs, there was an input load of
phosphorus of more than ten times lower than that of the national average. Consequently, the
accumulation of these nutrients in the reservoirs increases their risk of eutrophication (Wiegand et al.,
2021). Furthermore, high concentrations of cyanobacteria are already identified in the reservoirs of the
evaluated sites, especially in drier zones (Lorenzi et al., 2018). In this sense, the hydrological
disconnection enhances this effect (Costa et al., 2012; Van Langen et al., 2021). On the other hand, for
SC, the most influential factor is not the presence of reservoirs along with the hydrological network that
promotes the positive relationship. In SC, the river water quality monitoring sites are downstream of
waste stabilization pond discharges. In this case, in the rainy season, surface run-off contributes to the
dilution of this source of nutrient load. Dilution of pollutant loads during the rainy season is prevalent in
places with point discharges of wastewater (Bowes et al., 2012; Freire et al., 2021).
Page 6/20The increase in rainfall intensity had the opposite effect, generating excessive transport of nutrients from
the catchment area to the river, in predominantly rural basins. Most positive correlations were more
representative between Rn and TIN than between Rn and TP, which corroborates Yao et al. (2021), who
stated that soil nitrogen losses occur faster than phosphorus losses. Hence, increased precipitation more
easily causes nitrogen leaching (Zhang et al., 2020). In Coreaú, for example, where there is more intense
rain and fewer reservoirs, the transfer of nutrients to the water sources is promoted on the same scale of
correlation for TIN and TP, while in the others, where there is direct proportionality, the correlations are
stronger for TIN.
3.2 Large-scale land use, rainfall, and nutrient concentration
To understand the pattern of demographic distribution and anthropic activities evaluated, Pearson's
correlation was performed, shown in Fig. 6. The percentage of the urban areas showed a significant
positive relationship with demographic density and with the sewer system coverage. Therefore, most of
the population and sewage collection services are in urban locations. The urban area and the percentage
of sanitary sewage were also directly proportional to the nutrient concentrations, indicating that
urbanisation is a strong influencing factor in the concentration of nutrients on a large scale. In the SL
watershed, for example, it is estimated that phosphorus loads from anthropogenic sources to rivers can
be more than ten times greater than natural contributions (Paula Filho et al., 2019). This fact may justify
a low correlation between precipitation and mean TP concentrations, despite the propensity to dilution.
These conditions are similar to regions of China with high levels of human occupation, where
urbanisation ends up being the most influential factor in water quality (Li et al., 2015; Yang et al., 2020).
The increase in TIN and TP in relation to the percentage of urban areas can also be generated by soil
sealing. According to Ahiablame et al. (2012) the implementation of permeable pavements and rainwater
containment systems in an urban area can reduce up to 2% of phosphorus and 12% of total nitrogen in
surface run-off. Urban watersheds with an impermeable surface do not have the capacity to trap
phosphorus, so this is exported as biomass or through waste in stormwater run-off (Hobbie et al., 2017;
Wang et al., 2014).
As for the sewer system coverage and its relationship with the concentration of nutrients (Fig. 6), this is
explained by the fact that the sewage treatment technologies in the region are mostly at the secondary
level, not being able to remove nitrogen and phosphorus (Brazil, 2013; Marangon et al., 2020). Thus, large
concentrations of nutrients from wastewater are discharged into water resources (Wang et al., 2015;
Schliemann et al., 2021). There was a negative correlation between the reservoir density and the average
monthly rainfall. This can be explained by the greater rainfall occurring mostly in the coastal zone and
the highest demands for water storage and transfer being supplied by strategic dams in the interior and
central areas of the territory (Albiero et al., 2018).
Regarding the backward stepwise multiple regression on a large spatial scale, the best predictors to TP
were the percentage of the sewer system coverage and the monthly average rainfall. These predictors
explained 71.1% of the variance in TP concentration. The coefficient multiple regression (0.843) presents
that there is a very strong direct relationship between the simulated data with predictors and observed
Page 7/20data. These results corroborate those of Darwiche-Criado et al. (2015) by associating phosphorus
concentrations with urban pollution sources. Furthermore, the multiple relationship confirms what was
discussed earlier for the influence of wastewater on phosphorus concentrations in rivers and on the effect
of large-scale rainfall.
The backward stepwise for TIN identified the urban area (%) as a moderate predictor, corroborating with
the findings by Cerqueira et al. (2019) for a watershed in the south of the Brazilian Northeast. However,
this predictor was only able to explain 21.3% of the variance of the independent variable. The multiple
regression coefficient corresponded to 0.461, 2-fold lower than that identified for total phosphorus. This
shows how complex the nitrogen dynamic is in these rivers when evaluating the large-scale.
Overlapping the effects of agriculture on urbanisation on water quality depends on the types of crops
deployed (Wan et al., 2014). Nevertheless, the low Pearson correlation between the number of agricultural
units per area may be due to the fact that most monitoring sites are downstream from urban centres,
where punctual discharges of urban wastewater start to exert greater influence on water quality. A
smaller-scale assessment could be more effective in detecting agricultural influence on nutrient
concentration, as performed by Cheng (2018) and Rodríguez-Romero et al. (2018). In this sense, new
water quality monitoring sites in the vicinity of agricultural areas could improve the understanding of the
influence of this type of land use.
4. Conclusions
This paper investigated the relationship between rainfall and nutrient transport in semiarid hydrographic
regions in Brazil, considering indicators of anthropogenic interference. The results revealed that the effect
of rainfall can be marginal, inverse, or positive for the increase of nutrient concentrations. Hence, there is
a more efficient transport of nutrients from the catchment to the rivers when there is greater intensity of
rainfall and fewer upstream reservoirs. This transport occurs more quickly for TIN than TP. The inverse
relationship between rainfall and nutrients occurs when the demographic density is higher and there are a
greater number of reservoirs in the watershed, or when there is strong interference from point source
pollution.
On a large scale, the most representative predictors of TP concentrations were the sewer system coverage
and the monthly rainfall. On the other hand, for TIN, the most representative predictor was the percentage
of the urban areas. This reveals how much urbanisation and the lack of wastewater treatment are related
to nutrient concentrations on a large scale. A natural aspect also presented an important relationship –
the accumulated total precipitation, demonstrating that even under the same climatic conditions, the
distribution of rainfall influences the hydrological responses in water quality.
The findings of this study are essential for the understanding of nutrient concentrations in the rainy
season, which may guide water governance. In places with increased TP and TIN concentrations, during
the rainy season, actions to control erosion, protect river banks and natural sediment barriers can be
prioritized. In cases where precipitation did not have a great influence, the control of point sources of
Page 8/20pollution is even more urgent. It is noteworthy that the location of river sites for monitoring water quality
may have influenced the assessment. An expansion of monitoring sites close to agricultural areas would
be necessary to investigate the real impact of crops on the concentration of nutrients in river waters,
which can be carried out in future research.
Declarations
- Ethics approval and consent to participate:
Not applicable
- Consent for publication:
Not applicable
- Availability of data and materials:
Data will be made available on reasonable request
- Competing interests:
The authors declare that they have no competing interests
- Funding:
This study received financial support from the Ceará State Research Foundation - FUNCAP (Research
Grant PNE-0112–00042.01.00/16).
- Authors’ contributions:
Conceptualization: L. L. Freire, A. C. Costa and I. E. L. Neto; Methodology: L. L. Freire, A. C. Costa and I. E.
L. Neto; Formal analysis and investigation: L. L. Freire, A. C. Costa and I. E. L. Neto; Writing - original draft
preparation: L. L. Freire; Writing - review and editing: A. C. Costa and I. E. L. Neto; Supervision: I. E. L. Neto;
Project administration: I. E. L. Neto.
References
1. Ahiablame LM, Engel BA, Chabey I (2012) Effectiveness of Low Impact Development Practices:
literature review and suggestions for future research. Water Air and Soil Pollution 223:4253–4273.
https://doi.org/10.1007/s11270-012-1189-2
2. Albiero D, Silva MAD, Melo RP et al (2018) Economic Feasibility of Underwater Adduction of Rivers
for Metropolises in Semiarid Coastal Environments. Case Stud Water 10(2):215.
https://doi.org/10.3390/w10020215
Page 9/203. Álvarez X, Valero E, Santos RMR, Varandas SGP, Sanches Fernandes LF (2017) Anthropogenic
nutrients and eutrophication in multiple land use watersheds: Best management practices and
policies for the protection of water resources. Land Use Policy 69:1–11.
https://dx.doi.org/10.1016/j.landusepol.2017.08.028
4. Bowes MJ, Gozzard E, Johnson AC, Scarlett PM, Read DS, Armstrong LK, Harman SA, Wickham HD
(2012) Spatial and temporal changes in chlorophyll-a concentrations in the River Thames basin, UK:
are phosphorus concentrations beginning to limit phytoplankton biomass? Sci Total Environ
426:45–55. https://doi.org/10.1016/j.scitotenv.2012.02.056
5. Brazil National Water Agency. Atlas sewers: watershed depollution. http://
http://atlasesgotos.ana.gov.br/
6. Cerqueira TC, Mendonça RL, Gomes RL, Jesus RM, Silva DML (2019) Effects of urbanization on
water in a watershed in northeastern Brazil. Environ Monit Assess 192(65).
https://doi.org/10.1007/s10661-019-8020-0
7. Chen LD, Fu B, Xu JY, Gong J (2003) Location-weighted landscape contrast index: a scale
independent approach for landscape pattern evaluation based on “Source-Sink” ecological
processes. Acta Ecol Sin 23:2406–2413
8. Cheng P, Meng f, Wang F, Wang Y, Zhang L, Yang Q, Jiang M (2018) The Impacts of Land Use Patters
on Water Quality in a Trans-Boundary River Basin in Northeast China Based on Eco-Funcional
Regionalization. Int J Environ Res Public Health. https://doi.org/10.3390/ijerph15091872
9. Cogerh (2022) Diagnosis of the Acaraú Hydrographic Region. Water Resources Management
Company of the State of Ceará. 324p
10. Costa AC, Estácio ABS, Souza Filho FA, Lima Neto IE (2021) Monthly and seasonal streamflow
forecasting of large dryland catchments in Brazil. J Arid Land 13:205–221.
https://doi.org/10.1007/s40333-021-0097-y
11. Costa AC, Foerster S, Araújo JC, Bronstert A (2012) Analysis of channel transmission losses in a
dryland river reach in north-eastern Brazil using streamflow series, groundwater level series and
multi-temporal satellite data. Hydrol Process 27(7). https://doi.org/10.1002/hyp.9243
12. Cruz MAS, Gonçalves AA, Aragão R, Amorim JRA, Mota PVM, Srinivasan VS, Garcia CAB, Figueiredo
EE (2019) Spatial and seasonal variability of the water quality characteristics of a river Northeast
Brazil. Environ Earth Sci 78. https://doi.org/10.1007/s12665-019-8087-5
13. Darwiche-Criado N, Jiménez JJ, Comín FA, Sorando R, Sánchez-Pérez JM (2015) Identifying spatial
and seasonal patterns of river water quality in a semiarid irrigated agricultural Mediterranean basin.
Environ Sci Pollut Res 22(23):18626–18636. https://dx.doi.org/10.1007/s11356-015-5484-5
14. De Araújo JC, Mamede GL, De Lima BP (2018) Hydrological Guidelines for Reservoir Operation to
Enhance Water Governance: Application to the Brazilian Semiarid Region. Water 10:1628.
https://doi.org/10.3390/w10111628
15. Freire LL, Costa AC, Lima Neto IE (2021) Spatio-temporal Patterns of River Water Quality in the
Semiarid Northeastern Brazil. Water Air and Soil Pollution 232:452. https://doi.org/10.1007/s11270-
Page 10/20021-05406-7
16. Freitas FRS, Righetto AM, Attayde JL (2011) Suspended solids and phosphorus load in a brazilian
semi-arid reservoir. Oecologia Australis 15(3). http://doi.org/10.4257/oeco.2011.1503.16
17. Funceme (2016) Funceme maps water resources in the Ceará with more detail and precision.
Funceme’s Communication Office. http://www.funceme.br/?p=1412
18. Gaiser T, Krol M, Frischkorn H, Araújo JC (2002) Global Change and Regional Impacts: Water
Availability and Vulnerability of Ecosystems and Society in the Semiarid Northeast of Brazil.
Springer, p 448
19. Hobbie SE, Finlay JC, Janke BD, Nidzgorski DA, Millet DB, Baker LA (2017) Constranting nitrogen and
phosphorus budgets in urban watersheds and implications for managing urban water pollution.
PNAS 144(6). https://doi.org/10.1073/pnas.1618536114
20. Jiang M, Chen H, Chen Q (2013) A method to analyze “source-sink” structure of non-point souce
pollution based on remote sensing technology. Environ Pollut 182:135–140.
https://doi.org/10.1016/j.envpol.2013.07.006
21. Julian JP, Beurs KM, Owsley B, Davies-Colley RJ, Ausseil AGE (2017) River water quality changes in
New Zealand over 26 years: response to land use intensity. Hydrol Earth Syst Sci 21:1149–1171.
http://dx.doi/10.5194/hess-21-1149-2017
22. Lee S, Hwang S, Lee SB, Hwang HS, Sung HC (2009) Landscape ecological approach to the
relationships of land use patterns in watersheds to water quality characteristics. Landsc Urban Plann
92:80–89. http://dx.doi.org/10.1016/j.landurbplan.2009.02.008
23. Li N, McGregor GR (2017) Linking interannual river flow river variability across New Zealand to the
Southern Annular Mode, 1979–2011: Souther Annular Mode and New Zealand River Flow. Hydrol
Process 31(12). http://dx.doi.org/10.1002/hyp.1184
24. Li Y, Jio J, Wang Y, Yang W, Meng C, Li B, Li Y, Wu J (2015) Characteristics of nitrogen loading and its
influencing factors in several typical agricultural watersheds of subtropical China. Environ Sci Pollut
Res Int 22. https://doi.org/10.1007/s11356-014-3446-y
25. Lim YK, Kovach SRM, Pawson S, Vernieres G The 2015/16 El Niño Event in context of the MERRA-2
Reanalysis: A comparison of the tropical pacific with 1982/83 and 1997/98.American
Meteorological Society, 30 (13). http://dx.doi.org/10.1175/JCLI-D-16-0800.1
26. Lima Neto IE, Medeiros PHA, Costa AC, Wiegand MC, Barros AM, Barros MUG (2022) Assessment of
phosphorus loading in a tropical reservoir with high seasonal water level changes. Sci Total Environ
815(1):152875. https://doi.org/10.1016/j.scitotenv.2021.152875
27. Lima Neto IE, Wiegand MC, Araújo JC (2011) Sediment redistribution due to a dense reservoir
network in a large semi-arid Brazilian basin. Hydrol Sci J.
http://dx.doi/10.1080/02626667.2011.553616
28. Liu J, Shen Z, Chen L (2018) Landscape and Urban Planning. Landsc Urban Plann 176:51–63.
https://doi.org/10.1016/j.landurbplan.2018.04.006
Page 11/2029. Liu J, Shen Z, Chen L (2018) Landscape and Urban Planning. Landsc Urban Plann 176:51–63.
https://doi.org/10.1016/j.landurbplan.2018.04.006
30. Lorenzi AS, Cordeiro-Araújo MK, Chia MA, Bittencourt-Oliveira MC (2018) Cyanotoxin contamination
of semiarid drinking water supply reservoirs. Environ Earth Sci. http://dx.doi.org/10.1007/s12665-
018-7774-y
31. Mamede GL, Guentner A, Medeiros PF, Araújo JC, Bronstert A (2018) Modeling the Effect of Multiple
Reservoirs on Water and Sediment Dynamics in a Semiarid Catchment on Brazil. J Hydrol Eng
23(12). https://doi.org/10.1061/(ASCE)HE.1943-5584.0001701
32. Marengo JA, Alves LM, Alvala RCC, Cunha AP, Brito S, Moraes OLL (2018) Climatic Characteristics of
the 2010–2016 drought in the semiarid Northeast Brazil region. Anais da Academia Brasileira de
Ciências 90:1973–1985. http://dx.doi.org/10.1590/0001-3765201720170206
33. Marangon BB, Silva TA, Calijuri ML, Alves SC, Santos VJ, Oliveira APS (2020) Reuse of treated
municipal wastewater in productive activities in Brazil’s semi-arid regions. J Water Process Eng
37:101483. https://doi.org/10.1016/j.jwpe.2020.101483
34. Marques ET, Gunkel G, Sobral MC (2019) Management of Tropical River Basins and Reservoirs under
Water Stress: Experiences from Northeast Brazil. Environments 6(2):62.
https://doi.org/10.3390/environments6060062
35. Mello K, Taniwaki RH, Paula FR, Valente RA, Ranfhir TO, Macedo DR, Leal CG, Rodrigues CB, Hughes
RM (2020) Multiscale land use impacts on water quality: Assessment, planning, and future
perspectives in Brazil. J Environ Manage 270. https://doi.org/10.1016/j.jenvman.2020.110879
36. Molisani M, Becker H, Barroso HS et al (2012) The influence of Castanhão reservoir on nutrient and
suspended matter transport during rainy season in the ephemeral Jaguaribe river (CE, Brazil).
Brazilian J Biology 73(1). http://dx.doi.org/10.1590/s1519-69842013000100013
37. Namugize j, Jewitt G, Graham M (2018) Effects of Land Use and Land Cover Changes on Water
Quality in the uMngeni River Catchment, South Africa. Phys Chem Earth 105:247–264.
https://doi.org/10.1016/j.pce.2018.03.013
38. Nascimento Filho SL, França EL, Melo Júnior M, Moura AN (2019) Interactions between benthic
microalgae, nutrients and benthic macroinvertebrates in reservoirs from the semi-arid Neotropical
region. Fundamental and Applied Limnology 192(3):237–254.
http://dx.doi.org/10.1127/fal/2019/1180
39. Paula Filho FJ, Sampaio AD;S, Menezes JMC, Costa CTF, Santiago MO (2019) J Arid Environ
163:41–49. https://doi.org/10.1016/j.jaridenv.2019.01.001
40. Raulino JBS, Silveira CS, Lima Neto IE (2021) Assessment of climate change impacts on hydrology
and water quality of large semi-arid reservoirs in Brazil. Hydrological Sciences Journal, 66 (1), 2021
41. Reis GA, de Souza Filho FA, Nelson DR, Rocha RV, Silva SMO (2020) Development of a drought
vulnerability index using MCDM and GIS: study case in São Paulo and Ceará, Brazil. Nat Hazards
104:1781–1799. https://doi.org/10.1007/s11069-020-04247-7
Page 12/2042. Rocha MJD, Lima Neto IE (2021) Modeling flow-related phosphorus inputs to tropical semiarid
reservoirs. J Environ Manage 295:113123. https://doi.org/10.1016/j.jenvman.2021.1133123
43. Rocha MJD, Lima neto IE (2022) Phosphorus mass balance and input load estimation from the wet
and dry periods in tropical semiarid reservoirs. Environ Sci Pollution Res 29:10027–10046.
https://doi.org/10.1007/s11356-021-16251-w
44. Rodríguez-Romero AJ, Rico-Sánchez AE, Mendonza-Martínez E, Gómez-Ruiz A, Sedeño-Diaz JE,
López-López E (2018) Impacto f Changes of Land Use on Water Quality, from Tropical Forest to
Anthropogenic Occupation: A Multivariate Approach. Water, 10 (11), 1518.
https://doi.org/10.3390/w10111518
45. Santana LM, Moraes MEB, Silva DML, Ferragut C (2016) Spatial and temporal variation of
phytoplankton in a tropical eutrophic river. Brazilian J Biology 76(3). https://doi.org/10.1590/1519-
6984.18914
46. Schliemann S, Grevstad N, Brazeau RH (2021) Water quality and spatio-temporal hot spots in an
effluent-dominated urban river. Hydrol Process 35:e14001. https://doi.org/10.1002/hyp.14001
47. Soares MO, Campos CC, Carneiro CC et al (2021) Challenges and perspectives for the Brazilian semi-
arid coast under global environmental changes. Perspect Ecol Conserv 19(3):267278.
https://doi.org/10.1016/j.pecon.2021.06.001
48. Souza Filho FA, Lall U, Porto RLL (2008) Role of price and enforcement in water allocation: insights
from Game Theory. Water Resour Res 44(12). https://doi.org/10.1029/2007WR006163
49. Thiessen AH (1911) Precipitation averages for large areas. Mon Weather Rev 39:1082–1084.
https://doi.org/10.1175/15200493(1911)39%3c1082. b:PAFLA%3e2 0.CO;2
50. Uvo C, Berndtsson R (1996) Regionalization and Spatial properties of Ceará State rainfall in
northeast Brazil. J Phys Res 101(2):4221–4233. http://doi.org/10.1029/95JD03235
51. Van Langen SCH, Costa AC, Neto GGR, van Oel PR (2021) Effect of a reservoir network on drought
propagation in a semi-arid catchment in Brazil. Hydrol Sci J 66(10):1567–1583.
https://doi.org/10.1080/02626667.2021.1955891
52. Vilmin L, Mogollón JM, Beusen AHW, Bouwman AF (2018) Forms and subannual variability of
nitrogen and phosphorus loading to global river networks over the 20th century. Glob Planet Change
3249. https://doi.org/10.1016/j.gloplacha.2018.02.007
53. Wadnerkar PD, Andrews L, Wong WW et al (2021) Land use and episodic rainfall as drivers of
nitrogen exports in subtropical rivers. Sci Total Environ 758:143669.
http://dx.doi.org/10.1016/j.scitotenv.2021
54. Wan R, Cai S, Li H, Yang G, Li Z, Nie X (2014) Inferring land use and land cover impact on stream
water quality using a Bayesian hierarchical modeling approach in the Xitiaoxi River Watershed,
China. J Environ Manage 133:1–11. http://doi.org/10.1016/j.jenvman.2013.11.035
55. Wang G, A Y, Xu Z, Zhang S (2013) The Influence of Land Use Patterns on Water Quality at Multiple
Spatial Scales in a River System. Hydrol Process 28(20):5259–5272.
http://dx.doi.org/10.1002/hyp.10017
Page 13/2056. Wang Y, Li Y, Liu X et al (2014) Relating land use patterns to stream nutrient levels in red soil
agricultural catchments in subtropical central China. Environmental. Sci Pollution Res.
https://dx.doi.org/10.1007/s11356-014-2921-9
57. Wang YB, Liu CW, Lee JJ (2015) Differentiating the Spatiotemporal Distribution of Natural and
Anthropogenic Processes on River Water-Quality Variation Using a Self-Organization Map with Factor
Analysis. Arch Environ Contam Toxical 69:254–263. https://dx.doi.org/10.1007/s00244-015-0167-2
58. Wiegand MC, Nascimento ATP, Costa AC, Lima Neto IE (2021) Trophic state changes of semi-arid
reservoirs as a function of the hydro-climatic variability. J Arid Environ.
http://dx.doi.org/10.1016/j.jaridenv.2020.104321
59. Wijesiri B, Deilami K, Goonetilleke A (2018) Evaluating the relationship between temporal changes in
land use and resulting water quality. Environ Pollut 234:480–486.
https://doi.org/10.1016/j.envpol.2017.11.096
60. Wunderlin DA, Díaz MP, Amé MV, Pesce SF, Hued AC, Bistoni MLA (2001) Pattern recognition
techniques for the evaluation of spatial and temporal variations in water quality, a case study:
Suquía river basin (Córboda-Argentina). Water Res 35(12):2881–2894.
http://doi.org/10.1016/s0043-1354(00)00592-3
61. Xu j, Jin G, Tang H, Mo Y, Wang YG, Li L (2019) Response of water quality to land use and sewage
outfalls in different seasons. Sci Total Environ 696. https://doi.org/10.1016/j.scitotenv.2019.134014
62. Xue Y, Song J, Zhang Y, Kong F, Wen M, Zhang G (2016) Nitrate Pollution and Preliminary Source
Identification of Surface Water in a Semi-Arid River Basin, Using Isotopic and Hydrochemical
Approaches. Water 8:8. http://dx.doi.org/10.3390/w8080328
63. Yao Y, Dai Q, Gao R et al (2021) Effects of rainfall intensity on runoff and nutrient loss of gently
sloping farmland in a karst area of SW China. PLoS ONE 16(3):e0246505.
https://doi.org/10.1371/journal.pone.0246505
64. Zhang X, Yi Y, Yang Z (2020) Nitrogen and phosphorus retention budgets of a semiarid plain basin
under different human activity intensity. Sci Total Environ 703:134813.
http://dx.doi.org/10.1016/j.scitotenv.2019.134813
Figures
Page 14/20Figure 1
Hydrographic regions, main river, urban area and large reservoirs in study area (Acaraú (AC), Banabuiú
(BN), Coreaú (CO), Alto Jaguaribe (AJ), Médio Jaguaribe (MJ), Baixo Jaguaribe (BJ), Litoral (LT),
Metropolitanas (MT), Salgado (SL) and Sertões de Crateús (SC)).
Page 15/20Figure 2
Land-use indicators, nutrients concentration average and monthly average rainfall per hydrographic
region (Acaraú (AC), Banabuiú (BN), Coreaú (CO), Alto Jaguaribe (AJ), Médio Jaguaribe (MJ), Baixo
Jaguaribe (BJ), Litoral (LT), Metropolitanas (MT), Salgado (SL) and Sertões de Crateús (SC)).
Page 16/20Figure 3
Number of reservoirs per watershed per lake surface area (ha) (Acaraú (AC), Banabuiú (BN), Coreaú (CO),
Alto Jaguaribe (AJ), Médio Jaguaribe (MJ), Baixo Jaguaribe (BJ), Litoral (LT), Metropolitanas (MT),
Salgado (SL) and Sertões de Crateús (SC)).
Page 17/20Figure 4
Pearson’s correlation (Rn x TIN, Rn x TP, TP x TIN) for each hydrographic region. (Rn – Rainfall (mm), TIN
– Total Inorganic Nitrogen (mg/L), TP – Total Phosphorus (mg/L). (Acaraú (AC), Banabuiú (BN), Coreaú
(CO), Alto Jaguaribe (AJ), Médio Jaguaribe (MJ), Baixo Jaguaribe (BJ), Litoral (LT), Metropolitanas (MT),
Salgado (SL) and Sertões de Crateús (SC)).
Page 18/20Figure 5
Linear regression plots for hydrographic regions with correlation significant between rainfall and
nutrients. (C - concentration (mg/L), Rn - monthly rainfall, TP – Total phosphorus, TIN - Total Inorganic
Nitrogen) (Acaraú (AC), Banabuiú (BN), Coreaú (CO), Alto Jaguaribe (AJ), Médio Jaguaribe (MJ), Baixo
Jaguaribe (BJ), Litoral (LT), Metropolitanas (MT), Salgado (SL) and Sertões de Crateús (SC))
Page 19/20Figure 6
Pearson’s correlation between the variables evaluated considering all hydrographic regions
Page 20/20You can also read


