Effects of Violent Media Content: Evidence from the Rise of the UFC
←
→
Page content transcription
If your browser does not render page correctly, please read the page content below

Forthcoming in Journal of Health Economics

                           Effects of Violent Media Content:
                         Evidence from the Rise of the UFC

                   Jason M. Lindo, Texas A&M University, NBER, and IZA
                           Isaac D. Swensen, Montana State University
                         Glen R. Waddell, University of Oregon and IZA

                                              March 2022

                                               Abstract

       We document the effect of violent media on crime. Specifically, we evaluate the effects of
       The Ultimate Fighter, a hit TV show that features fighters competing in violent mixed
       martial arts and which brought Ultimate Fighting Championship into the mainstream.
       We estimate the effect of exposure to the show’s earliest episodes using panel data
       from police agencies across the United States and a strategy that uses network ratings
       prior to the show’s premier as an instrumental variable. We show that this exposure
       significantly reduced crime: these effects are particularly evident for assault, began in
       the month the show premiered, and persisted for many years. These estimates do not
       reflect systematic differences across geographic areas in their trends in crime rates prior
       to 2005. To complement our main results, we also investigate the effects of “UFC Main
       Events,” which air in bars and on Pay-Per-View. This analysis additionally suggests
       reductions in violence caused by viewership.

       JEL Codes: K42, L82, L83

   ∗
      Lindo (jlindo@tamu.edu) is a Professor at Texas A&M University, a Research Associate at NBER, and
a Research Fellow at IZA; Swensen (isaac.swensen@montana.edu) is an Associate Professor at Montana State
University; and Waddell (waddell@uoregon.edu) a Professor at the University of Oregon and a Research
Fellow at IZA. We gratefully acknowledge being included as one of the teams given access to Nielsen data
through the NBER-Nielsen Collaboration, led by Andrew Sweeting, Matt Gentzkow, and Jesse Shapiro.
Thanks to Dan Feenberg for his invaluable assistance in extracting Nielsen data for our analysis. David
Pritchard provided stellar research assistance. We thank Stefano DellaVigna, Matthew Gentzkow, Phil Levine,
Patrick Markey, Jesse Shapiro, and Michael Ward for helpful discussions. We also thank the MSU Initiative
for Regulation and Applied Economic Analysis for financial support.

                                                    1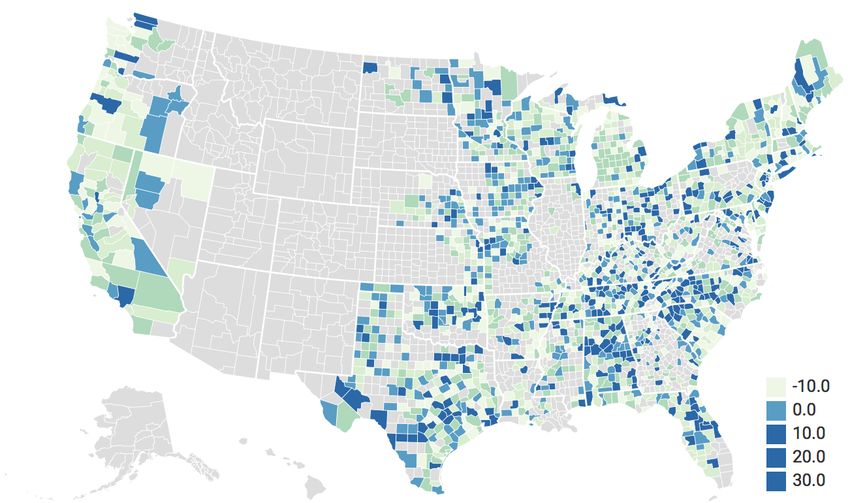
1         Introduction

There is a long history of social-science research on the effects of violent media content on
anti-social behavior. Laboratory experiments conducted by psychologists, which account
for a large share of the rigorous work on this topic, have demonstrated that violent media
content increases measures of aggression in the short run.1 This supports the notion that
media violence contributes to social problems, which is often cited as the consensus among
professionals.2 That said, this type of laboratory-based evidence is unable to account for the
fact that, in their every day lives, individuals make choices about the media they consume
and their behavior is affected by numerous other personal and contextual factors.3

        The fact that individuals typically choose what media they consume is a challenge for
researchers who seek to estimate the causal effects of media violence. Reverse causality is a
major threat to estimates of the relationship between violent-media consumption and violent
behavior, whether they are based on cross-sectional, time-series, or panel data. For this
reason, obtaining credible estimates of the causal effect of media violence requires an external
force that alters the media that individuals consume—a force that is otherwise unrelated to
violence. The power of laboratory studies is that the experimenter can play this role. That
said, laboratory studies have three key disadvantages: (i) they study the effects of media
content that individuals may choose not to consume in their every day life, (ii) they do not
observe individuals in their natural setting, and (iii) they typically evaluate subjects only over
a very short period of time. The pioneering study of Dahl and DellaVigna (2009) overcomes
these challenges by using field data and exploiting variation in the consumption of violent
media across the United States and over time that is driven by blockbuster movie releases.
    1
     We discuss this literature in Section 2.1.
    2
     In 2000, a joint statement from several professional groups concluded that “viewing entertainment
violence can lead to increases in aggressive attitudes, values and behavior.” In 2009, the American Academy of
Pediatrics issued a statement that the evidence is sufficiently convincing that violence in the media “represents
a significant risk to the health of children and adolescents” and that “the debate should be over.”
   3
     Some researchers have also criticized the methodology used in laboratory-based studies and meta-analyses
based on such studies. For example, see Ferguson et al. (forthcoming).

                                                       2
This earlier work finds no evidence that a violent blockbuster movie increases crime following
its release.4 In similar spirit, Markey et al. (2015) and Cunningham et al. (2016) examine
crime rates around the release of violent video games, finding no evidence that they increase
crime in the short run.

       Despite the important contributions of these earlier studies, there are many unanswered
questions about the effects of media violence on anti-social behavior. Perhaps most important
among them is how little we know about the longer-run effects.5 This is made more critical as
researchers often highlight “incapacitation effects” as a likely channel through which violent
media content might reduce violent behavior. Put simply, media consumption reduces violent
behavior because it involves the substitution of time towards an activity during which the
probability of violent behavior is low (e.g., watching a program) from activities during which
probabilities are higher. We therefore pursue our question with an interest in considering the
effects of repeated exposure to violent content over a sustained period of time. For example,
one could easily imagine a scenario in which consuming violent media initially reduces crime
due to incapacitation, but increases crime in the longer run due to the potential psychological
effects that are themselves persistent, or which accumulate through repeated exposure.6

       We take a step towards doing so by considering the effects of early exposure The Ultimate
Fighter (TUF), a hit reality-TV show that features fighters training for and competing in
violent mixed martial arts bouts. This show marked the first time that such fights were shown
on cable TV and has been credited with bringing Ultimate Fighting Championship (UFC)
into the mainstream. In a spirit similar to Kearney and Levine’s (2015) study of the effects
   4
      Interestingly, they find evidence that violent-movie releases reduce crime in the evening hours when
individuals are likely watching the movie and also in the subsequent nighttime hours. They attribute these
reductions to an incapacitation effect and reduced alcohol consumption.
   5
      The identification strategies used in Dahl and DellaVigna (2009), Markey et al. (2015), and Cunningham
et al. (2016) preclude analyses of longer-run effects.
   6
      For similar reasons, existing evidence from the lab and the field are not necessarily at odds with one
another. Lab-based studies are arguably seeking to identify psychological effects on propensities to engage
in anti-social behavior holding context constant. Field-based studies identify the effects on propensities to
engage in anti-social behavior inclusive of effects on context that may result from changes in how individuals
choose to spend their time.

                                                      3
of the show 16 and Pregnant on teen childbearing, we exploit variation in TUF viewership
generated by viewership patterns prior to TUF’s premier. In particular, we use Spike TV
ratings from the Monday time slot in which TUF would later air (which is based on content
that is quite different from TUF) as an instrumental variable for a county’s exposure to TUF.
Following Kahn-Lang and Lang (2019), we also control for Spike TV ratings across all days
and time slots prior to TUF’s premier to address the possibility that differences in Spike TV
viewership may correlate with crime trends or levels. We argue that the variation induced
by this instrument, combined with this control variable in particular, offers an intuitively
appealing research design that leverages idiosyncratic variation in viewership. We also provide
empirical evidence to support this idea.

   Our results indicate that early exposure to UFC content via the first season of TUF
significantly reduced anti-social behavior, as measured by monthly reports of crimes filed by
police agencies across the United States. Interestingly, the effects are particularly evident
for assaults, which is the crime that is most closely related to the content of the show itself,
though we find qualitatively similar effects on rape and on property crimes. Moreover, these
effects began in the month the show premiered and persisted for many years afterwards. In
support of our causal interpretation of these estimates, we show that the variation we exploit
is unrelated to pre-existing crime trends and levels. We also find estimates very close to zero
in “placebo tests” for effects prior to TUF’s premier. Further, using hourly crime data from
police agencies across the United States, we provide evidence that similar content depresses
violent crime in an analysis of “UFC Main Events,” which air in bars and on Pay-Per-View.

   While we have no way of determining exactly which mechanisms explain our main results,
our analysis of “UFC Main Events” is helpful towards this end in the sense that it demonstrates
reductions in violent crime during the time when individuals were consuming UFC-related
content. Naturally, our main results may be driven in part by reductions in crime when
individuals were watching new episodes of TUF. However, we would emphasize that the
explosion of UFC’s popularity caused by TUF leads us to believe that our estimates likely

                                               4
capture much broader impacts on time-use. In particular, we think of TUF viewership as
something that led to more-general interest in UFC-related content among its viewers and
their peers. As such, the effects of TUF we document may be explained by direct effects
and/or peer effects on time-use outside of the time when new episodes of TUF aired (e.g.,
watching re-runs on Friday nights and weekends, watching UFC content available from video
rental stores, watching UFC Main Events on Saturday nights, or learning/practicing martial
arts).7 Separately or in conjunction with any such time-use effects, our results may also be
explained by changes in the underlying psychological characteristics that affect an individual’s
propensities to engage in violence (or crime) in a given activity. For example, there could be
“catharsis” or “relief” effects whereby viewing UFC content (or engaging in related activities)
leads to temporary reductions in propensities to engage in anti-social behavior (for individuals
with preferences for such behavior).8 It is also possible that preferences could be altered by
the UFC’s glorification of violence by its realistic portrayal of serious injuries that can result
from physical altercations.9
In addition to contributing to the literature on the determinants of anti-social behavior,
our study also contributes to the growing literature on the real-world impacts of television-
media content. In one of the first rigorous studies in this literature, Gentzkow (2006) shows
that the introduction of television accounts for up to half of the decline in American voter
turnout since the 1950s. More-recent studies have found that some types of television
exposure improve children’s outcomes (Gentzkow and Shapiro, 2008; Kearney and Levine,
forthcoming; Cornelson, 2018) whereas other types of television impair children’s outcomes
7
It is quite possible that various amateur and professional fighting organizations have experienced rising
popularity as a result of TUF and UFC, or that they have been created in part because of such heightened
interest. Perhaps most notably, the North American Allied Fight Series, which almost exclusively held events
in Ohio for a decade, held its first event in September of 2005 and Belator had its first event in 2009.
8
Researchers have similarly implicated catharsis or relief effects in suggesting that pornography could
reduce sex crimes (Donnerstein et al., 1975; Posner, 1992).
9
Such effects could affect all forms of violence in which individuals’ behaviors are determined to some
degree by a weighing of costs and benefits (Becker, 1968). Violence is often categorized as instrumental
violence motivated by a desire for personal gain, virtuous violence in the service of a societal moral good
(Ginges and Atran, 2009; Fiske and Rai, 2014), and impulsive violence which involves a loss of self-control
(Dollard et al., 1939; Baumeister and Heatherton, 1996; Card and Dahl, 2011).
5(Hernæs et al., forthcoming), that television access affects voters’ preferences (Enikolopov
et al., 2011; Ellingsen and Hernæs, 2018), and that specific types of media content can have
significant impacts on birth rates (La Ferrara et al., 2012; Trudeau, 2016; Kearney and Levine,
2015).10 To our knowledge, our study is the first to document the causal impacts of television
content on crime.11
2 Background
2.1 Violent media content and behavioral outcomes
That witnessing violence can increase anti-social tendencies is often thought of through the
lens of social learning theory (Bandura, 1977). In this developmental framework, individuals
observe the behaviors of others (referred to as models) and consider imitating what they
observe based on their own characteristics, the characteristics of the models, and the observed
outcomes of the behavior. As a framework for understanding violence, social learning theory
finds support from decades of research. While also implicating the roles of parenting, peers,
and role models, for example, this literature also includes studies that document correlations
between aggression and violent media content. Though the largest part of this literature
focuses on violence in television and film, recent efforts have focused on violent video games,
often citing concerns surrounding the dramatic increases in time spent on gaming and the
intense violence that exists in many popular video games.12
10
For a survey of the literature on the impact of exposure to the media see DellaVigna and La Ferrara
(2015).
11
Studies examining the impacts of other forms of media content have found that that it can incite racial
violence. For example, Yanagizawa-Drott (2014) shows that radio programming in Rwanda calling for the
extermination of the Tutsi minority had a significant impact on participation in killings by militia groups
and ordinary civilians; Adena et al. (2015) shows that Nazi radio propaganda incited anti-Semitic acts by
ordinary citizens; and Ang (2020) shows that the fictional portrayal of the KKK in the film The Birth of a
Nation caused lynchings and race riots in the United States in the early 20th century. Internet expansion has
also been shown to influence sex crime in Europe (Bhuller et al., 2013).
12
This sub-area of study also includes experimental and survey evidence on the internet, music videos
and lyrics, television news, initial television access, and other forms of media. Additional studies explore
heterogeneity by viewer characteristics, social environments, and various forms of violent media content
6In cross-sectional and longitudinal survey data, the measurable correlation between viewing
violent content and violent, aggressive, or otherwise anti-social behavior is consistently positive
(Eron et al., 1972; Johnson et al., 2002; Anderson et al., 2003; Gentile et al., 2004; Anderson
et al., 2010). Importantly, though, this correlation has multiple contributors, one can imagine,
some of which are sure to include latent preferences for violent content among individuals
with anti-social tendencies, or confounding factors associated with both the viewing of
violent media and anti-social behaviors—we think of socio-economic factors, neighborhood
characteristics, peer effects, or parental influences, for example. As such, it is unlikely that
these studies offer valid estimates of causal effects.
That said, existing laboratory studies employing randomized controlled trials offer evidence
that viewing violent content increases aggressive tendencies.13 Such studies typically take
place in laboratories or schools where subjects are randomly assigned varying degrees of
exposure to violent content via a short video, film, or through active participation in a violent
video game. After being exposed to the content, subjects are asked to interact with each other.
While earlier studies allowed direct physical aggression among youth after exposure to violent
content (Parke et al., 1977; Josephson, 1987), more-recent studies focus on less-harmful or
alternative measures of anti-social tendencies. For example, these include white-noise shocks,
electric shocks, physiological arousal, empathy towards others, verbal aggression, and stated
attitudes toward violence and hostility (Anderson et al., 2003, 2010; Greitemeyer and Mügge,
2014). To be clear, outcomes in experimental settings are typically far removed from violent
crimes such as assault, rape, and murder. As such, laboratory studies provide limited insight
into the extent to which violent media affects more serious forms of violent behavior.
Another limitation of laboratory studies is that they can only measure effects over a short
time horizon, typically the length of time that subjects are observed in the lab. Likewise,
the typical experiment measures immediate effects shortly after a single exposure, and even
within each genre (Anderson et al., 2003).
13
We note that the robustness of this evidence has been called into question based on concerns about
replicability, publication bias, and study design. For example, see Ferguson et al. (forthcoming).
7experimental studies that involve cumulative exposure are still limited to relatively short
windows. The degree to which repeated exposure affects behavior over a longer timeframe
remains an important outstanding question.
As a whole, though they have likely overstated these effects (Hilgard et al., 2017), these
laboratory studies seem to provide compelling evidence that viewing violent media can increase
aggressive anti-social tendencies. This has led some researchers and health organizations to
make strong statements, concluding that “the debate is over” regarding the effects of violent
media content.14 That said, experimental analyses in the lab do not replicate real-world
choices to view media content, choices that may be influenced by alternative activities,
content-specific contextual factors, possible coping mechanisms, and wide-ranging content-
specific preferences over media consumption. In short, the controlled approach that lends to
a causal interpretation of results obtained in the lab, and which allows researchers to measure
psychological characteristics, may limit the generalizability of the findings to real-world effects
of violent-media consumption on behavior.
Attempting to fill this critical gap in the literature and overcome many of the limitations
of the lab, Dahl and DellaVigna (2009) uses a quasi-experimental approach to analyzing
violent crime around blockbuster movie releases. They find that blockbuster movies with
relatively high violent content decrease assaults the night of the movie, with especially large
declines in the hours following the conclusion of normal showtimes. Exploring mechanisms,
they provide evidence that incapacitation reduces assaults during the movie, and substitution
away from alternative activities (e.g., going to the bar), likely drive the larger reduction in
assaults after the movie. These results highlight that the effects of choices to view violent
content in real-world contexts may be very different from the effects found in laboratory
settings. Notably, Dahl and DellaVigna (2009) finds no effects in the three weeks following
exposure, though they acknowledge that their empirical approach is not well suited to estimate
14
See, for instance, Anderson et al. (2003) and Bushman and Anderson (2015), and the 2000 joint statement
from the American Academy of Pediatrics on the Impact of Entertainment Violence on Children.
8longer-run effects. It is also not well suited to estimating the effects of repeated exposure
to violent content. In contrast, the treatment we consider (early exposure to UFC content)
is understood to have generated the sort of fandom that entails frequent repeated exposure
over a sustained period of time.
Also offering evidence on the effects of violent media content, Cunningham et al. (2016)
uses an instrumental-variables strategy to estimate the effect of popular video-game releases
on violent crime. With time-series variation in retail sales of the 30 most-popular video games,
they instrument for sales with measures of quality and weeks on the market, ultimately
describing their results as indicating “no evidence of an increase in crime associated with
video games and perhaps a decrease.” Markey et al. (2015) provides suggestive evidence
that violent video games reduce violent crime using variation in video game release dates,
video game sales, and keyword searches for violent video game guides.15 As with Dahl
and DellaVigna (2009), these estimates are not consistent with the idea that violent media
content increases violent behavior, and thus further suggest a tension between the positive
effects found in the large lab-based literature and negative effects found in quasi-experimental
studies.
As with most studies that evaluate the behavioral effects of individual choices to consume
violent media content, a key limitation of our work is that we cannot determine whether
observed effects are driven by the sorts of psychological mechanisms that have been the focus
of lab-based research or whether they are the effects of changes in time-use. By considering
the paths of criminal behavior coming out of the “TUF natural experiment” for a longer
period of time than is typical, we at least hope to encourage further investigation into what
might cause such persistently different paths. Ultimately, separately identifying confounders
here can only be mitigated with richer data on time use and psychological characteristics.16
15
In a related context, Ward (2011) finds lower growth in crime rates in counties with relatively high
rates of growth in video-game stores. Ward (2199), instrumenting for own video-game playing with peer
video-game playing, finds no support in Add Health surveys for a causal relationship running from video
game playing to aggressive outcomes.
16
Dahl and DellaVigna (2009) infers the “voluntary incapacitation effects” based on the fact that violent
92.2 The Ultimate Fighter and the rise of the UFC
It’s amazing to think how close we came to not being here today. If it weren’t for
what these guys did, I don’t know if there would even be a UFC.
-UFC President, Dana White, at the The Ultimate Fighter “Season 1 Reunion” three years after it aired.
The Ultimate Fighter (TUF) is widely credited as having brought mixed-martial arts, and the
Ultimate Fighting Championship (UFC) in particular, into the mainstream. The UFC began
organizing and promoting mixed-martial-arts events, which aired on Pay-Per-View, in the
early 1990s. These fighting tournaments had minimal rules, no weight classes, took place in a
cage, and were famously referred to as “human cockfighting” by Senator John McCain in 1996
who lobbied to have the events banned. As a result, the events were banned in every state
with an athletic commission, making it difficult for them to be held in major markets. During
this period of time, UFC held events in Iowa, Mississippi, Louisiana, Wyoming, and Alabama.
In 1998 the UFC lost its Pay-Per-View distribution. The UFC subsequently modified its rules
and eventually secured sanctioning from California and New Jersey in 2000, thus allowing the
company to hold events in these states under the supervision of their athletic control boards.
Despite these steps towards legitimacy, the UFC was sold for just $2 million in January 2001.
New ownership did not lead to an immediate turnaround for UFC. UFC returned to
Pay-Per-View in late 2001 but events averaged only 150,000 Pay-Per-View buys in the
following three years. By 2004, the new ownership group had lost $34 million since 2001.
The ownership group subsequently doubled down on their investment in UFC, spending $10
million dollars to produce the reality TV show, The Ultimate Fighter.17
TUF premiered on a Monday night (January 17, 2005) on Spike TV, which was promoted
as “The First Network for Men.” New episodes aired weekly on Monday nights (11pm-
midnight) and each new episode re-aired the following Friday night (midnight), Saturday
movie releases significantly increase time spent in theaters and the fact that individuals are extremely unlikely
to commit crimes while attending a movie.
17
Previously, the same ownership group had success in promoting their casinos through the reality TV
series, American Casino.
10evening (7-8pm), and Sunday evening (5-6pm). New episodes aired in the time-slot following
the wrestling entertainment program, WWE Raw. The Spike TV content airing in November
2004 was for the most part quite different from TUF, which is desirable because we would
question whether additional violence was actually a part of the “treatment” if TUF was merely
replacing something similarly violent. In particular, the shows airing in November 2004 in what
would later become TUF’s Monday time slot included a comedy show featuring comedic actors
narrating footage from a 1980s Japanese game show featuring regular people attempting (and
almost always failing) to navigate an obstacle course (Most Extreme Elimination Challenge,
five times), a professional wrestling show (WWE Velocity, one time), a reality show about
young men quitting their jobs to pursue their dreams (I Hate My Job, two times), a show
about a video game (Need for Speed: Underground 2, one time), and a reality show featuring
a video game superfan (Ultimate Gamer, one time). Between November 2004 and the premier
of TUF, the shows airing in this time slot were Most Extreme Elimination Challenge, Ultimate
Gamer, 2004 Video Game Awards, The World is Not Enough (1999 James Bond film), and
Most Amazing Videos.
That said, it might be tempting to suggest that treatment here is merely one additional
hour or so of violent content each week. However, we see the advent of UFC on Spike
as a significant inducement mechanism into exposure to violence and inducing a scale of
fandom that is still impressive. In the two years after the show aired on Spike TV, UFC’s
revenue increased 1,258%, including a 1,700% increase in Pay-Per-View sales.18 The media’s
representation of the period is also decidedly one sided, with claims such as “Nothing really
goes back to ‘normal’ after The Ultimate Fighter. Not Spike. Not the UFC.”19 We return to
this point below.
What may have made the difference for the TUFs success is that it followed a format
18
Source: https://www.theguardian.com/sport/2016/mar/04/the-fight-game-reloaded-how-mma-
conquered-world-ufc
19
Source: https://www.bloodyelbow.com/2017/2/14/14600570/inside-the-ultimate-fighter-why-the-reality-
show-was-is-so-important
11similar to other reality shows, bringing together contestants to live and interact in the same
residence under nearly constant surveillance. TUF content is distinct from other reality
shows in its focus on fighters training for and participating in violent and often brutal mixed-
martial-arts bouts that occur in each one-hour episode as a part of a season-long tournament
for a “six-figure UFC contract.” These bouts as well as the preceding training and sparring
display frequent injuries, blood, choking, and similar content typical of mixed-martial-arts
events where the goal is to knock out or submit your opponent.20 It also features UFC stars
as coaches and guests.
TUF was considered an instant ratings success, as 1.7 million viewers tuned into the
initial episode. This represented a 36 percent increase over the shows that aired on the same
day and time slot in the previous year. The show continued to be popular throughout the
season and ultimately drew three-million viewers to its finale. TUF was considered Spike
TV’s first hit show and led to the production of UFC Unleashed, which aired fights from past
UFC events, UFC Fight Night, which aired fights live, and UFC Countdown specials, which
promoted upcoming events that were scheduled to air on Pay-Per-View. Naturally, it also
spawned many subsequent seasons of TUF—two annually—and is now in its 27th season.
As indicated by the UFC President’s quote at the beginning of this section, TUF is widely
viewed as a turning point for UFC’s popularity. A Yahoo Sports article describes TUF as
having “broke the UFC through to the masses.”21
20
While TUF centers on the fights, it also features the backgrounds of fighters in addition to drama,
aggression, and conflict among competing fighters living together. While the structure of the show varies over
its 27 seasons, the usual format divides between 14 and 32 contests into two teams as they live together, train
together, and compete in fights. Each episode features at least one fight, the loser of which is eliminated
from the tournament while the winner advances to the next round of fights. TUF has sparked careers for a
large number of fighters, including many who did not win the competition. As such, TUF fights are central
to the show not just because they determine who wins the competition in a given season, but also because
they provide a unique opportunity for participants to earn recognition and credibility from UFC executives
and a national television audience which can promote their professional careers. Eighteen TUF participants
(including seven who did not win their TUF season) have fought for a title and eight have become UFC
champions according to https://tvtropes.org/pmwiki/pmwiki.php/Series/TheUltimateFighter. The coaches
for each team are typically UFC star fighters who are scheduled to fight against each other in the featured
bout in the UFC Pay-Per-View event following the conclusion of the TUF season. These fights are heavily
promoted as the TUF season finale approaches.
21
https://sports.yahoo.com/ufcs-25th-anniversary-look-25-slideshow-wp-080028231/photo-p-2005-ultimate-
12This sentiment appears to be borne out based on an analysis of UFC’s Pay-Per-View
events, which continued to be held intermittently throughout the year, and which individuals
could pay to view through their cable provider. In Panel A of Figure 1 we report annual Pay
Per View buy-rates (across all events), which ranged between 278,000 and 415,000 between
2002 and 2004, doubled in 2005, and then exploded to more than five million for many years
thereafter.22
An analysis of Google searches between 2004 and the end of 2016—the results of which
are shown in panels B and C of Figure 1—also demonstrate the sizable and sustained interest
in UFC that followed the premier of TUF. Indeed, search activity for UFC grew after the
TUF premier such that it was comparable to searches for Oprah and Beyonce by the middle
of 2006, and such that it outstripped search activity for CSI, which was the highest rated
television show when TUF premiered and which was typically among the highest rated shows
throughout the 2000s. In contrast, peak search activity for the show 16 and Pregnant, which
has been credited with reducing the United States teen birth rate by 4.3 percent in the 18
months after it began airing in 2009 (Kearney and Levine, 2015), is an order of magnitude
lower. Searches for UFC also grew to be comparable to searches for other cultural touchstones
appealing to young men, including Call of Duty (the highest grossing video-game franchise in
the first-person shooter genre of all time) and the NHL (the fourth most searched professional
sport in the United States) while usually outstripping searches for LeBron James and Tom
Brady (who were arguably the most popular athletes in the NBA and NFL, respectively,
during the 2000s). As a whole, the results shown in Figure 1 highlight the cultural importance
of the UFC, which gives credence to the notion that the show responsible for its popularity
(TUF) may have had significant impacts on outcomes such as crime.23
fighter-reality-photo-080028393.html.
22
Data available from https://thesportsdaily.com/2018/02/16/all-time-ufc-ppv-sales-data-fox11.
23
Based on survey data from 2012, interest in mixed martial arts was highest among young men at the time,
but also quite substantial among and older age groups. For men, 67 percent of those aged 18-34 report being
fans, versus 49 percent of those aged 35-54 and 28 percent of those aged 55+. For women, 44 percent of those
aged 18-34 report being fans, versus 28 percent of those aged 35-54 and 15 percent of those aged 55+. Though
other less-prominent organizations featured female fighters, the UFC did not do so until until 2013. See https:
13To investigate the possibility that the sharp increase in UFC interest beginning in 2005
may be spurious, perhaps reflect increasing interest in violent media content more broadly, or
that TUF may have generated spillover effects that expanded interest in related content, we
have conducted similar analyses of WWE “professional wrestling” which Wikipedia defines
as a “form of wrestling and performance art involving matches whose progress and outcome
are planned in advance, typically between performers with established character roles.”24
The results of these analyses are shown in Appendix Figure A1. Pay-Per-View buy-rate
data indicate that interest in WWE fell from 2002 to 2004, rose from 2004 to 2005, then fell
fairly steadily thereafter.25 As such, 2002-to-2004 changes are not consistent with the notion
that TUF premiered in the midst of a secular increase in interest in related content. The
2004-to-2005 increase could reflect this sort of phenomenon, but could also reflect spillovers
from heightened interest in TUF and UFC or something else. Notably, WWE buy-rates fell
fairly steadily thereafter, in contrast to UFC buy-rates which again jumped dramatically
in 2006 and then rose again from 2007 to 2010. The results from our analysis of Google
searches—note that these are monthly instead of annual aggregates—also shows some evidence
of increased interest in WWE 2005. However, it actually fell at the beginning of 2005 when
TUF premiered and search interest for UFC grew. As such, these provide further support
for the popular idea that TUF (as opposed to changing interest in related content) was
//www.sportsbusinessjournal.com/Journal/Issues/2012/10/01/Research-and-Ratings/Up-Next.aspx. Based
on survey data from 2021, interest in UFC is also widespread across race and ethnicity. Specifically, 34 percent
of white people report being a casual or avid fan of UFC, versus 58 percent for Black people, 45 percent for
Hispanic people, and 50 percent for those reporting other race or ethnicity. Similar patterns are evident for
avid fandom. See https://www.statista.com/statistics/1122545/ufc-interest-ethnicity/. Moreover, UFC and
TUF have long featured successful fighters from a wide range of backgrounds. The first UFC event featured
four African American fighters. TUF Season 1 included two African Americans amongst the 16 competitors,
including Josh Koscheck who was prominently featured and went on to have an extensive career in the UFC,
including a title bout in 2010, despite losing in the TUF semi-final to the eventual winner. Many of the most
famous UFC fighters of all time are Mexican Americans, including its first middleweight champion (Frank
Shamrock), and many other champions, including Tito Ortiz, Cain Velasquez, and Carlos Condit. Moreover,
the TUF Season 1 winner was Diego Sanchez, a Mexican American.
24
WWE stands for “World Wrestling Entertainment” and was previously called WWF, which stands for
“World Wrestling Federation.” Recall that the television program WWE Raw aired in the time-slot prior to
TUF.
25
Data on these buy-rates are from http://www.2xzone.com/wwe/buyrates.shtml.
14responsible for increases in interest in UFC content after its premiere.26
3 Data
In order to measure TUF viewership, we use data collected by Nielsen, the primary source for
measuring exposure to television content in the United States. Nielsen collects show ratings
data from an array of sources including diaries, in-home metering and audio-recording meters
worn by participating individuals. They do so primarily during specific “sweeps months” of
the year, not throughout the entire year. We use their county level data on: viewership of
new episodes of Season 1 TUF airing Monday nights in February 2005; Spike viewership
in the same time slot in November 2004 (prior to TUFs premier); and overall Spike TV
viewership measured during November 2004. Our data extracts from Nielsen allow us to
calculate ratings for 55 percent of the United States population.27
Our main source for crime data is the “Offenses Known and Cleared by Arrests” segment
of the Uniform Crime Reports (UCR), which are a compilation of monthly crime statistics
contributed to by law-enforcement agencies across the United States to the FBI.28 We focus
on known offenses in order to capture crimes that come to the attention of law enforcement,
as opposed to restricting crimes to those that have been cleared by arrest. We make this
choice out of concern for the possibility that police-officer behavior may also be affected by
TUF viewership, in which case arrests may be affected independently of impacts on crime.
UCR data also include annual estimates of the populations covered by each agency, which we
use to calculate agency specific crime rates, per 10,000 residents. We restrict our sample to
26
The same figure also shows search intensity for the video game Call of Duty. This time series exhibits
spikes that coincide with new game releases. It also shows declining search intensity leading up to and during
the first season of TUF.
27
Due to the structure of the data request process, which required us to identify specific networks, dates,
and time periods, and because the show aired at slightly different times in different time zones, we do not
have accurate measures for all of these variables outside of the Pacific, Central, and Eastern time zones. Data
are also missing for counties from which Nielsen did not collect data in a given sweeps period.
28
The UCR Offenses Known data used in this study were collected and compiled by the Inter-University
Consortium for Political and Social Research (ICPSR).
15municipal police agencies and agency-years with 12 months of submitted crime reports.29
We then link agency-by-month UCR data with county level Nielsen ratings data, keeping
agencies for which these Nielsen data are available.30 Note that municipal agencies are
nested within counties. Nonetheless, we do not aggregate the agency level data to the county
level, because agencies in a given county do not necessarily report data for all (or the same)
years—changes over time within county-aggregated data can therefore reflect variation in the
composition of contributing agencies. Employing agency level data (along with our inclusion
of agency fixed effects in regression models) allows us to avoid this problem, while allowing
for clustering at the county level when estimating standard errors accounts for errors that
may be correlated across agencies within a county.31 The resulting dataset includes monthly
crime statistics from 8,750 municipal agencies in 41 states, spanning 2001–2016. In Table 1
we present summary statistics for this sample, with breakdowns of violent crime (assault,
rape, murder) and property crimes (theft, motor-vehicle theft, robbery).
4 Empirical strategy
Our identification strategy exploits the fact that people exhibit some degree of habit persistence
in television viewing, and this habit persistence causes some individuals to watch TUF when
it began airing who otherwise would not have watched the show (perhaps until learning about
it later). To fix ideas, consider someone who frequently watches Spike TV on Monday nights
in 2004. We would expect this person to be more likely than others, all else equal, to watch
TUF when it begins airing in January 2005 on Spike TV on Monday nights. This is the sort
of variation we seek to exploit, in a spirit similar to the Kearney and Levine (2015) analysis
of the effect of MTV’s 16 and Pregnant on teen childbearing using “pre-treatment” MTV
29
As we discuss in greater detail below, we have investigated estimates based on various subsets of this
data set that are aimed at having a more balanced panel, the results of which are similar to our main results.
30
Ratings data is available for 74 percent of agencies.
31
For an extensive discussion of these issues with county level UCR data, see Maltz and Targonski (2002).
16viewership in the relevant time slot as their instrument.
Just as 16 and Pregnant was very different from the content that made up Kearney and
Levine’s instrument, which helps to address concerns about selection bias, the Spike TV
content airing in November 2004 was for the most part quite different from TUF (as we
described in Section 2.2). That said, a skeptical reader may still be concerned that crime
propensities are correlated with watching Spike TV on Monday nights in 2004. After all,
men are more likely to commit crimes than women and Spike TV was promoted as “The
First Network for Men.”32
For this reason, we focus specifically on variation driven by 2004 Spike TV viewership in
the relevant time slot (in which new episodes of TUF would later air) controlling for overall
2004 Spike TV viewership. As such, the thought experiment is a comparison of individuals
who watch the same amount of Spike TV in 2004 overall, but one set of individuals typically
watches in the (future) TUF time slot while the other set of individuals watches at other
times. As a result of habit persistence, initial rates of TUF viewership will be higher for
the first set of individuals than for the second set of individuals—that is, there will be a
“first-stage” effect on early exposure to TUF. Under the assumption that crime propensities
are the same for the two sets of individuals, we could estimate the effect of early exposure to
TUF by comparing crime rates across the two groups after TUF begins airing, and inflating
this reduced-form estimate by the estimated first stage. With data on crime rates prior to
TUF, however, we can relax this assumption by comparing changes in crime rates across the
two sets of individuals. The validity of this approach rests on the common trends assumption
generally required by difference-in-differences designs.
To operationalize this strategy, data availability requires us to use county level ratings
32
It is along these lines that Jaeger et al. (2016, 2020) critique the Kearney and Levine (2015) analysis
of the effects of MTV’s 16 and Pregnant. Specifically, Jaeger et al. highlight that there are significant
level differences in outcomes associated with the instrument and that there is also evidence of differential
trends in outcomes associated with the instrument. In response, Kearney and Levine (2016) makes the case
that evidence of differential trends during an extended pre-treatment period does not imply that there are
differential trends over the relevant period of time.
17data and crime data from police agencies that are nested within counties. As such, we cannot
think about these data as offering the two convenient sets of individuals described in the
thought experiment outlined above. Nonetheless, the same sort of variation can be exploited
via two-stage least squares.
While we calculate two-stage least squares estimates—and standard errors associated
with these estimates—in the standard manner, here we discuss the first- and second-stages to
convey the intuition behind this approach. The first-stage regression equation corresponding
to our two-stage least squares estimates is:
RateT U Fac = ψ0 RateT imeSlot04ac + ψ1 RateSpike04ac + uac , (1)
where RateT U Fac is the Season 1 TUF rating for agency a’s county c, RateT imeSlot04ac is
the 2004 rating for the time slot in which TUF would later air (the excluded instrument),
and uac is a random error. RateSpike04ac is the 2004 rating for Spike TV across all days
and time slots—prior to TUF’s premier—which addressees the possibility that differences
in Spike TV viewership may correlate with crime trends or levels. Moreover, controlling for
overall viewership also frames the interpretation of estimated treatment effects more precisely.
By identifying the effects only off of independent variation in viewership in the future TUF
time slot, the inducement toward violent content is therefore from a conglomeration of the
shows that aired in the same time slot before TUF premiered in 2005.33
The second-stage regression equation illustrates how variation in RateT
\ U Fac , the predicted
Season 1 TUF rating, is used to identify the effects of TUF viewership on crime in the 40
quarters following its premier (and to produce placebo estimates for the eight quarters prior
33
Recall, these shows include Most Extreme Elimination Challenge, WWE Velocity, I Hate My Job,
Need for Speed: Underground 2, Ultimate Gamer, Most Extreme Elimination Challenge, the 2004 Video
Game Awards, The World is Not Enough, and Most Amazing Videos. See Section 2.2 for more background
discussion.
18to its premier). Specifically, the second-stage equation is
40
βj 1(QuartersF romP remiert = j)RateT
X
yact = \ U Fac + (2)
j=−8
40
θj 1(QuartersF romP remiert = j)RateSpike04ac +
X
j=−8
θac + δt + act ,
where yact is the natural log of the crime rate for police agency a in county c at time t,
RateT
\ U Fac is the first-stage predicted Season 1 TUF rating, RateSpike04ac is defined the
same way as in Equation (1), θac are agency fixed effects that capture any fixed differences
across agencies with time-invariant impacts on crime, δt are time-period fixed effects that
capture any time-varying shocks to crime that are common across agencies, and act is a
random error term.34
Without the RateSpike04ac interaction terms, Equation (2) would be identical to the
two-way fixed effects model that is commonly used for circumstances in which researchers seek
to exploit variation in treatment intensity to estimate treatment effects under a difference-
in-differences-like identifying assumption: that the variable generating treatment intensity
(RateT imeSlot04ac ) is unrelated to trends in the outcome. By including RateSpike04ac
interaction terms in the model, we relax this assumption. Specifically, these interactions
capture the expected changes in crime rates over time for areas with different levels of overall
2004 Spike TV viewership. As such, the inclusion of this term makes it such that our estimates
are identified by comparing changes in crime for areas with relatively high ratings in the
TUF time slot before it aired to changes in crime for counties with relatively low ratings in
34
For simplicity, we refer to the outcome variable in the text as the log of the crime rate. However, to
address the fact that the number of crimes may be zero in some instances, making the natural log undefined,
we transform√counts using the inverse hyperbolic sine transformation. As such, the outcome variable is defined
count2 +1
as ln( count+
population ). We take this approach in order to use all of the data but it has little influence on
the resulting estimates because the observations for which it is relevant are given little weight in our (WLS)
regressions. Moreover, the results are similar extremely similar if we use alternative transformations.
19the TUF time slot before it aired adjusted for the differences in crime that are expected over
time across areas with different levels of overall 2004 Spike TV viewership.
We take this approach, additionally controlling for RateSpike04ac interaction terms, to
address potential concerns that there may be differences in trends associated with 2004
Spike TV ratings for the relevant time slot. It is motivated by Kahn-Lang and Lang (2019)
discussion of the exchange between Kearney and Levine (2015, 2016) and Jaeger et al. (2016,
2020), which highlights the importance of examining what factors might explain differences
in pre-treatment outcome levels even if such differences are differenced out in a difference-
in-difference design. Specifically, they argue: “[i]f we understand why the experimental and
control groups differ in levels, we may better understand whether to anticipate common
or divergent trends.” They go on to explain that we can be relatively “confident that we
have solved the problem with nature’s design of the experiment” if we are able to identify a
control variable that eliminates initial differences in outcomes (as well as any differences in
pre-treatment outcome trends) associated with treatment. In the next section, we show how
controlling for Spike TV’s overall rating in 2004 accomplishes this in our setting.
A few additional details of our analysis are worth mentioning. First, in order to improve
efficiency we use weighted-least squares, with agency jurisdiction populations as weights.
Second, the standard-error calculations allow errors to be correlated within counties over
time.35 Third, in addition to the disaggregated event-study type of model described here, we
also estimate a more parsimonious model to summarize the estimated effects.
35
Because the police agencies we consider are nested within counties, this implies that we are also allowing
errors to be correlated across police agencies in the same county. Our choice to cluster the standard errors at
the county level is motivated by the fact that the variation we exploit is at the county level and a desire to
address “design-based uncertainty” with regards to the natural experiment we exploit (Abadie et al., 2020).
Because the outcomes we analyze (crime rates) are based on all known crimes rather than a sample of crimes,
we anticipate little “sampling-based uncertainty” in our data, driven only by the fact that population counts
are typically measured with error. Nonetheless, we have also estimated standard errors allowing for clustering
at the Nielsen Designated Market Areas (DMA) level, which combine counties into roughly 200 areas. This
approach, which would accommodate errors that are correlated within each DMA, produces extremely similar
estimates.
205 Evidence for the validity of the research design
In this section we begin by showing that we have a strong first stage and then show evidence
to support the exclusion restriction required by our instrumental variables empirical strategy.
5.1 First-stage estimates
In Figure 2 and Table 2 we demonstrate the strength of the first stage. Specifically, the
first graphic in Figure 2 plots Season 1 TUF ratings (measured in February 2005) against
Spike TV ratings for the same time slot before TUF premiered (measured in November 2004),
with market sizes that vary with the population of the area it represents. The weighted-
least-squares estimate for this relationship, shown in Column (1) of Table 2, indicates that
a one-percentage-point higher rating in the relevant time slot before TUF premiered is
associated with a 0.62 percentage-point higher TUF rating.
As we discussed in detail in Section 4, this relationship may simply reflect relatively high
rates of TUF viewership in areas where a relatively large share of the population watched
Spike TV prior to TUF’s premier. This is not the sort of variation we seek to exploit. Our
thought experiment is a comparison of individuals who watch the same amount of Spike TV
prior to TUF’s premier, but one set of individuals typically watches in the (future) TUF time
slot while the other set of individuals watches at other times. The aggregate-data analogue is
to exploit differences in pre-TUF ratings across days and times among areas with the same
overall Spike TV ratings.
The second graphic in Figure 2 depicts this variation, by plotting Season 1 TUF ratings
adjusted for pre-TUF overall Spike TV ratings against Spike TV ratings for the same time
slot before TUF premiered also adjusted for pre-TUF overall Spike TV ratings. While a
bit weaker than the relationship depicted in the unadjusted plot, it again shows a strong
positive relationship that is additionally evident in the weighted-least-squares estimate shown
21in Column (2) of Table 2. This first-stage estimate indicates that a one percentage-point
higher rating in the relevant time slot before TUF premiered—holding overall Spike TV
ratings constant—is associated with a 0.52 percentage-point higher TUF rating (with an
F-statistic of 40). While we cannot determine whether this is due to habit persistence or
advertising, this estimate supports our hypothesis that TUF would have relatively high rates
of initial viewership in areas where a relatively large share of the population watched Spike
TV in its time slot before it premiered even after controlling for overall Spike TV ratings.
5.2 Exclusion restriction, common trends, common levels
Given our difference-in-differences identification strategy, in order to be valid the instrument
must be unrelated to changes in violent crime following TUF’s premier that would be expected
in the absence of the show (conditional on covariates). Given that we are conditioning on
overall Spike TV ratings, our instrument can be thought of as capturing the degree to which
residents of an area tended to watch Spike TV in the future TUF time slot versus watching
Spike TV at other times among areas where residents watch the same amount of Spike TV
overall. While we cannot say that this is random, we believe it is the sort of idiosyncratic
difference that makes for a convincing instrument if it can also hold up to closer scrutiny.
As a first pass at examining the degree to which this variation appears to be “as good
as random,” in Figure 3 we show a map of the United States that depicts this variation. It
demonstrates significant variation all across the country—importantly, it does not appear as
if the instrument takes particularly large values in any particular region, or in places that we
would expect to have particularly high (or low) crime rates or trends in crime rates.
We more formally examine the degree to which the variation we exploit is related to
pre-TUF crime rates in Figure 4. Specifically, in Panel A we focus on 2004 log of violent
crime rates and in Panel B we focus on the change in the log of violent crime rates from
2001 to 2004. Although the graphics labeled “Unadjusted” show that the levels and the
22trends of our outcome measure are positively related to pre-TUF Spike TV ratings in the
relevant time slot, the graphics labeled “Adjusted” demonstrate that controlling for pre-TUF
Spike TV ratings overall eliminates these relationships. In other words, the slope coefficients
and standard errors provided in the figure reveal statistically significant estimates in the
“Unadjusted” plots, while the “Adjusted” plots reveal no such significance. Using the language
of Kahn-Lang and Lang (2019), that we have a control variable that eliminates both the
initial difference and differential trends allows us to feel “confident that we have solve[d] the
problem with nature’s design of the experiment.” Thus, it provides support for the untestable
assumption that the variation we exploit is unrelated to the crime trends that would have
been observed in the absence of TUF.36
5.3 Main results
Having provided evidence in support of the research design, we now present estimates of
the causal effects of early viewership of The Ultimate Fighter (TUF)—early in time, not
youth—in order to speak to the effects of exposure to violent media content on crime. We
exploit variation in TUF viewership generated by geographic differences in viewership prior to
TUF’s premier, and its role in explaining the variation in first-season viewership. Specifically,
we use Spike TV ratings in the same Monday time slot in which TUF would later air as an
instrumental variable for a county’s early exposure to TUF.
In Figure 5 we plot second-stage coefficient estimates from the event-study type of
specification corresponding to our identification strategy, evaluating the effects on violent
crimes.37 Specifically, for each quarter we plot separate estimates of the effect of TUF on
36
Another identifying assumption not discussed in detail here is that pre-TUF Spike TV ratings in the
relevant time slot not have any direct impacts on crime rates after the TUF premier. Given the content that
was typically in that time slot—a variety of game shows and adult animated comedy, for example—we think
this a reasonable assumption. This position is reinforced by the fact that our analysis does not find any
evidence of impacts on crime prior in the year leading up to the TUF premier and we find evidence of an
immediate impact on crime when TUF begins airing.
37
Our measure of violent crime includes assault (simple and aggravated), rape, and murder.
23You can also read