Electric bikes get things rolling - The environmental impact of pedelecs and their potential
←
→
Page content transcription
If your browser does not render page correctly, please read the page content below

background // august 2014
Electric bikes get things rolling
The environmental impact of pedelecs
and their potential

For our Environment

Imprint

Publisher:
Federal Environment Agency (UBA)
Department I 3.1
PO Box 14 06
06844 Dessau-Roßlau
Tel: +49 340-2103-0
info@umweltbundesamt.de
Internet: www.umweltbundesamt.de

   /umweltbundesamt.de
   /umweltbundesamt

Authors:
Ulrike Wachotsch, Andrea Kolodziej, Bernhard Specht,
Regina Kohlmeyer und Falk Petrikowski

with the assistance of Caroline Ommeln, Katrin Dziekan,
Nadja Richter, Tina Mutert, Markus Menge and Manuela
Weber

Translated from German:
Nathaneil W. Fritz

Layout:
Umweltbundesamt

Download this paper:
http://www.umweltbundesamt.de/publikationen/
e-rad-macht-mobil

Photocredits:
Cover: © autofocus67 / Fotolia.de
p. 5: © Giant
p. 19, 20: Katrin Dziekan / UBA
p. 13: Backfiets.nl
p. 16: Andrea Kolodziej / UBA
p. 21: © Microstockfish / Fotolia.de
p. 22: www.inmod.de

Date: August 2014

Content

Synopsis / Abstract										4

1. Status Quo 										5
Electric bikes: facts and figures 								                              6

2. Possible applications and potential benefits of pedelecs 			         8
2.1 Pedelecs – possible applications 							     8
2.2 Infrastructure requirements and parking						14

3. Environmental impact of pedelecs 						                              15
3.1 Reduced energy consumption and CO2 emissions 					15
3.2 Reduced impact on air quality								15
3.3 Reduced space consumption and noise						                            16
3.4 Characteristics and environmental effects of battery types currently
    used in pedelecs 									                                           17
3.5 Returning and recycling pedelecs and rechargeable batteries			       19

4. Recommendations for action 							21

List of abbreviations										23
Notes												24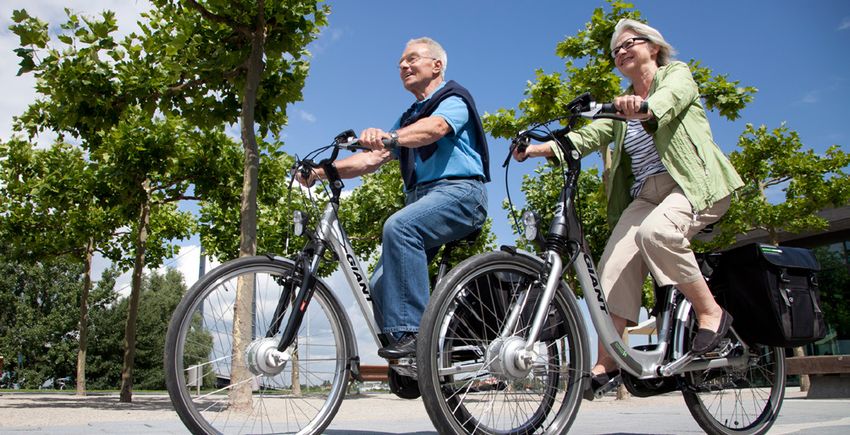
Synopsis / Abstract
Riding a pedelec is like riding a bike with the wind           The amount of energy a pedelec requires for a 10 km
at your back – one can take longer journeys than on            trip is roughly equal to the energy needed to bring
a conventional bike, without arriving drenched in              0.7 litres of room-temperature water to a boil. Given
sweat. Some 1.6 million electric bikes are currently in        Germany’s current energy mix, generating electricity
use on German roads. With a 95% market share, pe-              continues to emit pollutants; however, the proportion
delecs – bikes assisted by an electric motor – consti-         of pollutants resulting from generating electricity for
tute the majority of electric vehicles in Germany. Cyc-        pedelecs is only a fraction of that caused by a com-
ling is trendy, and increased use of pedelecs can help         bustion engine used to travel the same distance. The
support the German federal government in achieving             production and disposal of lithium-ion batteries –
its aim of increasing the cycling rate from its current        currently the most common battery type on pedelecs
level of 10% to 15%. Electric bikes offer a diverse            – burdens the environment with 22-30 kg C02e. When
range of advantages and possible uses: they make it            that is contrasted with the 21.5 kg CO2e saved per
easier for users to travel longer distances, allow them        100 km not driven in a car, after only 100 kilometres
to transport larger loads and to more easily overcome          of travel on a pedelec the battery’s greenhouse gas
natural obstacles, such as inclines and headwinds.             emissions have been balanced out. Sensible recycling
Furthermore, pedelecs are an alternative to company            of rechargeable batteries and of the bikes themselves
cars and an ideal transport option for recreational            further conserves resources.
activities and bike tours. The faster speeds that they
sometimes attain in comparison to conventional                 As part of an integrated transport planning scheme,
bikes and the greater demands with regard to secure            pedelecs are an important component of sustainable
parking require investment in infrastructure.                  mobility in cities, but also, most notably, in rural
                                                               areas. From an environmental perspective, this
Common questions regarding pedelecs involve their              type of electric vehicle should be embraced, actively
potential for sustainable mobility, and, above all,            promoted and encouraged in order to make pedelecs
their environmental impacts. This paper provides               appealing to more user groups as an attractive, inex-
answers to these queries. A pedelec puts more stress           pensive and environmentally sound form of transport
on the environment than a conventional bicycle                 that constitutes an alternative to private motorized
without an electric motor, but the relatively low              transport.
environmental impact level of pedelecs is certainly
offset when pedelecs are used in lieu of cars for trips.

Definition of terms

The terms pedelec, electric bike and e-bike are often used synonymously, yet also commonly used to mean different
things. As such, we have defined these terms below as we construe them to roughly explain the differences.

Pedelecs are electric bikes that are propelled with physical strength; additionally, up to a speed of 25 km/h, propulsion
is assisted by an electric motor with a maximum power output of 250 W. Pedelecs differ very little from conventional
bicycles in how they are operated.

E-bikes are bicycles with electric motors that can be ridden without pedalling, i.e. entirely electrically powered.

Electric bicycles is the general term for power-assisted bicycles, i.e. for pedelecs and e-bikes.

4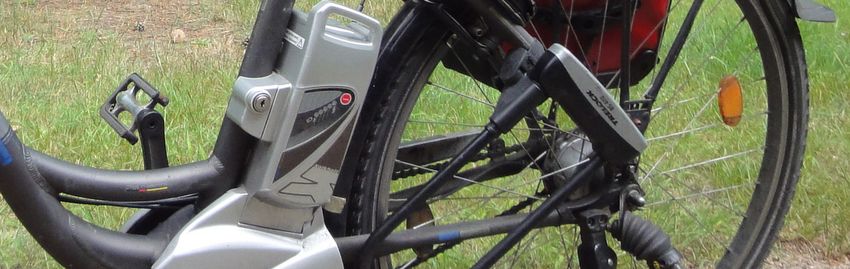
1. Status Quo
Mobility plays a major role in the society we live in.      Motorized private transport constitutes roughly
Preserving it for future generations – particularly         80% of the total kilometres travelled for passenger
considering the increasing scarcity of resources, and       transport. This leads to correspondingly high energy
environmental protection and conservation issues –          consumption, emissions of CO2 and other air pollu-
presents a great challenge. Increased cycle traffic can     tants per kilometre travelled. Walking and cycling
provide a good solution to this challenge.                  are environmentally friendly modes of transport that
                                                            cause almost no harmful emissions.
According to the survey Mobility in Germany 2008
(MiD 2008)1, bicycle traffic accounted for a 10% share      A Dresden University of Technology (TUD) study
of all trips; altogether, sustainable modes of transport    commissioned by the German Federal Environment
(public transport, pedestrian and bicycle traffic) held     Agency (UBA)5 examined the question of whether cy-
a 42% share. The growth of motorized private trans-         cling can contribute to a reduction in greenhouse gas
port has diminished since the 2002 survey, while sus-       emissions in Germany. It came to the conclusion that
tainable modes of transport have gained relevance.2         intelligent and environmentally sustainable transport
                                                            with integrated solutions is necessary for the future:
The German federal government is committed to sus-          employment of low or zero-emission vehicles, cycling
tainability, which itself serves as an engine for social    short trips, generally opting for shorter trips to closer
and political progress.3 The federal government has         destinations and improving conditions for the incre-
formulated specific tasks and targets in its national       ased use of sustainable modes of transport (walking,
strategy for sustainable development “Perspectives          cycling, public transport, car sharing, bicycle sharing
for Germany”. The main sphere of action is climate          schemes, etc.). Various measure-related scenarios in
and energy (a 50% reduction in global greenhouse            the study calculated a potential for CO2 reduction of
gas emissions by 2050 compared to 1990). Germany            between 10 and 30% in passenger traffic through an
aims to achieve a 40% reduction in its own green-           increase in cycling traffic.6,7,8
house gas emissions compared to 1990 by 2020, and
an 85-95% reduction by 2050 in comparison to 1990.          The aim of the federal government’s National Cycling
However, a look at CO2 emissions from all sectors           Plan 2020 (NRVP 2020)9 is to increase the cycling rate
since 1990 shows that only the transport sector had         for all trips to 15% until 2020. According to the sur-
no reduction in emissions; in fact, they rose. Techni-      vey MiD 2008, more than 75% of all trips are 10 km
cal developments to reduce CO2 were offset by a heavy       or less. The federal government sees electric bikes as
growth in traffic (kilometres travelled by car) in recent   having exceptional potential to increase the cycling
years.4                                                     rate for trips in that distance range.10

                                                                                                                    5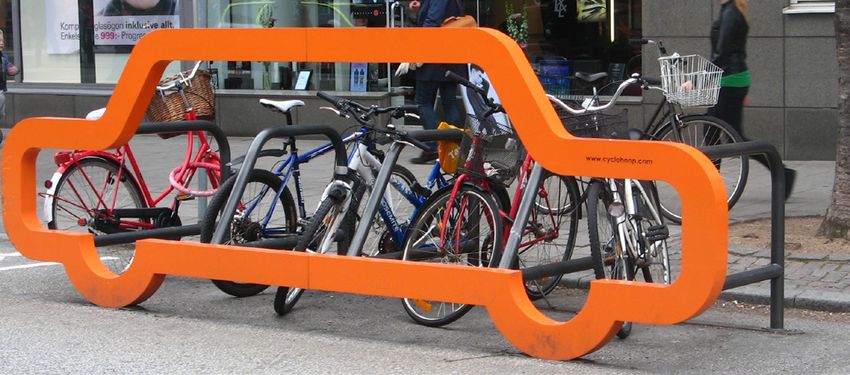
Fig. 1
Comparison of modal split in 2002 and 2008 (share of trips in %)
                                                  100
                                                         9      10
                                                  90
     Modal split (share of trips in per cent %)

                                                  80     23     24

                                                  70
                                                                             Bicycle
                                                         8
                                                  60            9
                                                                             On foot
                                                  50
                                                                             Public passenger transport
                                                  40
                                                         60     58
                                                                             Motorized private transport
                                                  30                         (drivers and passengers)

                                                  20

                                                  10

                                                    0
                                                        2002   2008

Source: Graph based on MiD 2008 (report on findings)

Electric bikes: facts and figures                                     The German Two-Wheeler Industry Association
In contrast to electric cars, growing demand has been                 (ZIV)14 estimates that electric bikes can make up a
observed in the bicycle sector in recent years. While                 15% share of all bicycles in the medium term; that
the automobile industry continues to invest conside-                  would be 10.65 million e-bikes. According to ZIV
rable sums in the development of electrically powered                 statistics, about 70,000 e-bikes were sold in 2007. By
vehicles (registered vehicles in Germany in 2013:                     2013 that figure had risen to 410,000 bikes (cf. Fig.
7,114 electric cars and 64,994 hybrid vehicles)11,12,                 2).15 More than one in ten new bikes sold in Germany
electrically powered bicycles have firmly established                 in 2013 was an e-bike. The retail market currently
themselves on German roads, with roughly 1.6 milli-                   offers over 1,500 different models and types of e-bikes
on such vehicles in use. The market for electric bikes                from over 70 bike manufacturers.16
has a distinct focal point: bikes with electric motors
that assist riders; they are commonly called pedelecs,                According to a representative survey, 90% of people
which is a portmanteau created from “pedal electric                   are familiar with e-bikes and pedelecs.18 Twelve per
cycle”. Insurance is not required for such bikes, and                 cent of Germans have already at least test ridden one
they can be ridden without a driving licence or moped                 of these new types of bikes, 47 per cent are interested
certificate. They are legally classified as bicycles and              in an electrically assisted bike, and 27% of Germans
can be ridden on cycle paths; riders are not required                 would be more likely to buy a bike with an electric
to wear helmets and pedelecs can also be taken on                     motor than a conventional bike. People over 50 are
public transport. Pedelecs constitute a 95% market                    especially likely to consider buying this new type of
share of all of the electrically powered bicycles sold                bicycle. In recent years, the popularity of and fami-
in Germany.13 The remaining 5% are electric bicycles                  liarity with electric bikes have grown.19 Pedelecs are
(e-bikes) that must be licensed and registered, have                  priced in the range of high-end bikes, which has had
a greater power output range and can be propelled                     a positive effect on sales volume in the bicycle retail
without pedalling.                                                    sector, despite a slight drop in the number of bicycles
                                                                      sold.20

6
The Research Institute for Regional and Urban De-                                      pedelecs enjoy a particularly high degree of populari-
velopment (ILS)21 in Dortmund conducted an online                                      ty in more rural and/or hillier areas.
survey on electric bikes in 2012.22 Over 2,000 peo-
ple were questioned; one quarter of them owned a                                       Research on the topic of electric bikes, pedelecs and
pedelec. The study showed that those surveyed had                                      e-bikes in Germany is only in the initial stages. Due to
a definite interest in the topic; roughly half of them                                 this fact, this background paper takes a special look
had already tried an electric bike. All in all, nearly                                 at findings from neighbouring European countries.
70% could imagine purchasing a pedelec. Another
interesting aspect of the findings is the distribution of
pedelec ownership based on location and topography:

Fig. 2
Number of electric bikes sold in Germany annually

                                                                                                 410,000
                                                                                       380,000
      Number of electric bikes sold

                                                                             310,000

                                                                   200,000

                                                         150,000
                                               110,000
                                      70,000

                                      2007      2008      2009      2010      2011      2012      2013
                                                                    Year

Source: ZIV, own depiction17

                                                                                                                                              7
2. Possible applications and potential benefits of pedelecs
2.1 Pedelecs – possible applications                         pedelec – even at such a distance the time difference
Electric bikes can, in part, replace passenger cars.         compared to a car is marginal. Furthermore, if one
Like bicycles, they are a sustainable mode of trans-         considers the time spent searching for car parking
port. They offer all the application possibilities of con-   at one’s destination and the higher costs (insurance,
ventional bikes, and more. Hardly anything changes           fuel, garage costs, etc.), it becomes evident that a
for users with regard to how they are operated.              pedelec is a true alternative to a car. The UBA sees a
                                                             particularly large potential for commuters who travel
Riding an electric bike produces hardly any emissions        distances of 5 to 20 km to work to shift those journeys
and, based on actual need, no or very little energy is       from cars to pedelecs. After analysing currently exis-
used. Furthermore, it is a virtually noiseless, space-       ting studies, it is fair to assume that the distribution
saving, health-promoting and low-cost means of               of the modal split will shift in favour of sustainable
transport. Pedelecs have still further environmental         modes of transport (walking, bicycles/pedelecs, buses
relevance due to their varied application possibili-         and trains) in the medium term, resulting in a corre-
ties and, by extension, due to the change in mobility        spondingly positive impact on the environment, the
behaviour associated therewith. Electric bikes offer a       climate and human health through decreased emissi-
high degree of flexibility and increase the potential to     ons of C02, air pollutants and noise.
replace car trips with electric bike trips. Electric bikes
broaden the sphere of activity of bike travel, espe-         Studies of modal shift (a shift from motorized private
cially for trips of distances between 5 and 20 km and        transport for travel to other, sustainable modes of
the transport of cargo/shopping and/or children.             transport) with a specific focus on pedelecs are not
                                                             currently available in Germany. However, studies
A pedelec expands the usage possibilities of a bike, in      from other countries do indicate positive effects on
these areas in particular:                                   modal shift: a qualitative long-term study was con-
                                                             ducted as part of the Austrian project Landrad (Rural
    1.   Pedelecs make it easier to travel longer            Bike).24 The use of pedelecs led to a shift from cars
         distances                                           and conventional bicycles to pedelecs. The cycling
    2.   Pedelecs make it possible to transport grea-        rate increased to as much as 50%, and sustainable
         ter loads                                           modes of transport were bolstered to a total of 34%
    3.   Pedelecs make it easier to overcome natural         among Landrad users. A study from the Netherlands
         obstacles, such as inclines and headwinds           identified great potential to increase bike travel
    4.   Pedelecs offer an alternative to company            among commuters – also ascertaining a cycling rate
         cars                                                growth of 50%.25 The cycling rate grows according to
    5.   Pedelecs are also ideal for recreational            further studies as well, albeit less drastically26 or at
         activities                                          the expense of other sustainable modes of transport.27

1. Pedelecs make it easier to travel long distances.         Transport experts see a great potential for relief in
People can travel significantly further with the same        large cities as a result of a shift from car trips (by
amount of physical exertion (e.g. for travelling to          commuters) to pedelec trips. The cities Copenhagen
work, educational facilities, training centres, shops,       and Berlin have already formulated concepts to that
etc.). They make cycling easier for people with lower        end in order to motivate commuters to switch to
physical fitness levels (e.g. elderly and physically         pedelecs. The cycling rate in Copenhagen is currently
impaired individuals).                                       44%. A network of high speed cycling paths is meant
                                                             to conduct the additional cyclists quickly and safely
The graph comparing trip distances and travel times          from residential areas into the city centre, and from
in Fig. 3 shows that a bike can be the fastest means of      railway stations to key destinations, such as universi-
transport in a city for trips of up to 5 km.23 Pedelecs      ty campuses.28
even compete favourably with cars for trips of up to 10
km. Distances of up to 20 km are unproblematic on a

8
Fig. 3
Trip comparison: door-to-door in city traffic*
Trip comparison: door-to-door in city-traffic*
60
50
Time in minutes
40
30
20
10
0
0 2 4 6 8 10 12 14
Distance in kilometres
On foot Bike Pedelec Bus & train Car
* Calculations for each mode of transport were based on a specific average speed: on foot = 4 km/h, bike = 15,3 km/h,
pedelec Øv = 18,5 km/h, bus & train = 20 km/h, car = 24,1 km/h.
Furthermore, acces and departure times were definded for each respective mode of transport = intersection with y axe.
Source: UBA expert estimate, as of July 2014
A similar trend can be observed in the traffic mix in very short survey periods). With the project Pede-
Berlin. While the share of motorized private trans- lection,30 the Federal Ministry for the Environment,
port in areas in the centre of the city comprises only Nature Conservation, Building and Nuclear Safety
32% and sustainable modes of transport play a very (BMUB)31 has initiated the first broader analysis of
prevalent role, commuter traffic from outside the city pedelec usage in Germany; the results have yet to be
is a different story: for such commutes, the share of presented.
motorized private transport is 62%. Due to this, the
Senate of Berlin is constructing a pedelec corridor for Pilot schemes with pedelecs in the region Haaglanden,
commuters within the framework of a pilot project for Netherlands
electromobility to conduct commuters from subur- In 2011, the region of Haaglanden, which is the
ban areas south of the city into Berlin’s inner city on metropolitan area surrounding The Hague, publis-
comfortable cycle paths. At key destinations along the hed a representative study on pedelec use. It was
route they plan to create secure bike parking and offer estimated that the number of trips made by bike
pedelecs for hire.29 could be increased by up to 5% while the number of
trips travelled by car could sink by up to 1.5%. The
Half of all car trips are less than 5 km. This indica- region hopes to further increase the cycling rate by
tes a vast potential for a shift from cars to bikes. No constructing a high-speed cycling path. As part of the
conclusive scientific findings on just how great the study Elektrische fiets in Haaglanden, Dutch traffic
potential of pedelecs in Germany is are available as planners analysed pilot projects in which participants
yet. Existing studies from Austria, Switzerland and were given the opportunity to test electric bikes for a
the Netherlands have resulted in values ranging from temporary trial period. The average distance of a trip
very low percentages up to 50%. However, these re- to work was around 12 km; the majority of the test
sults are not sufficiently reliable or representative due subjects normally commuted by car. After the trial,
to the research methods used (too few interviewees, roughly a quarter of the participants indicated they
9were planning to switch to an electric bike.32 Long-term profile of electric bike buyers in Basel
Electric bike buyers differ from average citizens in
Austria: Representative study and analysis of pedelecs Basel: as a general rule, they have higher incomes,
for women are more educated, are largely employed and are more
Around 50 to 60% of the population can potentially likely to have driving licences, yet less likely to own
purchase and use a pedelec, independent of age and their own cars. They also more frequently use car
respective intended purpose of use. This conclusion sharing services and buy monthly passes for local pu-
was drawn from the 2010/2011 Austrian study FEM- blic transport less often. The study did not ascertain
EL-BIKE, which comprised 4,600 interviews.33 It also differences with regard to the age or gender of pedelec
concluded that electric bikes are equally appealing buyers. These conclusions were derived from a long-
to women and men. A further 1,000 women were term study profiling electric bike buyers in Basel.34
surveyed for the study. To a certain extent, they have
different demands when it comes to pedelecs. For wo-
men, a bike’s suitability for daily use and roadworthi-
ness (lights, etc.), its weight, battery weight and ease
of operation are of primary importance.
Emission savings through switching trips from cars to pedelecs (modal shift)
The DUT study Potenziale des Radverkehrs für den Klimaschutz (Potential of Cycling to Reduce Emissions in Road Trans-
port),35 which was commissioned by the UBA, assumes that a significant share of car trips that are within a feasible
cycling distance could be shifted to bikes. Subsequently, the UBA estimates that one out of two trips of 10 km or less
could be shifted to a bike (Fig. 4 and Fig. 5). A Federal Highway Research Institute (BASt)36 study also sees an enormous
potential for a shift in trips from motorized private transport to bikes, and especially for the deployment of pedelecs in
areas with varied topography.37
The following calculation also accounts for pedelecs. According to Fig. 3 (trip comparison) a pedelec is the fastest mode
of transport in city traffic – it even shows that trip distances of up to 20 km are unproblematic with a pedelec.
According to the MiD study, the respective share of trips up to 10 km38 can be broken down as follows: 34% on foot, 14%
by bike, 44% with motorized private transport and 7% on public transport.
10Fig. 4
Modal split (share of all trips in per cent (%) for distances of up to 10 km)
Share of trips in per cent (%) for distances of up to 10 km
On foot
34 %
44 % Cycle traffic
Public passenger transport
Motorized private transport
14 %
7%
Source: MiD 2008
The assumption: 50% of car trips are instead travelled with bikes and/or pedelecs; this would increase the
cycling rate from 14 to 36%. Still further potential rests in an additional shift for trips between 10 and 20 km.
Fig. 5
Share of trips in per
Modal splitcent (%)of
(share fortrips
distances of up to
for distances of10
upkm if people
to 10 shift from
km if people shiftcars
fromto bikes
and pedelecs to makecarstrips
to bikes and pedelecs to make trips) in per cent (%)
22 %
On foot
34 %
Cycle traffic
7%
Public passenger transport
Motorized private transport
36 %
Source: UBA estimate
112. Furthermore, thanks to power assistance, these “Ich ersetze ein Auto“ (“I’m replacing a car”). The
bikes can also be used to transport larger loads goal is to test how cargo cycles can replace car courier
and/or further passengers, e.g. shopping and child- trips. The 40 electrically assisted cargo cycles deplo-
ren (see also image on page 13). yed have a load capacity of over 100 kg. It is estimated
that 85% of all courier trips by car can be substituted
In areas where urban business traffic is prevalent, with electric cargo cycle trips and that, as a result, an
cargo bikes and electric cargo cycles are especially appreciable emissions reduction will occur in compa-
well suited to replace compact vans, cars and motor- rison to delivery trips by car.41
cycles. The distribution of parcels, freight and mer-
chandise can be conducted quickly, emission-free and The German Traffic Club (VCD)42 has created an online
at a lower cost using cargo cycles. These advantages information portal about the use of cargo cycles for
over motorized transport pay dividends, particularly commercial and freight traffic:43 among other things,
in tightly packed and busy inner cities. the project Lasten auf das Rad (“Cargo on bikes”)
highlights the potential and application possibilities
The Deutsche Post AG has been relying on electric of cargo cycles – primarily with electric assist – in
cargo bikes for postal delivery transport since the commercial traffic.
year 2000; it currently deploys a total of 6,000 elec-
tric bikes throughout Germany. This eases the trans- With the project Pflegedienste machen mobil – Mit
port of letter carrying bags, which can weigh up to dem Elektrorad zur PatientIn (Nursing services get it
50 kg.39 rolling – visiting patients on electric bikes), Friends
of the Earth Germany in Bremen (BUND Bremen e.V.)
Long postal delivery routes in regions with lower was able to show that it is possible for mobile nursing
population densities can be completed more quickly services to substitute trips previously made by car
with a pedelec than with a conventional bike, and with electric bike trips within the inner-city. Nursing
in a significantly eco-friendlier manner than with a staff drive up to 50 km a day to visit patients.44 In
small delivery van. In 2012, a pizza delivery service addition to the positive environmental effects, such
that operates across Germany launched a trial that as CO2 reduction, lower space requirements, noise
entailed switching to an entirely electric-powered reduction and beneficial health impacts for users, the
fleet of delivery vehicles. As they generally transport project also ascertained clear cost benefits for nursing
solely small and light goods, they primarily deployed companies. Companies can purchase an electric bike
electric bikes and scooters.40 at no net cost by reducing the distance travelled by a
single car just 600 km a month.45
From 2012 to 2014 the Federal Ministry for the Envi-
ronment, Nature Conservation, Building and Nuclear
Safety (BMUB) is sponsoring a project titled
Table 1
Cost comparison for the deployment of cars and pedelecs by mobile nursing services
Car Pedelec
Monthly financing rate €143 €59
Insurance, liability insurance, taxes €55 €11
Maintenance costs for the financing period (monthly) €25 €25
Fuel costs per month (17,000 km per annum at €1.60/litre, or 25.3 cents/KWh of energy) €170 €3.30
€393 €98.30
Source: own depiction, adapted from Friends of the Earth, Bremen.46
123. Natural obstacles such as inclines and head- Due to the new “one-percent regulation”, pedelecs
winds can be offset via electric assistance, making it are now treated just as company cars in regards to
appealing to cycle in locations previously considered taxation. With the appropriate finance lease, compa-
inhospitable to cycling. nies can provide employees with a pedelec to travel to
and from work and for private trips for a low monthly
Campaign: Azubi-E-Bike (“Commuting with the trainee sum. The employee must pay a monthly tax on 1% of
e-bike”), Baden-Württemberg the list price of the non-cash benefit from his or her
A project within the scope of the National Cycling private use of a company bike. With such a measu-
Plan that runs until the end of 2014 is testing the re, enterprises can reduce the environmental stress
use of electric bikes among a target group of trainees their employees cause through daily commutes and
and university students. The Reutlingen Chamber of business trips within the scope of corporate mobility
Industry and Commerce (IHK Reutlingen)47 is imple- management. Moreover, they can use such schemes
menting the project. A series of pedelec road shows in to motivate employees and bolster their health, which
the region offers young adults the opportunity to test leads to fewer missed working days. A bevy of bene-
ride various electric bikes, and to borrow an e-bike fits for companies, the environment and employees.
for everyday use over a trial period of five to seven
days. Participants are interviewed and the findings 5. The appeal of electric bikes extends beyond
are evaluated with a special focus on the question of everyday commutes – their popularity is also growing
whether electric bikes could constitute a vital mode among recreational users.
of transport for this target group in a region with
varying altitudes. Bicycle hire companies, tourism regions49 and bike
tour companies have already been offering customers
The pedelec proved a suitable means to offset the pedelecs for some years now. Such services make
drawbacks of a bike for taking routes with uphill biking holidays attractive even to cyclists who are
climbs. The city of Tübingen recognized this and is less keen on athletically challenging endeavours.
taking a targeted approach to promoting the purchase Pedelecs have thus become an increasingly important
of electric bikes by offering a €100 subsidy. The city’s component of cycling tourism, which has grown into
aim is to increase the cycling rate for all trips made to a significant economic factor in Germany thanks to
50% by 2030.48 The acquisition of pedelecs is also di- initiatives like the German Cycle Network (Radnetz
rectly subsidized in Austria, Switzerland and France. Deutschland).
4. Companies can provide employees with company Six per cent of all cycle tourists now own an electric
pedelecs as an alternative to company cars, and/ bike that they use recreationally and while on holiday
or provide them with financial assistance to acquire (Trendscope study).50
them.
132.2 Infrastructure requirements and parking ment those solutions in order to eliminate barriers to
The question often arises as to whether existing se- pedelec use. Here, too, it is fundamentally true that
gregated cycling facilities can accommodate electric no new systems must be developed; parking facilities
bikes or whether new cycle paths and infrastructure for conventional bicycles are equally suitable for pe-
must be created. Individual travel speeds increa- delecs (e.g. parking must allow riders to lock bikes up
se with the use of electric bikes.51 According to the to the frame; there must be ample distance to the next
National Cycling Plan, this does, in part, raise the bike rack; generally, bikes must be easily accessible).
demands on infrastructure and street planning and However in addition, it is important to create ground-
design: this primarily applies to the breadth of cycle level parking facilities for pedelecs due to their grea-
paths, large curve radiuses, anti-skid surfaces, the ter weights and to supply more parking facilities with
avoidance of bollards, stairs and other obstacles. The- surveillance.
se are, however, general requirements of cycle paths
for conventional bicycles; a fact supported by a study Innovative bicycle parking systems do exist, and
commissioned by the Ministry of Transport, Building include, for example, large automated bicycle parking
and Regional Development in Mecklenburg-Vorpom- stations (where pedelecs and other electric bikes can
mern.52 As such, the existing 2010 German Guidelines be charged), cycle parks near bus stops and housing
for Cycling Facilities (ERA 2010)53 are in large part complexes, and even traditional bicycle parking faci-
sufficient for this new type of vehicle. lities and bike lockers – they must only be expanded
to cover greater areas, and, more specifically, adapted
However, it must be noted that the standards it re- to suit demand. This applies primarily to parking at
commends with regard to minimum widths, surface public transport stops, railways stations and other
quality and uniformity of cycling facilities have not destinations.
yet been achieved in many cities and municipalities.
A great deal of action must be taken by respective Good technical solutions and examples of bicycle
local administrative authorities to actually achieve theft prevention measures already exists, yet must
the defined quality standards.54 still be firmly established. In the Netherlands. a lo-
cking system was developed that allows stolen bikes
High-speed cycling paths should reduce travel times to be traced.56 Yet another model works in combinati-
for cycle traffic and increase travelling speeds. The on with a smart phone, also allowing owners to trace
construction standards for such facilities far exceed their bikes if they are stolen.57 Both of these solutions
those demanded by the ERA and are thus particularly are also suitable for conventional bikes. The Charge
suitable for electric bikes. They allow riders nearly & Lock Cable was presented at the 2013 EUROBIKE
junction-free routes to their destinations and provide trade show; it allows bikes to be secured and charged
ample space to overtake other bikes. In Germany the- simultaneously.58
re is consensus that high-speed cycling paths sensibly
supplement existing cycle path networks in conurba- A hybrid bus service to link important destinations
tions. The first segments have already been opened; is provided within the framework of the pilot pro-
furthermore, many on-going feasibility studies and ject INMOD – elektromobil auf dem Land (INMOD
planning measures indicate a growing implementati- Electromobility in rural areas)59 in Mecklenburg-
on of high-speed cycling paths in Germany.55 Vorpommern. Pedelecs for hire provide connections
to smaller localities. In this context, it is interesting
The lack of safe, ground-level bike parking is com- to note that hire pedelecs can be parked securely in
monly cited as a significant obstacle to the purchase bike lockers with integrated charging stations (see
and use of electric bikes. Sufficient secure parking also image on page 22).60 Among other accolades, this
facilities and secure charging stations, where requi- project won the 2012 E-Bike Award.61,62
red, are often lacking in both urban areas near blocks
of flats and at destinations, such as workplaces, retail
shops, recreational facilities and points of transfer to
other modes of transport (bus stops, railway stations,
carsharing stations). The UBA therefore recommends
searching for solutions and pressing ahead to imple-
143. Environmental impact of pedelecs
3.1 Reduced energy consumption and CO2 with a petrol engine are 39 times higher than those
emissions of a pedelec. The fuel costs per 100 km are 47 times
Due to their extended operating range, flexibility and higher for a car than for a pedelec. The amount of
manoeuvrability, pedelecs can most certainly compe- energy a pedelec requires for a 10 km trip is roughly
te with cars in city traffic (cf. Fig. 3, Chapter 2.1). Yet, equal to the energy needed to bring 0.7 litres of room-
even in sparsely populated areas where the preva- temperature water to a boil.
lence of bikes has until now been below average,
pedelecs can replace many trips once travelled by car. Overall, it can be concluded that switching from a car
to an electrically assisted bike can lead to conside-
Table 2 shows a comparison of the average energy rable emissions savings. Although, in comparison to
consumption for pedelecs and cars. The Transport bikes powered solely using physical strength, pedelec
Emission Model, a model to calculate the greenhouse use does cause emissions and consume energy (char-
gas und air pollutant emissions of motorized traffic, ging the battery); however, on the whole, the positive
was used to compute the figures for cars. The propor- effects of more people riding bikes instead of cars
tion of energy from upstream (indirect emissions), outweighs this apparent drawback.
which accounts for the expenditure of energy to
produce the fuel, or, as it were, the electric energy,
has been included. For a pedelec, this is the energy
required to generate the power needed to charge the
battery. As such, the total carbon emissions of a car
Table 2
Comparison of average energy consumption and carbon emission based on vehicle type for
cars and pedelecs, reference year 201163
CO2 emission per 100 km in kg
Energy
Energy Energy Upstream Energy costs
consumption Direct Total
carrier source (indirect per 100 km
per 100 km emissions64 emissions
emissions)
Car
petrol crude oil 7.9 litres 3.24 18.84 22.08 €12.00865
(petrol engine)
Car
diesel crude oil 6.7 litres 1.72 17.43 19.14 €9.44766
(diesel engine)
2011
electric German
Pedelec 1 kWh67 0,564 0.00 0.56468 €0.25369
energy electricity
mix
Source: Federal Environment Agency (UBA)
3.2 Reduced impact on air quality
Air pollutants such as nitrogen oxides (NOX), sulphur EU stipulated clean air plans require municipalities to
dioxide (SO2), carbon monoxide (CO) and particulate take measurements, which are conducted at a multi-
matter (PM10) can be hazardous to humans, animals tude of measuring stations in areas of urban traffic in
and ecosystems when they exceed certain limits. Germany. The levels of health endangering air pollu-
They negatively affect plants, bodies of water, soils tants NOX, SO2 and PM10 currently exceed air quality
and buildings70 and are responsible for ozone forma- limit values at many measuring stations.71
tion in the summer (especially NOX). Information on
effects and limits can be found on the UBA webpage Table 3 shows a comparison of air pollutants (in this
at http://www.umweltbundesamt.de/themen/luft/ case only PM10 and NOX) for specific vehicle types.
luftschadstoffe.
15Table 3
Comparison of air pollutant emissions for specific vehicle types, reference year 201072
NOX emission per 100 km in g PM10 emission per 100 km in g
Upstream Upstream
Direct Total Direct Total
(indirect (indirect
emissions emissions emissions emissions
emissions) emissions)
Car
8.60 22.04 30.64 0.0 0.36 0.36
(petrol engine)
Car
6.68 62.72 69.40 0.0 2.69 2.69
(diesel engine)
Pedelec 0.52 0.0 0.52 0.02 0.0 0.02
Source: Federal Environment Agency (UBA)
3.3 Reduced space consumption and noise construction of bike parking – offers the chance to
Frugal, ecologically and socially sound land use is a unseal and green surfaces or create areas for play and
decisive and crucial element of sustainable settlement recreation.76
and transport policy. Natural areas should be protec- Pedelecs take up roughly the same amount of space
ted and preserved.73 In the year 2000, roughly 130 as bikes and, due to their space efficiency, can meet
hectares of land were consumed per day. The German citizens’ demands for mobility, short journeys, welco-
federal government is aiming to cut land consump- ming spaces and peaceful residential environments.77
tion for settlement and transport infrastructure to a Between six and ten bikes can be parked in one car
maximum of 30 hectares per day.74 By the year 2010, parking space (cf. image below). Significant space
land use had already been reduced to 77 hectares a savings can be achieved if the potential of pedelecs to
day (or rather 87 hectares a day in the rolling four- replace one or several cars is exploited.
year average). However, these cuts primarily arose in
the areas of building spaces, open spaces and factory In general, the noise emissions from bikes are low;
spaces and were less a result of a reduction in space this is also true of pedelecs. Traffic noise can be
dedicated to transport infrastructure, which has reduced by shifting to quieter modes of transport.
remained stable in recent years.75 Bikes and cargo bikes, both with and without electric
In cities, capacity gains can be realized through the assistance, possess untapped potential in this realm.
use and promotion of space-saving modes of trans- Quieter surroundings are yet another reason people
port, such as pedestrian traffic, bike traffic and local and the environment profit from a growing cycling
public transport. Simply converting or redesigning rate. The largest reduction in noise can be accomplis-
selected car parking places can make an area signi- hed by converting roads into bike roads and pedest-
ficantly more welcoming, and – beyond allowing the rian zones and introducing 30 km/h speed limits. At
Conversion of a car parking space into bicycle parking (Ex. Malmö, Sweden)
1630 km/h, electric bikes can easily keep up with the battery exhibits special characteristics, so selection
flow of traffic. Furthermore, the introduction of such a for the various types of applications generally occurs
speed limit simultaneously increases the safety for all through a process of comparing and weighing up
road users. the demands the battery must meet. For example,
lithium-manganese-oxide batteries (LiMn2O4), which
3.4 Characteristics and environmental ef- are known for their stability and safety, have a lower
fects of battery types currently used in pede- energy density than lithium-cobalt-oxide batteries
lecs (LiCoO2); therefore, those who desire a battery of
Pedelecs derive their energy from rechargeable bat- equal weight that will allow them to travel the fur-
teries of numerous varieties and designs. Pedelecs in thest distance on their pedelecs may have to reach
Germany are currently almost exclusively equipped a compromise between safety needs and range. In
with lithium-ion batteries (Li-ion), and in rare cases the table below (cf. Table 4), the rechargeable battery
with nickel-metal hydride (NiMH) batteries.78,79 As types currently available on the market are compared
such, this paper does not address rechargeable bat- and selected summary statements are made regarding
teries with lead-acid (Pb) and nickel-cadmium (NiCd) their lifespans, ingredients, safety behaviour, costs
chemical combinations, which are still sometimes and energy density.
found in other countries. Each type of rechargeable
Table 4
Typical characteristics of rechargeable battery types used in Pedelecs
Lifespan/maximum no. of
Energy densi- Components/
Battery type charge cycles depending Advantages and disadvantages
ty in Wh/kg ingredients
on use
lithium
+ low self-discharge
manganese
Lithium-ion + high level of stability and
110 - 130 copper Up to 1,000 charge cycles
(LiMn2O4) safety
aluminium
+ low costs
graphite
lithium + low self-discharge
iron + very high level of stability
Lithium-ion phosphate over 1,000 charge cycles and safety
110 - 130
(LiFePO4) copper possible + can be charged quickly
aluminium + long lifespan
graphite + good raw material availability
lithium
cobalt
nickel + low self-discharge
Lithium-ion over 1,000 charge cycles
140 - 160 manganese + high energy density
(Li(NixCoyMnz)O2) possible
copper + long lifespan
aluminium
graphite
lithium
cobalt
+ low self-discharge
Lithiumionen nickel up to 1,000 charge cycles
140 - 160 + high energy density
(LiCoO2) copper possible
- high costs
aluminium
graphite
nickel
iron + very high level of stability
cobalt and safety
Nickel-metal
rare earths up to 1,000 charge cycles + low costs
hydride 55 - 100
(lanthanum, possible - Very high self-discharge rate
(NiMH)
cerium, (approx. 20% per month)
neodymium, - low energy density
praseodymium)
Source: summary depiction80
17Heavy metal content hed that, of all the additional components specifically
Based on a study from the Federal Institute for Ma- required for electric vehicles, battery production is
terials Research and Testing (BAM)81 commissioned the primary cause of environmental damage. The
by the UBA82, it can be concluded that lithium-ion same applies to electric bikes. Due to the additional
batteries are among the batteries containing the components required for pedelecs, bikes without
lowest amounts of the hazardous heavy metals mer- power assistance are the more ecological choice with
cury, cadmium and lead as per Batteries Act regulati- regard to climate change effects from production.
ons. The aforementioned study examined the heavy
metal content of commercially available batteries However, when measured against cars (with petrol
and rechargeable batteries, including eight different engines), pedelecs have the clear advantage. One of
Li-ion batteries, that are used in mobile phones. With the conclusions delineated in Chapter 3.1 was that pe-
maximum values of 0. 7 mg/kg of mercury, 0.5 mg/ delecs could most certainly compete with cars in city
kg of cadmium and 7.6 mg/kg of lead, all the Li-ion traffic due to their extended operating range, flexibi-
batteries tested in the sample remained well below lity and manoeuvrability. A simple comparison of the
the limit values and labelling thresholds (limit values: 22-30 kg of greenhouse gas emissions arising from
5 mg/kg of mercury, 20 mg/kg of cadmium; labelling the manufacture of a pedelec battery with the 21.5
threshold: 40 mg/kg of lead). kg of greenhouse gas emissions saved per each 100
km not driven in a car (cf. Table 2: 22.08 kg CO2 (car);
Environmental impacts of rechargeable battery 0.564 kg CO2 (pedelec) – including indirect/upstream
manufacturing emissions) shows that the battery’s greenhouse gas
The issue of the potential environmental impacts emissions have been balanced out after travelling
(life-cycle assessments) arising from the manufacture only 100 kilometres on a pedelec.
of batteries for pedelecs has, as yet, been examined
for two lithium-ion batteries with LiMn2O4 electrodes The long lifetimes of pedelec batteries
for application in electric bikes and for lithium cobalt Due to the high environmental relevance of battery
oxide electrodes. These life-cycle assessments (LSAs) manufacturing, a battery‘s lifespan is the decisive
conclude83 that the manufacture of rechargeable parameter when it comes to the climatic and environ-
batteries, i.e. the production of input materials and mental impacts of a pedelec: the longer a battery‘s
the manufacturing process, accounts for the largest life, the lower the environmental impact. In practice,
portion of their environmental impact. However – a pedelec rider’s cycling behaviour has an especially
due to the high cost of the recycling process – the net great influence on a battery’s lifespan. Taking simple
effect of recycling with respect to global warming measures during pedelec use can as much as double
potential is quite low. In total, the net respective CO2e the life of a battery. Some examples of influencing
emission84 per kWh of battery for manufacture and factors are:
disposal amounts to 55 kg CO2e/kWh for the Li-ion ▸ Temperature: excessively high (over 50 °C) or low
battery (LiMn2O4) and 75 kg CO2e/kWh for the Li-ion (under -10 °C) outside temperatures can irreversib-
battery with lithium cobalt electrodes. ly lower a battery’s capacity; temperatures bet-
ween 10 and 25 °C are ideal.
If these key figures are applied to the capacity (around ▸ Charging: avoid full charge and deep discharge;
0.4 kWh) of a typical pedelec battery, then the manu- battery management systems provide optimal
facture and disposal of such a battery causes green- regulation of this.
house gas emissions (CO2e) of 22 to 30 kg (55 to 75 kg ▸ Storage conditions: while storing a battery over the
CO2e/kWh x 0.4 kWh). Depending on the life of the winter, keep it at room temperature and charge it
battery, one or two additional batteries may possibly after a maximum of six months. Ideally, a battery
have to be added to this calculation over a pedelec’s should be charged to 30-40% capacity during
lifetime. storage.
Furthermore, a pedelec contains additional and The UBA battery advice brochure85 provides compre-
essential components that are not needed on bikes hensive descriptions of suitable measures to lengthen
without electric assistance, such as an electric motor. battery life.
For battery electric cars it has already been establis-
183.5 Returning and recycling pedelecs and compounds and the high energy density in Li-ion
rechargeable batteries batteries, particular caution should be exercised
Due to various ageing processes that depend upon when dealing with such batteries. Typical hazards
time (calendrical ageing), environmental conditions arise through internal short-circuiting (resulting from
and user behaviour (cf. Section 3.4), the available damage to the batteries caused by mechanical stress),
battery capacity decreases with a pedelec’s use. As external short circuits (e.g. via contact with water,
a rule, a battery has reached the end of its lifetime touching both poles) and through overheating of the
when 80% of the nominal capacity originally speci- lithium accumulator cells. In light of this, following
fied by the manufacturer can no longer be reached. the prescribed procedures for collection and recycling
Thus, as the number of pedelecs sold annually grows is extremely important.
(cf. Fig. 2), in future, a time-delayed heavy increase in
the quantity of discarded rechargeable batteries will The collection rate for old batteries containing lithium
ensue. remains low. The collection rate for portable lithium
Lithium-ion batteries contain many recyclable materi- batteries, i.e. the share of old batteries collected in
als (cf. Table 4). As such, it is important to channel old proportion to the quantity introduced to the market,
batteries onto the right disposal and recycling routes. was only 6% in 2011.88 The collection rate for pedelec
batteries was roughly the same. The main reason for
Battery collection this is the long service lives of these batteries, which
The German Batteries Act (BattG)86 stipulates that old results in a lag in return time for recycling for as long
batteries be collected separately from household was- as the market continues to grow. Another probable
te to facilitate the environmentally friendly recycling factor in this is interim storage in households and,
and disposal of spent batteries. As pedelec batteries quite possibly, improper disposal in residual waste
are used to power electric vehicles, they fall into the bins.
“industrial batteries” category as legally defined in
the Batteries Act. Distributors take back old industri- Collection of old pedelecs
al batteries free of charge. This applies to Li-ion and As electric-powered sports equipment, electric bikes
NiMH batteries, as well as all other types of pedelec fall within the scope of the Electrical and Electronic
batteries that might stem from older pedelec models. Equipment Act89 (ElektroG,90 Category 7) as long as
In addition, commercial battery disposal facilities can they are considered vehicles that do not require type
also collect old industrial batteries. approval. Old electrical equipment, and subsequently
old pedelecs, can be returned at no cost to municipal
In practice, the Foundation for a Common Battery collection points such as recycling centres.
Collection Scheme (GRS)87 and the ZIV have instituted
an initiative for the collection of old pedelec batteries; Owing to the potential hazards and special
30 pedelec manufacturers and over 2,000 bike shops requirements concerning the handling of batte-
are participating (as of 2012). With appropriately desi- ries containing lithium, the UBA strongly recom-
gned dedicated collection boxes for pedelec batteries mends the separate collection of Li-ion batteries
and information materials on how to deal with old and pedelecs. Given the current legal framework,
batteries (e.g. pole isolation), this battery collection this could, for example, be realized if consumers
scheme accounts for the fact that Li-ion batteries removed spent rechargeable batteries from pedelecs
must be packed and transported as per the European before returning them, turning in old pedelecs to
Agreement concerning the International Carriage of local municipal collection centres and old batteries to
Dangerous Goods by Road (ADR). bike retailers (where similar types of new batteries are
Due to the characteristics of lithium and lithium sold).
19Recycling
Recycling old pedelecs encompasses standard bike In Europe, recycling facilities for Li-ion batteries cur-
components, which are primarily made of aluminium rently exist in Germany and Belgium. Thanks to the
and steel, and, most importantly, the electrical com- recovery of metals – for example iron (housing), cop-
ponents (electric motor and battery). per, nickel and cobalt – in 2011 the efficiency of recy-
cling processes for old lithium batteries reached 65%,
Among other materials, the motor contains copper, thereby exceeding the EU target of 50% on average for
steel and – in the permanent magnets – rare earths, recycling procedures96 (figure for portable batteries,
primarily neodymium. As considerable insecurity the values for pedelecs are analogous). Lithium is
exists surrounding the availability of rare earths, they not yet reclaimed. Since 2009 several joint research
have been deemed critical raw materials.91 According projects have been, and are being, sponsored within
to a prognosis, in the year 2020 the potential amount the framework of electromobility research; they have
of neodymium Germany can expect to recover from resulted in (e.g. LithoRec, LiBRi)97 and are resulting
old pedelecs is 5.6 t, which is more than the projec- in (e.g. LithoRec II, EcoBatRec)98 the development of
ted amount of neodymium that can potentially be reuse and recycling processes for Li-ion batteries from
recovered from old wind turbines in 2020 (2.9 t).92 electric vehicles that attain a high degree of recycling
Technical processes to reuse and recycle permanent efficiency, some include processing stages to reclaim
magnets containing rare earths from waste streams lithium. Analysis of the environmental impacts of
are currently in development; these efforts are prima- two of the newly developed processes via life-cycle
rily motivated by the growth of electromobility.93 assessments99 shows that, overall, the net effect of
recycling Li-ion batteries with respect to global war-
Li-ion batteries consist of a housing (e.g. steel), an ming potential is quite low due to the high cost of the
electronics component (battery management system) recycling processes, and particularly of the process
and battery cells. These components contain (cf. Table stages for recovering lithium. Definite net impacts
4) various metals such as lithium, copper and alumi- from recycling can be attained in the other impact
nium, and in some cases cobalt, nickel and/or manga- categories examined, such as acidification potential
nese. Due to the overall growth in electromobility and and eutrophication. This is largely due to the high
to further emergent areas of application, the demand recovery rates for cobalt, nickel, manganese, lithium
for these metals will grow in future. The resource compounds and components, such as housings, PCBs
availability of cobalt – which the EU has likewise ca- and cables.
tegorized as a critical raw material94 – and of lithium,
was forecasted in view of growing demand.95 While
experts estimate that geological lithium reserves will
cover demand for all applications for decades to come,
the cumulative consumption of cobalt could alrea-
dy exceed the 7.3 million tonnes of cobalt reserves
currently known to exist sometime between 2040 and
2050; this is because global demand for cobalt is ex-
pected to increase eight to 20 times by 2050. Because
of these batteries’ long lifespans, recycling can only
make a notable contribution over the long term to
cover demand.
204. Recommendations for action
The UBA recommends that political decision-
makers at various levels (federal, state, municipal)
provide ample financial and human resources for the
development of bike-friendly infrastructure. The often
higher speeds of pedelecs compared to traditional
bikes and the greater demands regarding secure par-
king require targeted investments. Moreover, even a
small investment in cycling can make a great impact.
Promoting cycling contributes to solving many soci-
atal challenges: protecting climate and environment,
health issues, traffic problems, securing mobility in Generally speaking, electric bikes are upmarket and
light of demographic developments, allowing all to are heavier than normal bikes; as such, users require
participate in social life and improving quality of particularly good, secure and ground-level parking
life in cities and in rural areas. The formulation of at their destinations, such as at the workplace, train
strategic aims by the federal government, states and stations and public transport stops, shopping centres,
municipalities also helps overcome these challenges. recreational and educational facilities and at their
Promoting cycling is a cross-sectional task within homes. Their construction is not solely a task for
government administration; the appointment of a cyc- public authorities; businesses, transport services,
ling commissioner is advisable for its coordination. housing associations and companies and edu-
cational institutions have an obligation to provide
Businesses can implement pedelecs in a variety of ample parking facilities.
ways in commercial traffic. This potentially includes
employing cargo cycles for transport tasks and pede- Consumers should consider whether they can employ
lecs for business trips and commuter journeys to work a pedelec for trips that they normally travel in a car,
premises. Many car and compact van trips can instead and whether purchasing a pedelec for such an appli-
be made using pedelecs or bikes. Economically, such cation is worthwhile. Riding a pedelec keeps people
uses pay off. For instance, employees can be inspired fit and saves money. Pedelec batteries are subject to
to use bikes and pedelecs in the context of workplace special disposal rules. Batteries that consumers can
mobility or health management programmes. In lieu remove of their own accord can be returned at bicycle
of a company car, employers have the opportunity retail shops (wherever similar types of new batteries
to provide their employees with a company pedelec are sold). From there, the batteries are collected and
that can also be used privately. safely reprocessed. Old pedelecs can be recycled.
Just as televisions and toasters, they are collected at
Planners should respect the current technical municipal collection points (recycling centres) and
standards when planning cycling facilities. Pedelec then recycled. In general, due to the potential risks of
users are especially dependent on compliance with and special requirements for handling lithium-based
planning arrangements for transport infrastructure batteries, the UBA would like to point out that Li-ion
(in particular, ERA 2010100, the German Guidelines batteries and pedelecs should be collected separately.
for Traffic Signals (RiLSA 2010)101 and the Suggestions
For Cycling Traffic Signage (HBR)102) for their safety Taking simple measures during pedelec use can as
in road traffic. Frequently, however, these standards much as double the lifespan of a battery. A tempera-
have not yet been implemented, and existing and new ture range of 10-25 °C is ideal. When charging, avoid
cycling infrastructures should be brought into line continued charging of a fully charged battery as well
with the currently valid recommendations within a as deep discharge. When a battery is going to be in
reasonable time frame. storage for an extended period of time, it should be
kept at room temperature and be charged to 30-40%.
The battery should be recharged after a maximum of
six months.103
21You can also read