Employment Land Review Focused Update
←
→
Page content transcription
If your browser does not render page correctly, please read the page content below
Employment Land Review
Focused Update

London Borough of Bexley

May 2021
© 2021 Nathaniel Lichfield & Partners Ltd, trading as Lichfields. All Rights Reserved. Registered in
England, no. 2778116. The Minster Building, 21 Mincing Lane, London, EC3R 7AG
Formatted for double sided printing.
Plans based upon Ordnance Survey mapping with the permission of Her Majesty’s Stationery Office.
© Crown Copyright reserved. Licence number AL50684A
14559/02/CGJ/NP/LBa
19163471v1
Employment Land Review Focused Update

               Contents
1.0            Introduction                                1
               Scope of the Study                          1

               Structure of the Report                     2

2.0            Commercial Property Market Signals          3
               UK Property Market Overview                 3
               Regional Market Overview                    4

               Local Property Market                       4

               Development Rates                           9

               Employment Stock Change                    14

               Economic Drivers                           14

               Summary                                    17

3.0            Future Requirements for Employment Space   18
               Approach                                   18

               a)   Forecast Job Growth                   18

               b)   Past Development Rates                21

               c)   Future Labour Supply                  23

               Planning Requirement                       25

               Land Requirements                          27

               Summary                                    28

4.0            Demand/Supply Balance                      30
               Emerging Supply                            30

               Quantitative Balance                       30

               Summary                                    32

5.0            Conclusions and Policy Considerations      33
               Market Signals Update                      33

               Meeting Future Needs                       33

               Further Policy Considerations              34
Employment Land Review Focused Update
1.0 Introduction
1.1 London Borough of Bexley (“the Council”) commissioned Nathaniel Lichfield & Partners
(“Lichfields”) to prepare a focused update to the 2017 Employment Land Review and
Restructuring Scenario Exercise (“2017 Study”) to inform the evidence base for the Council’s
emerging Local Plan which will cover the period between 2021 and 2036.
1.2 The 2017 Study, also prepared by Lichfields, formed part of the evidence base to support the
Bexley Growth Strategy which was adopted in late 2017, and in particular provided an
assessment of potential economic growth in the Borough at that time.
Scope of the Study
1.3 The purpose of this focused update is to provide updated evidence on the future growth
potential of the Borough’s economy to support the new Local Plan, focusing specifically upon
the latest job growth projections as an indicator of future demand, and commercial property
market signals. The update, therefore, reviews the emerging policy approach to the local
economy in light of changes to national planning policy, the latest available employment
projections and changes to recent market signals that have occurred since the 2017 Study.
1.4 Since the 2017 Study was prepared, the National Planning Policy Framework (NPPF) has been
updated (in February 2019) together with Planning Practice Guidance (PPG) for housing and
economic development needs assessment. In addition, the London Plan adopted in March 2021.
1.5 In this context, the scope of this update study consists of the following:
1 Market signals update: updating chapter 4.0 of the 2017 Study with an analysis of
current property market conditions in the Borough, including recent trends in the demand
for and supply of office and industrial premises. This provides updated commentary on
economic drivers and future growth sectors, general employment trends, quality of existing
stock, and recent completions rates.
2 Updated future requirements for employment space: preparing a series of updated
economic growth scenarios for the Council and associated employment land requirements,
effectively updating chapter 6.0 of the 2017 Study. This includes consideration of the
updated baseline job growth scenario drawing on latest GLA job forecasts (the July 2017
release), an updated past take-up scenario based on latest monitoring data on employment
class completions in the Borough, and an updated labour supply scenario that tests the
population growth and workplace labour supply implications associated with the proposed
Draft Local Plan’s housing delivery target.
3 Review demand/supply balance: the updated scenarios have been compared with the
Council’s latest employment land supply position to consider the balance between demand
and supply over the Plan period and potential policy implications that flow from this.
1.6 All other aspects of the 2017 Study remain unchanged.
1.7 The scope of this Employment Land Review (ELR) focused update includes consideration of
economic development as defined by the NPPF, with a primary focus upon the typologies set out
in the business Use Classes as outlined below:
• B1 Business: offices (B1a), research & development (B1b) and light industrial (B1c)
(subsumed within Use Class E from 1 September 2020).
• B2 General Industrial: typically comprising factory and manufacturing space.
• B8 Storage and Distribution: warehouses, wholesale and distribution.
Pg 1Employment Land Review Focused Update
1.8 References to ‘employment space’ refer to all B class (and former B class) elements noted above.
1.9 An important consideration for any work of this type is that it is inevitably a point-in-time
assessment. This study has incorporated the latest data and other evidence available at the time
of preparation in November and December 2020. The accuracy of data derived from third party
sources has not been checked or verified by Lichfields.
1.10 Due to the timing of the study and its analysis, no specific consideration has been given to the
impact of emerging planning reform, although the study does take account of the more
immediate changes to the Use Classes Order effective from 1 September 2020.
Covid-19
1.11 The outbreak of Covid-19 in December 2019 and resulting pandemic has developed rapidly with
far reaching impacts on the economy and business across the country. Lockdown measures have
led to unprecedented shut downs of large parts of the economy simultaneously, with effects
being transmitted rapidly across all sectors.
1.12 This study has been undertaken during a period of significant economic uncertainty associated
with the Covid-19 pandemic, although due to the timing of the analysis and evidence upon
which the study draws, it provides only initial consideration of the short, medium, and longer-
term implications associated with Covid-19 for economic growth within the Borough of Bexley.
1.13 While restrictions remain in place to varying degrees across the country, and may do so for some
time, it is difficult to anticipate the full extent of the economic shock at the time of writing. It is
arguably still too early to understand how the pandemic and resulting structural changes may
affect how businesses operate and the resultant demand for employment land. Notwithstanding
the ongoing uncertainty, it is likely that the Covid-19 pandemic will induce and accelerate some
key structural economic changes that will influence patterns of local economic growth and
development. It is recommended that the Council continues to monitor local Covid-19 related
impacts and review local economic growth prospects.
Structure of the Report
1.14 The remainder of this report is structured as follows:
• Commercial Property Market Signals (Section 2.0) – describes current property
market conditions, and recent trends in the demand for and supply of employment use class
premises;
• Future Requirements for Employment Space (Section 3.0) – estimates future
employment space requirements for employment use class sectors in quantitative terms,
drawing on employment forecasts, past trends and labour supply scenarios;
• Demand/Supply Balance (Section 4.0) – assesses the relative balance between current
land supply and future needs, in quantitative terms, by comparing forecast requirements
with emerging supply; and
• Conclusions and Policy Considerations (Section 5.0) – considers the policy
implications of the updated future employment space requirements and demand/supply
balance.
Pg 2Employment Land Review Focused Update
2.0 Commercial Property Market Signals
2.1 This section describes current property market conditions in Bexley and its relationship with
surrounding areas, including recent trends in the demand for and supply of office and industrial
premises. These findings are based on market research, a review of commercial databases and
discussions with a number of commercial property agents active in the area (see Appendix 1).
2.2 In addition, this section provides an update of the stock position, together with updated
commentary on future growth sectors and economic drivers within the Borough.
UK Property Market Overview
2.3 After the global financial crisis in 2008, the UK experienced almost a decade of economic
growth. The national commercial real estate market had been flourishing across that period with
significant capital investment across all property sectors and values in many markets having
reached all-time highs by March 2020.
2.4 Since preparation of the 2017 Study (which was largely completed in 2016), there have been
developments worldwide and nationally that impact upon the property market, including the
Brexit referendum in June 2016 and its transition period to 2021. The national elections in
December 2019 also created political and economic uncertainty across the national and South
East markets. However, the property market proved to be resilient and there had been an
increase in activity following 2019 general election.
2.5 The outbreak of Covid-19 and resulting pandemic has had a significant impact upon the global
economic outlook. Ongoing uncertainty regarding the timing and pace of economic recovery
makes it difficult to accurately forecast impacts, although economic forecasts suggest that it may
take a number of years to return to pre Covid-19 levels of economic activity and growth.
2.6 As a result, property market activity has declined over the last few months reflecting developer
and occupier caution, although impacts have been uneven across the different segments of the
market. Office sectors have been significantly affected due to lockdown restrictions and the
ongoing health crisis, while logistics has continued to see strong demand due to a boom in e-
commerce. It is still too early to understand what the future might look like in terms of how
businesses might operate and the resultant demand for employment space and commercial
property. If the measure of “normality” is how things were prior to the outbreak of Covid-19, we
may never see a full return.
2.7 In the short-term, due to ongoing social distancing, fewer people will be able to work from
formal offices. In the medium to longer term, people might look to the success of home working
as a justification to move to new working arrangements. This may reduce the demand for office
space in some locations (such as city and urban centres), whilst also providing opportunities for
smaller, more accessible locations.
2.8 Rental growth projections remain entrenched in negative territory for both prime and secondary
office space, with the RICS Survey (Q3 2020) forecasting over 50% net loss for the next year. At
the other end of the spectrum, prime industrial rents are expected to rise strongly over the year
to come with an anticipated net increase of over 50%. The industrial outlook is positive
currently, albeit rents have increased modestly for secondary industrial premises nationwide.
2.9 On the investment side of the market, overall enquires continue to decrease and overseas
investment demand declined in each segment of the market over the third quarter of 2020.
2.10 In overall terms, we have seen industrial and distribution sectors driving the market following
the first lockdown in early 2020 and the sector is expected to continue to thrive in the coming
Pg 3Employment Land Review Focused Update
years. By contrast, the office market has suffered and there is uncertainty around the rebound of
this segment. At the time of writing, it is arguably too early to understand how the changes we
have seen in working arrangements as a result of Covid-19 will impact on commercial space
requirements over the medium to longer term.
Regional Market Overview
2.11 Bexley is located within the London, M25 and South East market, and it is therefore useful to
consider broader sub-regional market trends and characteristics which may influence demand
for and take-up of employment space in the Borough.
Industrial Market
2.12 There has been continued activity in the logistics and industrial occupational market in London
and the South East over the first quarter of 2020, albeit at a more moderate pace compared to
the previous year. A total of 1.2m sq ft of space has been taken-up across ten transactions of over
50,000 sq ft2. This falls considerably behind Q1 2019 where c.2.9m sq ft was taken-up across 20
transactions.
2.13 The full extent of the damage caused by the Covid-19 crisis to the market’s demand and supply
fundamentals is not yet clear, however a temporary reduction in enquiries during Q2 2020 was
followed by a surge in Q3 2020. Overall, industrial is the strongest performing property segment
regionally (as well as nationally) and the sector’s activity is expected to continue at pace.
Office Market
2.14 Transactions across the M25 and South East Office market have slowed from the onset of the
first lockdown as the scale of the unprecedented market disruption quickly unfolded. Take-up in
the market in Q2 2020 was at least 19% below a typical quarterly average 3. There are a few
examples of deals having been completely withdrawn during the pandemic, largely within the
sub 10,000 sq ft category. Demand is now reported to be at a record low of 4.0m sq ft; 1.7m sq ft
lower than that recorded immediately after the 2008 financial crisis.
2.15 Overall, the office market has been the second most affected segment after retail. Changing
working patterns will affect the sector’s performance and characteristics going forward,
although it is too early to draw any robust conclusions. The only certain outcome for now is the
increasing requirement for flexibility around leasing arrangements, with enquires demanding
shorter and more flexible terms and notice periods.
Local Property Market
Industrial and Distribution
2.16 Bexley forms part of the South East London industrial market which also extends to the north
western part of Kent. The Borough has traditionally served as a secondary location to nearby
Dartford for industrial uses due to its relative distance from the M25, although more recently
there has been growing cross over between Bexley’s industrial estates and Crossways in terms of
occupier requirements, and rental growth in Belvedere is now reported to be similar to Dartford.
Demand and Supply
2.17 Before the pandemic and resulting economic crisis, the South East London and Kent market saw
very strong and stable activity with take-up in 2019 reaching historic highs. The absence of
2
Knight Frank (2020) London and South East Industrial Market Research Q1 2020
3 Knight Frank (2020) The M25 and South East Office Market Report, Issue 1
Pg 4Employment Land Review Focused Update
ready to occupy buildings above 100,000 sq ft (referred to as ‘Big Boxes’ – i.e. large warehouses)
in the market meant that activity was slower in Q2 and Q3 2019, with the two largest
transactions being the sale of the 86,660 sq ft Unit 1 Belvedere Wharf for owner occupation (see
also paragraph 2.23) and the 80,300 sq ft speculative building at Capacity Dartford taken by
CEVA Logistics recorded by Glenny.
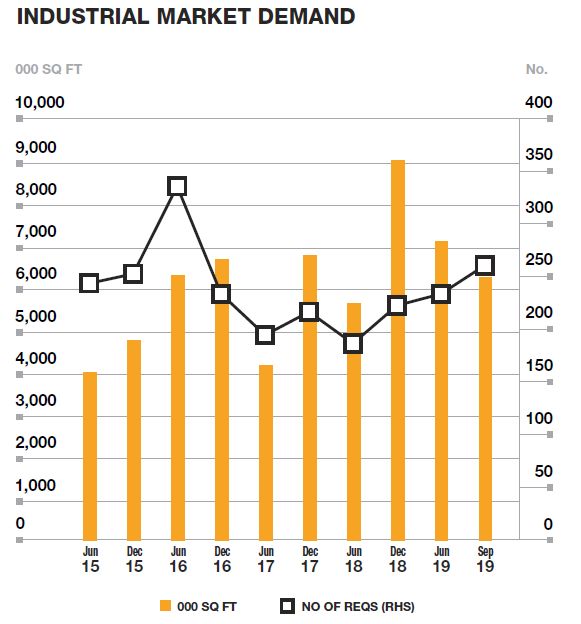
2.18 Supply increased to 3.3m sq ft in the six months to the end of Q3 2019, due to a number of new
schemes completing across the wider market. The availability rate was recorded at 3.6% in Q3
2019 according to Glenny. The demand at the same time was above 6m sq ft. The charts below
summarise these trends across the market.
Figure 2.1 Industrial Market Statistics – Availability and Demand in South East London and Kent
Source: Glenny Databook Q3 2019
2.19 Despite the pandemic and associated downturn, the first three quarters of 2020 recorded
relatively healthy levels of activity across the market. Large commercial deals retained good
take-up levels, including the consent for a 2.3m sq ft distribution facility at Littlebrook,
Dartford4 by Bericote Properties and Tritax on which Amazon agreed a pre-let during Q2 2020.
This scheme will be completed and occupied by summer 2021. Another large transaction related
to the sale of 450,3o0 sq ft at Equinox, Crossways Business Park in Dartford by Pentagon Fresh.
2.20 The intense competition for ready-to-occupy large distribution sites across the market and the
wider South East has driven strong rental growth across the area. Average rental values in the
Belvedere and Dartford sub-market area are currently recorded at £13 per sq ft for prime
premises and at £11 for secondary stock, according to local agents Glenny. The rest of the
market is characterised by slightly lower rents with an average of £9 to £10 per sq ft.
Emerging Supply
2.21 There are currently reported to be stock shortages across all size bands, although these are
expected to ease somewhat following completion of a number of developments by the end of
2020 and during 2021, with further schemes being advertised for either speculative or build-to-
suit opportunities. For example, five new units across 73,000 sq ft will be delivered at Dartford
Industrial Estate, while Goodman is bringing forward the Crossways Commercial Park in
4 Caxtons Chartered Surveyors (2020) Kent Property Market
Pg 5Employment Land Review Focused Update
Dartford on a speculative basis with three units of 101,000 sq ft, 130,000 sq ft and 237,000sq ft,
respectively.
2.22 In addition, two of the South East’s largest new industrial facilities are planned in the area.
Namely the Powerhouse Dartford will provide 450,000 sq ft, while 1.9m sq ft will be delivered at
Panattoni’s Aylesford Newsprint complementing their Belvedere Wharf site in Bexley.
2.23 Furthermore, a built-to-suit opportunity for Belvedere Wharf Unit 2A and 2B in Crabtree
Manorway North is also advertised with an option to provide either two buildings of around
55,000 sq ft each or a combined warehouse unit of over 110,000 sq ft. Belvedere Wharf Unit 1 of
110,000 sq ft was sold in 2019 for owner occupation. Although the building is still unoccupied it
has been withdrawn from the market and it is expected that the new owner will occupy it soon.
2.24 Finally, Sidcup Logistic Park (which is located within the administrative area of London
Borough of Bromley, but shares the same industrial market with Foots Cray) will provide a total
of 12 small to medium warehouses from 4,000 sq ft to 20,000 sq ft. The scheme is expected to
be completed in late 2021 and the majority of the units are available for freehold.
2.25 Land sales transacted over the last 12 months will provide further opportunities for large
distribution occupiers across the area including the sale of a 2.7 ha site at Crittalls Corner
Junction in Sidcup to Coca Cola for £5.4m per ha in Autumn 2019, which is expected to be
materialised in the next few years. In addition, Littlebrook has seen further land acquisitions
with Wrenbridge purchasing Plots 32 (1.1 ha) and 34 (1.4 ha), while Goya/Aberdeen Standard
acquired the 1.8 ha site at 181 Hawley Road in Dartford.
2.26 At the time of writing, the Former DB House in Foots Cray (at Rectory Lane, DA14 5HP) is
advertised for sale for potential redevelopment. It is understood that as a result of recent
planning applications, the Draft Local Plan proposes to change the land use designation of this
site from SIL to LSIS, to allow for co-location of uses.
2.27 The multi-let investment market has been active despite the challenging backdrop and during
the lockdown period; not only did transactions continue, but also quoting prices were more
competitive (than expected) in some instances across the market according to Caxtons.
2.28 Overall, logistics and distribution property investment has been strong in the last year with the
advancement of significant schemes across the area reflecting the area’s ongoing attractiveness
as a business location. Although various schemes are expected to become available within the
next few years and boost supply across the market, occupier demand is expected to continue to
remain high.
Bexley’s Employment Areas and Current Availability
2.29 The Borough’s industrial market, which tends to be clustered around River Thames in locations
such as Belvedere, Erith and Crayford Ness, together with Thames Road and Crayford at the east
of the Borough and Foots Cray, Sidcup at the south of the Borough, has been driven mainly by
distribution and warehousing activity in recent years, together with construction and waste
businesses. This reflects the overall market activity across the wider South East London and
Kent market.
2.30 Belvedere and Foots Cray perform well and attract the majority of new occupier interest across
the Borough. The overall stock condition in these areas is good with the majority of the premises
being modern. This is reflected in the rental and land values of the sites with Belvedere and
Foots Cray commanding the highest values across the Borough of over £13 per sq ft. It is also
reflected within the recent commercial development activity which is mainly focused on these
two employment locations. In response to these activity levels, the Draft Local Plan has
Pg 6Employment Land Review Focused Update
designated additional industrial land at Foots Cray, namely the B&Q and DFS site to the south
of Watery Lane.
2.31 Belvedere has been successful in attracting food related companies, either in manufacturing,
process packaging and more recently in food distribution facilities with Asda, Ocado, Tesco and
Lidl all having distribution centres within the area. Although this employment area benefits
from relatively modern stock and high occupancy rates, it is viewed as relatively congested and
requires improvements to supporting infrastructure (particularly the road network and public
transport accessibility) to continue to thrive and remain attractive.
2.32 In addition, Thames Road in Crayford accommodates a cluster of wholesale, distribution,
materials recycling facilities and utilities based companies. The area is reported to be
performing well with limited vacancy rates and overall the stock is in a good condition.
2.33 Manor Road in Erith and Crayford Ness employment areas have a more traditional industrial
character, accommodating mainstream industrial uses, manufacturing activity and sui generis
waste facilities. The areas suffer from a comparatively poorer perception as low value locations
with poor access, reflecting the fragmented land across smaller premises/sites in these areas
and the relatively poor and old stock condition. However, Manor Road’s stock has been
improving recently with more modern premises being built in the employment area.
2.34 Larger industrial and distribution operators tend to locate in Belvedere and Thames Road along
the A206 corridor and Foots Cray adjacent to Sidcup By-Pass Junction. Logistics, distribution-
based and construction sectors drive the industrial market currently with Bexley perceived as
well-located to serve London and its ever-growing population.
2.35 In terms of immediate availability, a total of 25 properties related to various sites from small
units of 1,000 sq ft to medium warehouses of 40,000 sq ft are currently advertised as available
for rent or sale in Bexley’s employment locations 5. Availability of more modern stock (Grade A)
tends to relate to small industrial premises of up to 12,000 sq ft, including:
• Belvedere Point is a recent development (built in 2019) of 19 small industrial / warehouse
units with a range of 1,200 sq ft to 3,000 sq ft on a self-contained site. Some of the units are
still available to let.
• Belvedere Gateway with access from Anderson Way has been completed recently and Unit 1
of 18,700 sq ft is available for sale or let. Unit 2 was pre-sold to Dean Transport.
• Unit 27 Horizon Business Centre in Belvedere (Alder Close DA18 4AJ) with a total of
2,870sq ft across two storeys (i.e. mezzanine) is currently available to let. This is a modern
industrial/workshop building.
2.36 The rest of the immediately available units relate to secondary premises. These include:
• Four units in Belvedere with a total area of 1,400 sq ft, 20,000 sq ft, 35,000 sq ft and
40,000 sq ft, respectively.
• Six units in Erith and Manor Road of mainly small to medium scale (i.e. 1,000sq ft to
6,000sq ft). Albeit there is one unit that can provide a combined area of up to 94,000sq ft,
namely Erith Distribution Centre in Turpin Ln, DA8 2AT.
• Four units in Thames Road of 1,000 sq ft to 7,000 sq ft.
• Three units in Crayford Industrial area of 4,000sq ft to 24,000sq ft and one unit in Bourne
Industrial Area in Crayford of 2,200 sq ft.
• One unit in Edington Way, Foots Cray of 9,700 sq ft.
5
These include developed, under construction and design-build opportunities in vacant land advertised in commercial databases
in November-December 2020.
Pg 7Employment Land Review Focused Update
2.37 This analysis shows that immediate industrial availability relates mainly to small sized premises,
while demand is driven mainly by medium to large scale distribution facilities. The market
reports requirements across the entire size spectrum, however immediately available large-scale
units of over 100,000sq ft are reported to be in particular demand currently. Although various
schemes of a large scale are expected to be delivered over the coming years, which should help to
ease the current demand, market intelligence suggests that occupier appetite is sufficient to
justify speculative distribution schemes in the area.
Office
2.38 In contrast to industrial, the office market is reported to be relatively weak in Bexley and the
wider market area. There are limited levels of demand driven mainly by indigenous needs of
local small to medium enterprises (SMEs). Bexley does not have the necessary critical mass to
attract and sustain large office occupiers within the South East/M25 office market, with
locations like Bromley, Dartford and Kings Hill tending to accommodate this segment of the
office occupier market. As a result, the Borough’s office market is relatively localised and
demand generally comes from local SMEs operating across a range of business service sectors
for good quality, small modern premises.
2.39 Sidcup and Foots Cray accommodate the majority of office activity across the Borough,
reflecting the areas’ good transport links and good quality town centre environment with a range
of services and facilities. Other locations such as Welling and Bexleyheath town centre also
contain some office stock but are generally regarded as secondary locations.
2.40 Sidcup and Foots Cray accommodate clusters of office buildings however vacancies are currently
reported in some of its key office premises including the ground floor of Planwell House (c. 800
sq ft), the ground floor of 142-148 Main Road office building (c.500 sq ft), the ground floor of
Nexus Building of 1,800 sq ft and the office building in 3 Hurts Road with a combined available
space of 5,900 sq ft. Finally, the first floor of Marsfield House (c. 3,000 sq ft) is also currently
available and advertised for rent.
2.41 Thames Innovation Centre in Veridion Park, Belvedere is a modern office building, which is
home to the Engine House, the Council’s flexible workspace/office hub (see paragraph 2.45). A
total of nine spaces from 200 sq ft to 800 sq ft are currently advertised to let within this office
building.
2.42 In addition, the first floor (c. 4,600 sq ft) of the recently refurbished London House space at
Texcel Business Park, Thames Road (DA1 4TQ) is also advertised as available.
2.43 Asking office rents average at £15 to £17 per sq ft currently across the Borough, underlining the
relatively secondary nature of the local market in comparison with larger, more established
office locations such as Bromley and Sevenoaks where office rents average £30 per sq ft.
Dartford’s equivalent is reported to be over £20 per sq ft currently.
2.44 There has not been any recent office development in Bexley with the majority of stock therefore
comprising older, second-hand space for which demand is low. Local commercial agents noted
that there is currently insufficient demand to justify speculative development in the Borough
and this is unlikely to change over the short to medium term, particularly under the current
economic circumstances and with continued uncertainty around the rebound of the office
sector.
Pg 8Employment Land Review Focused Update
Small Firms and Start-up Space
2.45 The Borough has a reasonable amount of space specifically designed for small and start-up
businesses. The Thames Innovation Centre, known as Engine House, provides 50,000 sq ft of
high-quality modern office, meeting and conference space for hire and is located within
Veridion Park in Belvedere. It is entirely owned by London Borough of Bexley and was part-
financed by European funding (ERDF) and provides flexible space for small to medium
enterprises to grow. Its current occupancy rate is estimated at around 85% with nine spaces
currently reported to be available (paragraph 1.1).
2.46 In addition, St Mary's Business Centre on Bourne Road in Bexley, located within a converted
school building, provides individual offices of varying sizes for new start-ups and those that have
outgrown more informal workspace. Moreover, Texcel Business Park on Thames Road in
Crayford comprises mid-range offices from 2,000sq ft to 6,000sq ft with flexible lease terms.
2.47 Local commercial property agents suggest that local SMEs appear to be currently well-served by
existing provision, and that the level of latent demand at the present time is insufficient to
justify any new enterprise centre/serviced office style accommodation. As such, it is unlikely at
least for the short to medium term (next 5 to 10 years) to see any increasing requirement for
such workspace.
2.48 In addition, mid-sized industrial workspaces have become recently available in the Borough at
Belvedere Point and this could accommodate workspace needs for start-ups and small
businesses. Our analysis suggests that there is currently a good spatial distribution of small to
medium workspaces and flexible offices across the Borough as a whole to serve this specific
segment of the market.
Development Rates
Gross Completions
2.49 The gross amount of floorspace developed for employment uses in Bexley during the period
2010 to 2019 is shown in Figure 2.2, based on an analysis of London Development Database
(LDD) data for Bexley. This shows that around 190,400 sqm of gross employment class space
(within B2, B8 and the former B1 Use Classes) was developed within the Borough over the last
10-year period, equivalent to an average of 19,040 sqm per annum.
2.50 The vast majority of this new employment floorspace within the Borough was developed for
industrial and distribution uses which represent 93.5% of the total gross completions. It should
be noted that in reality, and based on market intelligence summarised above, distribution
floorspace has been the key driver of recent completions, but the majority of the schemes within
their planning description included both B1c/B2 and B8, therefore, LDD records an even split
across these use classes for the purposes of monitoring development.
2.51 Figure 2.2 shows that the level of new development within the Borough was relatively uneven
during this period, with the reporting years of 2013, 2016 and 2018 standing out as recording
the most significant levels of employment development, together with 2011 when the
construction and operation of a resource recovery electricity plant was completed at Norman
Road, Belvedere.
2.52 The relatively high level of gross completions in 2013 was driven by the completion of just one
large scheme, namely the 59,650 sqm Pirelli (Former Bicc Cables) industrial and distribution
park in Erith.
Pg 9Employment Land Review Focused Update
Figure 2.2 Gross Development Rates in Bexley, 2010 - 2019
Source: LDD / Lichfields Analysis
2.53 A total of five schemes were completed in 2016 totalling 40,300 sqm of new employment
floorspace. Half of that provision related to the 24,500 sqm industrial and distribution
development at land adjacent to Former Pirelli Works (i.e. one scheme).
2.54 Finally, a total of three schemes were completed in 2018, including the 9,900 sqm Coca Cola
and Schweppes Beverages warehouse, the 12,500 sqm new industrial and distribution
development at land between Crabtree Manorway North And Bronze Age Way known as
Criterion Park and the 18,400 sqm scheme at land between Bronze Age Way And Picardy
Manorway known as Axion Belvedere. The latter is currently under offer according to CBRE.
2.55 The relatively high rate of industrial and distribution completions is mainly driven by the
completion of a small number of large developments. In contrast, office completions have been
significantly lower and mainly relate to small schemes of 300 up to 1,000 sqm. Any larger office
provision (c. 1,000 sqm) recorded across the period was part of mixed-use schemes such as
Lakeside Complex 2 and Norman Park that also both provided other uses mainly for non-
employment sectors.
Losses of Employment Space
2.56 A total of 121,100 sqm of employment space has been lost (or replaced) in Bexley since 2010. As
shown in Figure 2.3 below, 2013 and 2014 stand out as recording substantial losses of 46,670
sqm and 29,000 sqm respectively.
2.57 In 2013, the Pirelli (Former Bicc Cables) scheme was completed and that involved the
demolition of existing industrial property of 49,670 sqm and the erection of the new distribution
and industrial park that, as noted above, provided a total of 59,650 sqm of modern employment
space. Therefore, losses in 2013 relate mainly to the replacement and recycling of employment
land. Although not recorded by the LDD6, it should be noted that during the same year the 7,300
sqm Forest Laboratories (Weir Road - 11/00406/FUL) in the Old Bexley Employment Area was
redeveloped to housing and together with a permission for conversion to housing at the same
employment area (i.e. Riverside Works) resulted in the reduction of that employment site from
1.64ha to 0.48ha.
6 LDD Includes all planning permissions proposing at least 1,000 sqm of non-residential floorspace in at least one use class.
Pg 10Employment Land Review Focused Update
Figure 2.3 Losses of Employment Space in Bexley, 2010 - 2019
Source: LDD / Lichfields Analysis
2.58 In 2014, the industrial losses related to two schemes, namely a redevelopment to residential
with ancillary community uses and associated facilities (i.e. loss of 16,800 sqm) and a change of
use to distribution related to 1,300 sqm (i.e. replacement of employment floorspace). In the
same year a loss of 10,900 sqm of office was recorded, although this related to the conversion of
Local Authority offices to Sui Generis Use Class, involving no actual loss of office floorspace.
Net Completions
2.59 Combining this analysis of gross completions with losses, across the monitoring period the net
development rate in Bexley as recorded by LDD was lower than the gross rate, reflecting
ongoing losses of employment space to other uses. Between 2010 and 2019, the Borough
recorded total net development of 69,350 sqm or an average of 6,935 sqm per annum (Figure
2.4). This means that the pace of new development exceeded ongoing losses of employment
space in the Borough over this time.
2.60 As presented overleaf, net completions in Bexley over the last ten years have been driven by
distribution and industrial space, with 4,125 sqm and 2,960 sqm per annum on average,
respectively. By contrast, office space recorded an annual average loss of 150 sqm, reflecting
comparatively weaker levels of activity across the sector.
2.61 Net completions also reflect the replacement of older industrial sites to modern warehouses and
industrial facilities, as there have been significant industrial losses in 2013 and 2014, which
partially related to redevelopment of distribution and utilities space as reported above.
Therefore, overall, the net employment gain is considered moderate against the gross provision
of over 190,000 sqm.
Pg 11Employment Land Review Focused Update
Figure 2.4 Net Development Rates in Bexley, 2010 - 2019
Source: LDD / Lichfields Analysis
Permitted Development Rights
2.62 Since the introduction of Permitted Development Rights (PDRs) for change of use from office
(former B1a) to residential (C3) in 2013, a total of 23 office premises relating to a total of
5,900 sqm of office space has been lost within the Borough (see also paragraphs 3.31 to 3.34). A
further 18 schemes have been permitted and if implemented in full, would result in a total of
13,600 sqm of office space being lost from the Borough’s portfolio. It should be noted that six of
the extant approvals relate to 81% (11,080 sqm) of the anticipated, future loss of office
floorspace.
2.63 The impact of these already implemented PDRs is equivalent to a 5% reduction in the Borough’s
office stock (as at 2013, when the PDR was first introduced). This could increase to 13% if extant
prior approvals were to be implemented in full (based on stock levels at March 2020).
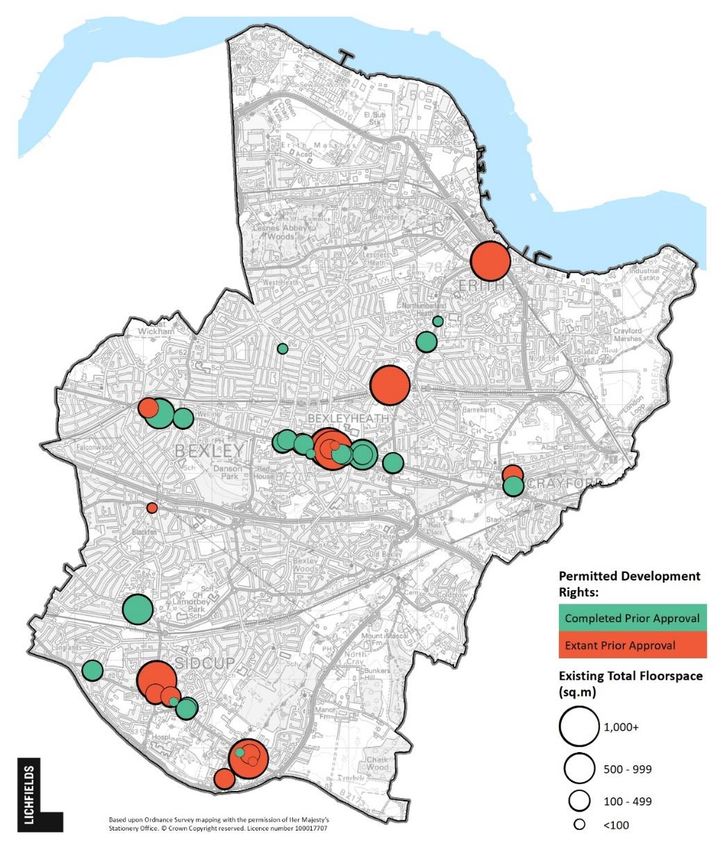
2.64 Figure 2.5 below illustrates the distribution of the completed and extant prior approvals.
Unsurprisingly, these tend to be concentrated within the Borough’s key office clusters, namely
Sidcup, Foots Cray and Bexleyheath.
2.65 Overall, prior approvals have generally involved loss of poor quality, redundant space, however,
more recent developments including Heather Court 7 have also been permitted to be converted to
residential. Bexley’s stock of office space was already relatively modest, and the PDRs have had a
limited quantitative impact on the existing stock to date.
7 With planning reference 19/00392/PRIOR
Pg 12Employment Land Review Focused Update
Figure 2.5 Office to Residential PDR: Completed and Extant Prior Approvals in Bexley (March 2020)
Source: LDD / Lichfields Analysis
Pg 13Employment Land Review Focused Update
Employment Stock Change
2.66 A comparative analysis of the Borough’s stock of employment space has been undertaken using
latest data from the Valuation Office Agency (VOA) and covering the same monitoring period
between 2010 and 2019.
2.67 This shows that as at 2020, the Borough’s stock of employment space totals 1.1 sqm, with 91%
being industrial (and distribution) and 9% relating to office (Figure 2.6).
Figure 2.6 Employment Stock Change in Bexley, 2010 - 2019
Source: VOA 2020 / Lichfields Analysis
2.68 This suggests that since 2010, a total of 31,000 sqm of office space has been lost in the Borough,
equivalent to a reduction of around 20%. Industrial (including distribution) floorspace has
increased by 8,000 sqm over this time, equivalent to a marginal increase of 1%.
2.69 Whilst the two data sources (VOA and LDD) imply different scale of absolute change in Bexley’s
employment floorspace over the last 10 years, the overall pattern of increasing
industrial/distribution space and declining office space is consistent across both sources. This
underlines the more qualitative market commentary presented above regarding the relative
strength of the Borough’s industrial sectors and a comparatively more subdued office market.
Economic Drivers
2.70 In employment terms, the largest sectors in Bexley in 2019 were retail (12%), business
administration and support (12%), health (10%), education (9%) and transport and storage
(8%), according to the latest Business Register and Employment Survey (BRES) 2019 data.
When compared with the sector breakdown in London, the Borough is significantly over-
represented in employment terms in wholesale, transport and storage, construction, motor
trades, manufacturing, retail and education, while being significantly under-represented in
higher-value sectors such as professional services and finance and insurance (Figure 2.6), which
reflects the Borough’s geography and context as an East outer London location.
Pg 14Employment Land Review Focused Update
Figure 2.6 Location Quotient Analysis in 2015 and 2019: Bexley Vs London8
Source: BRES 2019 / Lichfields Analysis
2.71 Since 2015, transport and storage (+2,000 jobs), construction (+1,000 jobs) and business
administration and support (+1,000 jobs) have seen the highest growth across the broad
sectors. These sectors are also over-represented across the Borough compared to London and
could be considered as key recent economic drivers.
2.72 A more detailed analysis (at 4-digit SIC code) of the current employment structure shows that
the following 18 sub-sectors (Figure 2.7) dominate the current employment structure,
representing over 40% of total employment in Bexley. All these sectors are over-represented
compared to London’s employment structure.
8Location Quotient (LQ) is a method of quantifying how concentrated/represented a particular industry/sector is in an area
compared to a wider geography, in this case Greater London. A figure above 1 means that this industry is over-represented
compared to London, while a figure below 1 means that this industry is under-represented compared to London.
Pg 15Employment Land Review Focused Update
Figure 2.7 Main Employment Sub-sectors in Bexley, 2019 (no of employment jobs)
Source: BRES 2019 / Lichfields Analysis
2.73 These include sub-sectors within manufacturing, construction, transport and storage together
with retail, education and health broad sectors. Since 2015, wholesale, transport and storage,
retail, public administration and business administration all increased their representation in
Bexley compared to London’s equivalent increase.
2.74 The GLA’s latest sectoral employment projections (2017 release) to 2036 anticipate a growth
across London mainly within office and service-based sectors, including professional services
(24%), information and communication (20%), education (19%), arts (18%), accommodation
(15%), administrative and support (13%) and health (12%). In addition, construction is expected
to increase by 11% and retail by 2% across London over the period to 2036. By contrast, public
administration employment is expected to contract by 6%, transport and storage by 7% and
wholesale by 12%, respectively by 2036. These projections precede the Covid-19 outbreak and
the short to medium term impacts that this has had upon London’s economy.
2.75 In this context, we do not anticipate a significant change in patterns of sectoral growth across
the Borough compared with recently recorded trends. Overall, the wholesale and transport and
storage sectors are likely to continue to grow, together with construction, education and health.
Although business administration and retail could be expected to increase further in
Pg 16Employment Land Review Focused Update
quantitative terms based on the GLA’s forecasts, recent economic circumstances associated with
Covid-19 could moderate growth rates for these industries at least in short to medium term as
we adapt to a ‘new normal’. Finally, it should be noted that we have liaised with the Council’s
Economic Development and Town Centres team to sense-check the findings of this analysis.
Summary
2.76 Bexley operates within the South East London and Kent broad commercial property market
area. The Borough serves as a secondary location to nearby Dartford for industrial uses,
however the rental gap between the two locations has been narrowing with Belvedere reporting
similar rental growth to Dartford, and the two now effectively operate within the same market.
2.77 Bexley is perceived as a good industrial location and both demand for, and take-up of, industrial
and distribution space is strong across the area. Logistics and distribution are the key drivers of
occupier demand and this is reflected within the recent pattern of development in the Borough.
Bexley’s stock of industrial space has been increasing over the last 10 years, boosted by a small
number of large developments many of which have involved the recycling of older industrial
sites and premises.
2.78 These sectors continue to grow, and there is reported to be unsatisfied demand across the entire
size spectrum, with demand for immediately available large warehouses (over 100,000 sq ft)
particularly strong. Over the next few years, some larger schemes will be completed in the wider
market that will help to ease this current pressure, with demand and values sufficient to justify
additional speculative development if sufficient capacity and land can be made available.
2.79 By contrast, the Borough’s office market is very localised and is driven by limited levels of
indigenous demand from SMEs and start-ups. It’s stock of office space has gradually declined
over the last 10 years, due in part to the introduction of office to residential PDR which have
made it easier to convert older office stock. The Borough has a reasonable amount of space
specifically designed for small and start-up businesses and this appears to be sufficient to
accommodate demand over the short to medium term. There may however be scope in the
future for additional small-scale provision of flexible workspace to accommodate both start-ups
and expansion of the Borough’s growing SMEs business base, particularly in light of strong
anticipated growth in the Borough’s population.
Pg 17Employment Land Review Focused Update
3.0 Future Requirements for Employment
Space
3.1 This section considers future economic growth needs in the Borough drawing on a number of
scenarios for the local authority area. These scenarios are used to inform an updated analysis of
the potential economic growth drivers within the Borough and the employment land and
planning policy implications that flow from these.
Approach
3.2 The National Planning Policy Framework (February 2019) requires “planning policies to set out
a clear economic vision and strategy which positively and proactively encourages sustainable
economic growth” (Paragraph 81a).
3.3 In this context, and in compliance with Planning Practice Guidance on economic development
needs assessment, a number of potential future economic scenarios which were included in the
2017 Study have been updated in this report to provide a framework for considering future
economic growth needs and employment use class space requirements for Bexley over the Local
Plan period 2021 to 2036. These scenarios draw on:
1 Projections of employment growth in the various employment class sectors (labour
demand) derived from economic forecasts produced by the Greater London Authority
(“GLA”) (July 2017 release);
2 Consideration of past trends in completions of employment space based on
monitoring data supplied by the London Development Database (LDD), and how these
might change in the future; and
3 Estimates of future growth of local labour supply based on the Borough’s housing target
from the London Plan of 685 dwellings per annum (dpa).
3.4 All these approaches have some limitations and careful thought needs to be given as to how
appropriate each is to circumstances in the Borough. In addition, to be robust, the economic
growth potential and likely demand for employment space needs to be assessed under different
future scenarios, to reflect lower or higher economic growth conditions arising in future. There
are also a number of qualitative factors that will influence the future employment space
requirements that need to be planned for, as discussed in this report.
a) Forecast Job Growth
3.5 Forecasts of job growth for Bexley over the period to 2036 have been obtained from GLA
Economics. It is important to note that there are inherent limitations to the use of economic
forecasts of this type, particularly in the context of ongoing changes in the economy. Such
forecasts tend to be most reliable at the national and regional level, and consequently less so at
the local economy level, but they are widely recognised as a valuable input to indicate the broad
scale and direction of future economic growth, and in turn, future land requirements for a local
area.
3.6 It should also be noted that population forecasts, which represent an input to economic
forecasts, are frequently revised as are assumptions around future working-age population,
economic activity levels, and national changes to the pension age.
Pg 18Employment Land Review Focused Update
GLA Assumptions and Methodology
3.7 The labour demand scenario draws upon the latest employment projections for London to 2041
produced by the GLA and published in July 2017. The accompanying London labour market
projections 2017 report explains the methodology and assumptions underpinning these
projections.
3.8 These employment projections are available on a Borough-by-Borough basis, and combine both
employees and self-employed, drawing on trend data from the ONS Business Register and
Employment Survey (BRES) and workplace capacity projections.
3.9 For London’s outer Boroughs, including Bexley, the projections imply that future employment
growth will broadly reflect past job growth trends, and not assumed to be constrained by
employment site capacity. Part of the rationale for this is that there has been a significant
volume of applications to convert employment space to residential use, and so there is flexibility
in the use of premises that have gained prior approval for change of use in these Boroughs. This
is expected to continue in managing the competing pressures of commercial and residential land
use according to the GLA.
Scenario 1: Labour Demand
3.10 The GLA employment projections provide figures for total employment growth at Borough level,
although a sector-by-sector breakdown is only available for London as a whole. Therefore, we
have used the latest (2019) BRES data to apportion the Borough’s employment growth to
specific sectors based on the relative share of employment by industry in Bexley in 2019. The
same approach was adopted in the 2017 Study. We have then compared annual growth rates
with those projected for London as a whole, to contextualise the analysis.
3.11 In this context, the GLA projections indicate overall employment growth of 10,000 jobs for the
Borough over the 2021 to 2036 Local Plan period, which is equivalent to 667 jobs per annum on
average, or an annual growth rate of 0.8%. The equivalent for London is slightly lower at 0.7%.
The GLA data indicates that 7,000 (70%) of these jobs relate to employees, with the remaining
3,000 (30%) relating to self-employed workers. The equivalents for London are 72% and 28%,
respectively.
3.12 Table 3.1 highlights which sectors under this scenario are expected to see the greatest change in
absolute employment across the Plan period, with a full breakdown of the baseline job growth
by sector (i.e. 38 sectors, including non-employment class sectors) presented in Appendix 2.
Table 3.1 Sector Employment Change in Bexley, 2021-2036 (total employment)
Sector Use Class Additional Jobs (2021-2036)
Administrative & Supportive Services 1,189
Retail 1,100
Education 984
Land Transport, Storage & Post 806
Wholesale 769
Residential Care & Social Work 611
Specialised Construction Activities 575
Source: GLA Economics 2017, BRES 2019 / Lichfields analysis
GREEN = Employment use class sector ORANGE = Partial employment use class sector RED = Non-employment use class sector
3.13 To put the above analysis into context, the GLA’s employment projections by sector for London
as a whole imply that professional services, real estate, scientific and technical activities (24%),
followed by information and communications (20%), education (19%) and arts, entertainment
and recreation (18%) will see the highest growth across the Plan period. By contrast,
Pg 19Employment Land Review Focused Update
manufacturing (-24%), wholesale (-12%) and transportation and storage (-7%) are expected to
decrease, while retail (2%) is expected to increase moderately.
3.14 This suggests that Bexley could see a different pattern of employment growth to London-wide
trends in future, reflecting its outer London Borough location and particular strengths within
industrial and distribution based sectors.
3.15 As noted above, because the GLA employment projections do not provide a breakdown of job
growth for Bexley by individual sector, it has been assumed for the purposes of analysis that
each sector of the economy retains its 2019-based share of total employment over the period to
2036.
3.16 Table 3.2 shows expected jobs growth for each of the employment use classes across the Plan
period to 2036. Over the 15-year period, an overall growth of 10,000 jobs is forecast in Bexley,
of which 4,030 (40.3%) relate to employment use class sectors.
Table 3.2 Forecast Employment Change in Bexley, 2021 - 2036
Use Class 2021 2036 Change
Office E(g)(i)/(ii) 12,717 14,231 1,514
Light Industrial E(g)(iii) 6,554 7,335 780
Industrial B2 5,649 6,321 672
Distribution B8 8,928 9,991 1,063
Total Employment Class Sectors 33,849 37,878 4,030
Total Employment (All Jobs) 84,000 94,000 10,000
Source: GLA Economics 2017, BRES 2019 / Lichfields analysis
3.17 As shown above, jobs in employment class uses are expected to grow by 4,030 in the period to
2036 or by an average of 269 jobs per annum (0.8%). Employment in office-based sectors is
expected to record the largest increase, followed by distribution, light industrial and industrial
jobs.
3.18 These job forecasts are then converted to future employment space requirements by applying
the following GEA job density assumptions:
• Offices: 1 job per 11.9 sqm10;
• Industry (Light Industrial and Industrial): 1 job per 43 sqm11;
• Warehousing and Distribution: 1 job per 66 sqm for small scale warehousing12 (i.e. up
to 3,000 sqm in size) which according to VOA 2017 data accounts for 85% of the Borough’s
stock; 1 job per 80 sqm for medium scale warehousing (i.e. 3,000 sqm to 9,000 sqm)
accounting for 10% of the Borough’s warehousing space; and 1 job per 105 sqm for large
scale warehousing (i.e. 9,000 sqm or above) accounting for 5% of the Borough’s
warehousing stock.
3.19 An allowance of 8% is also added to all positive floorspace requirements to reflect a normal level
of market vacancy in employment space and is consistent with London Plan evidence13.
10 This reflects the density ratio used to inform the base case for demand forecasts in the London Office Policy Review 2017 (2017
LOPR) of 11.3 GIA sqm per office worker, which is then translated to 11.9 GEA sqm per worker by adding 5%
11 This reflects a blended average across the industrial use densities presented on p86 of the London Industrial Land Demand
report and is also consistent with the London Employment Site Database 2017 (LESD Technical Report)
12 This density is broadly consistent with evidence from the LESD Technical Report of 70 GEA sqm per FTE or 63 GIA sqm per
employee across B8 uses
13 London Industrial Land Demand, Vacant Industrial Land, p11
Pg 20Employment Land Review Focused Update
3.20 From this analysis, the net employment floorspace requirements for Bexley up to 2036 based on
the baseline job growth scenario are set out in Table 3.3.
Table 3.3 Net Employment Floorspace Requirement based on Labour Demand Scenario, 2021 - 2036
Use Class Net Floorspace Requirement (sqm)
Office E(g)(i)/(ii) 19,460
Light Industrial E(g)(iii) 36,240
Industrial B2 31,230
Distribution B8 79,610
Total Net Employment Floorspace Requirement 166,530
Source: Lichfields analysis (figures rounded)
Sensitivity Test: Applying London’s Sectoral Growth Projections
3.21 As noted above, the GLA employment projections only provide figures for total employment
growth at Borough level, while sector-by-sector employment projections are only available for
London as a whole.
3.22 In order to consider how Bexley’s employment base could change over the Local Plan period if
London-wide sector growth projections were replicated in the Borough, we have applied
London’s annual growth rates per sector between 2021 and 2036 to Bexley’s sector profile as at
2021 (i.e. the start of the Plan period).
3.23 This would result in an employment increase of 4,229 jobs across all sectors of the economy by
2036. This is equivalent to 5,771 fewer jobs than Scenario 1, and reflects the projected decline of
some of Bexley’s largest employment sectors including wholesale and transportation and
storage. It would also imply a decrease of over 210 employment use class jobs in the Borough
over the new Local Plan period to 2036, driven by declining industrial (B2) job losses.
3.24 If we apply the same job density assumptions as Scenario 1, this approach would result in a
negative net employment space requirement of -59,420 sqm across the Plan period. This
includes a positive requirement for 24,570 sqm of office space, but negative requirements for
industrial (incl. light industrial) floorspace (-21,205 sqm) and distribution floorspace (-62,788
sqm) across the Plan period.
3.25 This analysis suggests that the labour demand approach that assumes existing sector shares
remain constant over the Plan period is likely to better reflect ongoing economic need and
market requirements in Bexley over the period to 2036.
b) Past Development Rates
3.26 Because they reflect market demand and actual development patterns on the ground, in some
cases long term completion rates of employment floorspace can provide a reasonable basis for
informing future land needs. Completions over such a period as ten years or more should even
out demand fluctuations over a business cycle and normally provide a reasonable basis for
estimating future need provided land supply has not been unduly constrained. Whereas job
projections show growth in net terms, past trend-based assessments take into account the
ongoing redevelopment and recycling of employment sites.
Scenario 2: Past Completion Rates
3.27 Monitoring data on past completions by employment class uses covering the 10-year period
2010 to 2019 was provided by the GLA, drawn from the London Development Database (LDD).
During this period, average annual net completions for employment class uses in Bexley
Pg 21You can also read