Energy Storage Impacts of Electrochemical Utility-Scale Battery Energy Storage Systems on the Bulk Power System February 2021
←
→
Page content transcription
If your browser does not render page correctly, please read the page content below
Energy Storage
Impacts of Electrochemical Utility-Scale Battery
Energy Storage Systems on the Bulk Power
System

February 2021

                                 RELIABILITY | RESILIENCE | SECURITY

                  NERC | Report Title | Report Date
                                  I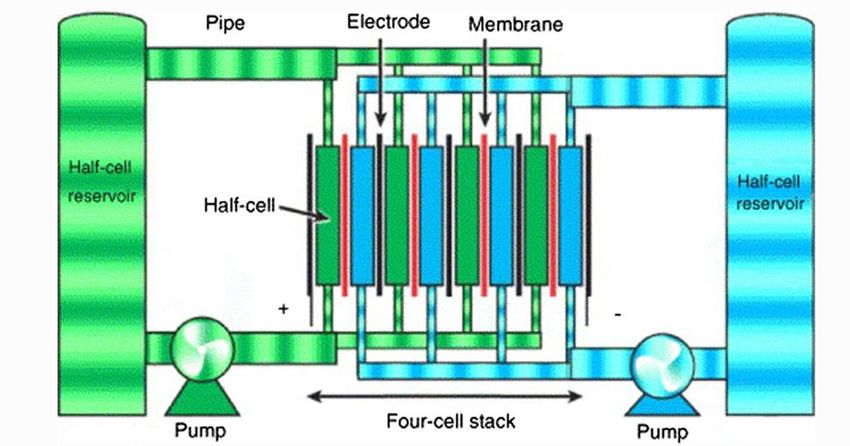
Table of Contents
Preface ........................................................................................................................................................................... iv
Executive Summary ......................................................................................................................................................... v
Introduction .................................................................................................................................................................. vii
   What is a Battery? ..................................................................................................................................................... vii
       Key Characteristics ................................................................................................................................................... x
Chapter 1: Applications of Battery Energy Storage for the Grid ..................................................................................... 1
       Operating Reserves and Frequency Regulation....................................................................................................... 1
       Voltage support ....................................................................................................................................................... 2
       Inverter-Based Resources (IBR) Energy Capacity Firming ....................................................................................... 2
       Peaking Capacity ...................................................................................................................................................... 2
       Energy Arbitrage ...................................................................................................................................................... 2
       Transmission and Distribution Upgrade Deferrals .................................................................................................. 2
       Blackstart Capability ................................................................................................................................................ 2
       Status of Rated Power (MW) and Energy (MWh) .................................................................................................... 3
Chapter 2: Lithium-Ion and Flow Batteries ..................................................................................................................... 5
   Cost Trends .................................................................................................................................................................. 5
       Electricity Storage Technologies .............................................................................................................................. 6
   Lithium-Ion .................................................................................................................................................................. 7
   Flow Batteries .............................................................................................................................................................. 8
Chapter 3: Battery Energy Storage for the North American Footprint ......................................................................... 10
   United States Energy Information Administration .................................................................................................... 10
Chapter 4: NERC–WECC Study on BESS Fast Frequency Response............................................................................... 12
   Projections of BESS in the Western Interconnection Grid ........................................................................................ 12
   NERC and WECC Study Scope .................................................................................................................................... 13
       Classic Frequency Excursion Recovery .................................................................................................................. 13
       WI Grid Base Case and Study Case Model ............................................................................................................. 14
       BESS Capacity Findings........................................................................................................................................... 15
       BESS Location Sensitive Findings ........................................................................................................................... 16
       BESS Sensitivity Findings ........................................................................................................................................ 20
   Conclusion ................................................................................................................................................................. 22
Chapter 5: Battery Storage—NERC and FERC ............................................................................................................... 23
   NERC Standards Applicability .................................................................................................................................... 23
   NERC Standards Review ............................................................................................................................................ 23

                                        NERC | Energy Storage: Overview of Electrochemical Storage | February 2021
                                                                            ii
Table of Contents

   FERC Orders Relevant to BESS and Hybrids............................................................................................................... 24
   FERC Order No. 841 ................................................................................................................................................... 24
   FERC Order No. 842 ................................................................................................................................................... 26
   FERC Order No. 845 ................................................................................................................................................... 27
Chapter 6: Reference Studies........................................................................................................................................ 28
   Summary of Existing Assessments ............................................................................................................................ 28
      Technical Papers .................................................................................................................................................... 28
Chapter 7: Conclusion ................................................................................................................................................... 32
Appendix A: Contributions ............................................................................................................................................ 33

                                      NERC | Energy Storage: Overview of Electrochemical Storage | February 2021
                                                                          iii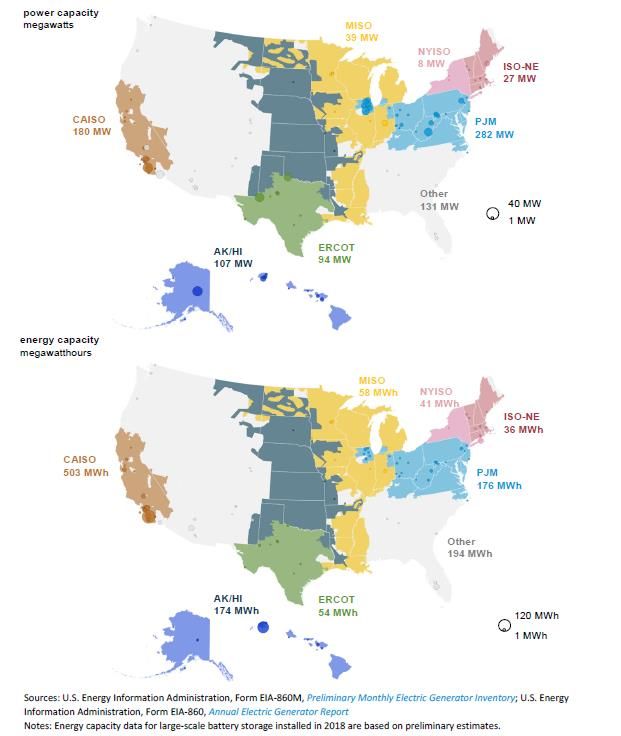
Preface
Electricity is a key component of the fabric of modern society and the Electric Reliability Organization (ERO) Enterprise
serves to strengthen that fabric. The vision for the ERO Enterprise, which is comprised of the North American Electric
Reliability Corporation (NERC) and the six Regional Entities (REs), is a highly reliable and secure North American bulk
power system (BPS). Our mission is to assure the effective and efficient reduction of risks to the reliability and security
of the grid.
Reliability | Resilience | Security
Because nearly 400 million citizens in North America are counting on us
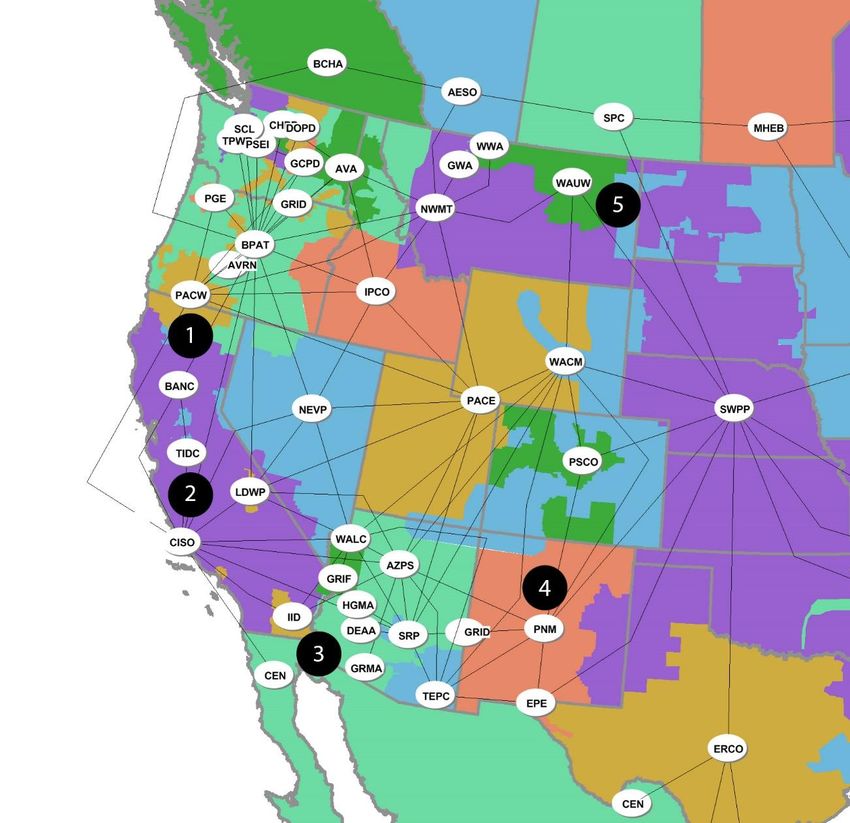
The North American BPS is made up of six RE boundaries as shown in the map and corresponding table below. The
multicolored area denotes overlap as some load-serving entities participate in one RE while associated Transmission
Owners/Operators participate in another.
MRO Midwest Reliability Organization
NPCC Northeast Power Coordinating Council
RF ReliabilityFirst
SERC SERC Reliability Corporation
Texas RE Texas Reliability Entity
WECC WECC
NERC | Energy Storage: Overview of Electrochemical Storage | February 2021
iv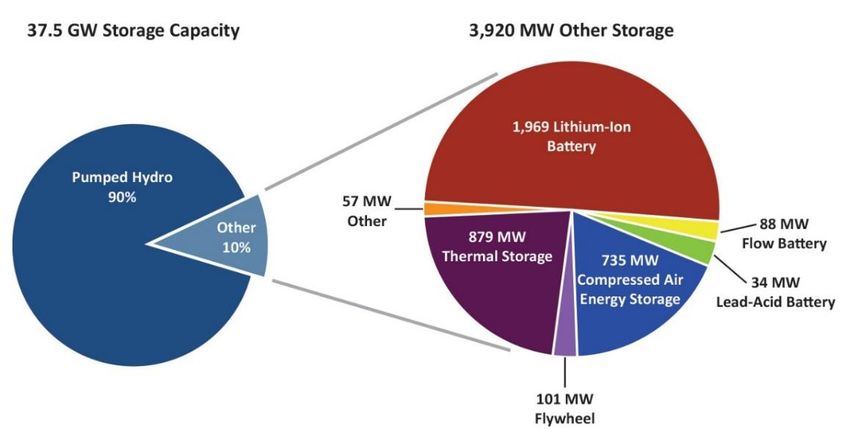
Executive Summary
The electricity sector is undergoing significant and rapid changes that present new challenges and opportunities for
reliability, security, and resilience. NERC has recently conducted analyses that underscore challenges presented with
the acceleration of coal-fired generation retirements and the increased reliance on natural gas. Additionally, NERC
continues to note a rapid shift to inverter-based resources (IBRs) that are variable energy resources due to their fuel
source (e.g. wind, solar) and have different operating characteristics from traditional synchronous generation. This
variability creates potential challenges related to availability that may require additional resources to maintain BPS
reliability. NERC has pointed to these topics in past assessments. Furthermore, NERC continues to emphasize the
importance of ensuring that these IBRs provide essential reliability services (ERS) to the grid, such as frequency
response, ramping, and voltage support. Along with this increase in IBR, primarily from the addition of a large
contribution of renewable resources (e.g., wind, solar), there has been an increase in the application of battery energy
storage systems (BESS) on the BPS. BESS have the ability to complement IBRs by providing some of the ERS that are
important to maintain BPS reliability. Additionally, BESS provide elements of grid support, including providing flexible
ramping support, fast frequency response (FFR), addressing the uncertainty of resource availability, and shifting
energy to address new peaking conditions.
NERC recently conducted a joint study with WECC that underscored some of the potential benefits BESS can provide
for FFR to avert using under frequency load shedding (UFLS) in response to generation losses. Additionally, this
assessment confirms projections that BESS will grow significantly across the North American footprint over the next
twenty years.
Key Findings: Based on data and information collected for this assessment, NERC identified the following:
BESS are projected to grow at an increasing pace across the North American footprint as shown in Figure 2.1.
Lithium-ion batteries account for more than 50% of the installed power and energy capacity of large-scale
electrochemical batteries. Flow batteries are an emerging storage technology; however, it still constitutes
only 2% of the market.
Advances in technology, decreasing costs, and changes to FERC and other market rules will promote BESS
growth.
As IBRs (primarily from wind and solar resources) continue to grow, BESS can enhance grid reliability by
offsetting resource variability and providing ERS, such as voltage support and frequency response. NERC’s
inverter-based working group (IBRWG) continues to develop appropriate guidelines addressing potential
impacts of IBRs.1
A joint NERC/WECC study determined that BESS strategically located provide effective and FFR to avert UFLS.
Existing NERC standards adequately reflect battery storage as a generator, ensuring that the NERC TPL and
MOD standards are applicable to the current number of BESS on the BPS.
Data on battery storage tends to be non-uniform and lacking in consistency across reporting entities
necessitating a need for better reporting mechanisms for BESS data.
Because battery storage is an emerging technology, the development of utility-scale battery storage has
lagged the integration of renewable resources.
Recommendations: Based on the identified Key Findings previously mentioned, NERC has formulated the following
recommendations:
1 IBRWG homepage
NERC | Energy Storage: Overview of Electrochemical Storage | February 2021
v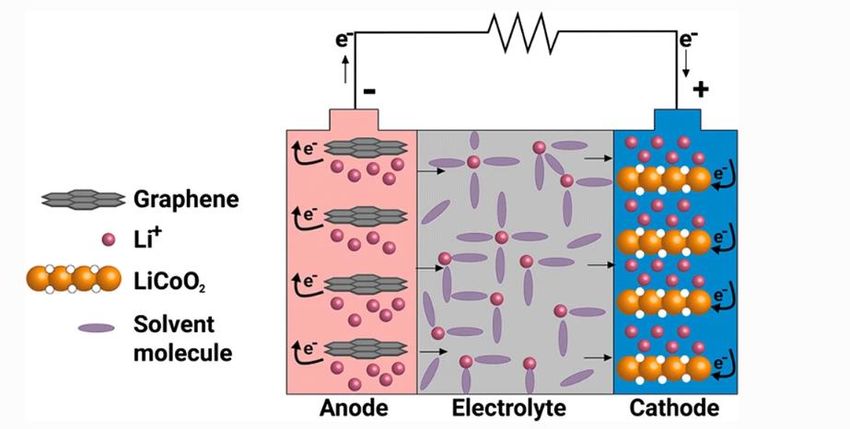
Executive Summary
System planners should prepare for a significant increase in the critical mass of BESS across the North
American footprint. Planners must ensure that deployed battery storage provides the necessary ERSs to
maintain BPS reliability, security, and resilience.
As regulators provide more incentives for the viability of battery storage to provide capacity and energy,
system planners must adequately plan the system for a projected large increase in BESS, understanding the
impact of size, location, and operating characteristics on maintaining the reliable operation of the grid.
The value of battery storage as a complement to variable energy resources, such as wind and solar, should
be fully understood by system planners and operators. System planners must conduct adequate studies to
determine the dynamic stability impacts of BESS’ Interconnection, the capability to provide capacity to meet
long-term and contingency reserve margin requirements, and the ability to provide ERS.
NERC should conduct a detailed analysis of existing NERC Reliability Standards and guidelines to ensure that
they adequately provide for a large increase in the critical mass of BESS, conduct a gap analysis to ensure that
existing standards are not deficient, and/or identify the need for new standards to reflect the potential large
increase in BESS.
Entities that compile battery data information must enhance both their data collection methods as well as
their reporting methods. As energy storage systems become more prolific, accurate and timely data will be
essential for both system planners and operators. The Institute of Electrical and Electronics Engineers (IEEE)
should update the IEEE Standards to reflect any implications of battery storage systems. The GADS Working
Group should ensure that battery storage is accurately reflected in their data capturing protocols.
The NERC Reliability and Security Technical Committee (RSTC) should form a task force to study the forward-
looking implications of BESS and their overall effects on BPS reliability and resilience.
NERC | Energy Storage: Overview of Electrochemical Storage | February 2021
vi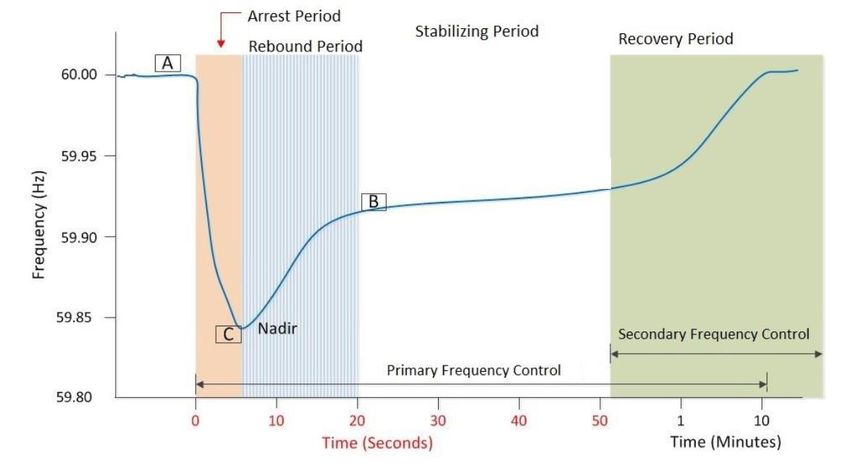
Introduction

NERC, in its mission to maintain the reliability of the BPS, continues to assess the implications on the reliability,
security, and resilience from integration of cutting-edge technologies to the electrical grid. Due to the changing
nature of the grid and the increasing amount of projected BESS in the future, the industry and regulators must pay
more attention to BPS-connected BESS units.

What is a Battery?
The collective contribution of scientists and innovators created our understanding of the forces of electricity, but
Alessandro Volta developed the first electrical battery in 1799.2 This battery, known as the Voltaic Cell, consisted of
two plates of different metals immersed in a chemical solution. He discovered that electricity can be generated
chemically and made to flow evenly through a conductor in a closed circuit.

The basic power unit inside a battery is a cell, and it consists of three main parts. There are two electrodes (electrical
terminals) and a chemical called an electrolyte in between them. The negative electrical terminal is the anode, and
the positive electrical terminal is the cathode. Electrolytes allow ions to move between the electrodes and terminals
allowing current to flow out of the battery to perform work. For our convenience and safety, these cells are usually
packed inside a metal or plastic outer case. The difference between a battery and a cell is simply that a battery
consists of two or more cells hooked up so their power adds together (Figure I.1).

                                                 Figure I.1: Schematic of a Battery

Advances in technology and materials have greatly increased the reliability, output, and density of modern battery
systems, and economies of scale have dramatically reduced the associated cost. Continued innovation created new
technologies, like electrochemical capacitors, which can quickly charge or discharge energy for later use and provide
an almost unlimited operational lifespan. Two emerging technologies in electric energy storage are: Lithium-Ion and
Flow Batteries as described in this report; these two electrochemical technologies offer a more robust and adaptable
energy grid, as shown in Figure I.2.

The scope of this report will include stand-alone BESS and BESS connected alongside other generation resources.3
The BESS in scope for this assessment are BPS-connected with a primary emphasis on lithium-Ion and flow batteries.
The fastest growing technology is the lithium-Ion market, which is largely driven by the electric vehicle (EV) market.

In recent years, the use of BPS-connected battery energy storage has quadrupled from 214 MW (2014) to 899 MW
(2019), and NERC anticipates that the capacity could exceed 3,500 MW by 2023 (Figure I.3).

2   https://ethw.org/Milestones:Volta's_Electrical_Battery_Invention,_1799
3   This BESS configuration, referred to as hybrid resources, is typically a BESS with solar or a BESS with wind.

                                   NERC | Energy Storage: Overview of Electrochemical Storage | February 2021
                                                                       vii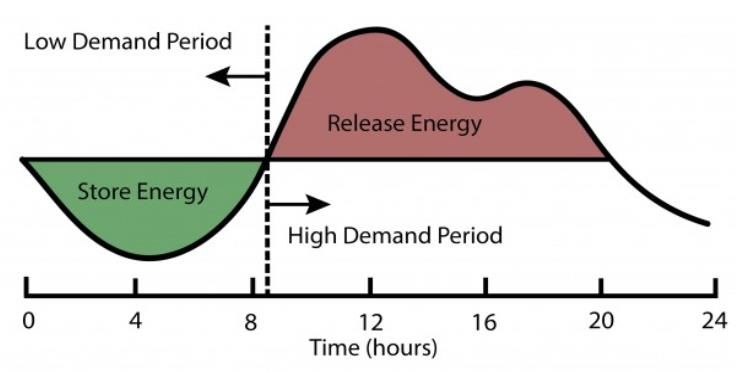
Introduction

    Figure I.2: Energy Installation Costs Central Estimate for Battery Technologies, 2016–2030
           (The diamond represents the decrease in installation cost when comparing 2016 to 2030 data)

Figure I.3: United States BPS-Connected Battery Energy Storage Power Capacity (July 2020)4

One of the major growth areas for BESS is in hybrid systems. An example of a hybrid system is the combination of a
wind or solar plant alongside a BESS facility. Internationally, a wind farm in South Australia retains the biggest-battery
title at 100 MW/129 MWh, which is enough to supply 30,000 homes for eight hours. The largest battery in the United
States and the world is projected to come online in 2021 when Florida Power and Light’s 409 MW/900 MWh Manatee
(center solar plant) Energy Storage Center becomes operational. Furthermore, Southern California Edison has just

4
    July 2020, U. S Energy Information Administration, Form EIA-806M, Preliminary Monthly Electric Generator Inventory

                                NERC | Energy Storage: Overview of Electrochemical Storage | February 2021
                                                                   viii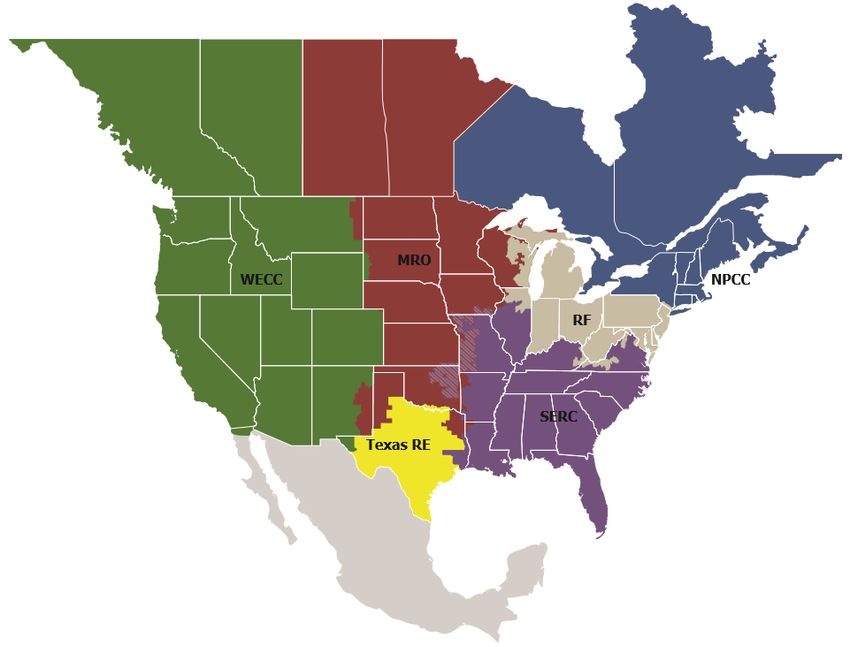
Introduction

finalized what analysts called the nation’s largest-ever purchase of battery storage in late April 2020, and this mega-
battery storage facility is rated at 770 MW/3,080 MWh. The largest battery in Canada is projected to come online in
2021 when Alberta’s TransAlta Renewables WindCharger’s 60 MW utility-scale battery project becomes operational.5

The top four states that have operating or facilities under construction are California, Illinois, West Virginia, and Texas;
these four states make up over half of the total installed battery storage in the United States, as shown in Figure I.4.

              Figure I.4: United States Operating Utility-Scale Battery Storage by State6

Figure I.5 shows an electric power profile with its variations during a 24-hour period. In a load-leveling scenario, the
BESS charges during periods of low power demand and discharges during periods of high power demand. Overall, the
utility would need less capacity to meet this now lowered demand at its peak and could delay the installation of
additional generating capacity. Such energy shifts help to regulate the generation and load balance. Energy storage
would help to enable the delivery of energy for a limited amount of time when variable renewable energy sources,
such as solar photovoltaic (PV) and wind, are not available.

                              Figure I.5: Daily Energy Storage and Load Leveling7

5
  The first 20 MW is operational by December 2020, the final two 20 MW will come online in 2021; https://www.teslarati.com/tesla-canada-
biggest-battery-energy-storage-system/
6
  Graph adapted from the DOE website, “DOE Global Energy Storage Database”, Energy Storage Exchange, www.energystorageexchange.org.
7
  University of Michigan, http://css.umich.edu/factsheets/us-grid-energy-storage-factsheet

                              NERC | Energy Storage: Overview of Electrochemical Storage | February 2021
                                                                  ix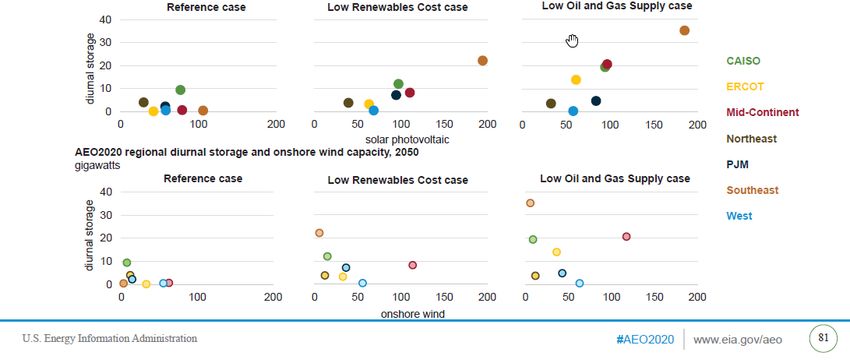
Introduction
There are other applications and locations for BPS-level BESS. The three main demands that this technology is used
for are operating reserves and ancillary services: energy arbitrage, curtailment reduction and load leveling, and
peaking capacity.
While the daily energy storage and load-leveling example show a typical BESS applications case, the following sections
summarize the most common applications for the growth of BESS in the power industry. These applications will
dictate the operational characteristics of BESS.
Key Characteristics and Definitions of BESSs
Storage technologies have a few key characteristics that can be useful for comparison. Some of the key characteristics
used by the industry are summarized below. These characteristics can be further defined and customized for each
energy storage technologies.
Different battery technologies have an inherent state of charge (SOC), voltage currents, and temperature ranges that
when operated within avoids accelerated cell degradation and safety issues.
Definition
A battery energy storage system (BESS) is a term used to describe the entire system, including the battery energy
storage device along with any ancillary motors/pumps, power electronics, control electronics, and packaging. Since
all electrochemical batteries produce dc current, a BESS typically consists of the following components:
The dc battery system (batteries, racks, etc.)
Enclosure(s) with thermal management
Bi-directional dc/ac inverter
EMS/system level software controller
Switchgear/metering/MV step-up transformer, etc.
Rated Power Capacity (citation, Grid-Scale Battery Storage, FAQ)
The total possible instantaneous discharge capability, in kilowatts (kW) or megawatts (MW), of the BESS or the
maximum rate of discharge that the BESS can achieve that starts from a fully charged state.
Rated Energy Capacity
The amount of energy stored in the battery, in kilowatt-hours (kWh) or megawatt-hours (MWh).
Rated energy capacity can be specified in ac terms (kWh) for complete systems, including energy storage medium,
power conversion electronics, and transformers. Alternatively, it can also be specified in dc terms (MWh) when only
the battery or energy storage medium is represented or considered. Additionally, vendors will sometimes show a
“rating” for kWh in dc without or before considering ac conversion. When this is done, it is critical to remember that
the power capacity of the system is normally determined by the capability of the power electronics, not just the
energy storage medium, since the ac rating of a battery system may be significantly smaller than the dc rating of the
battery component itself, due to the inefficiency of energy conversion.
Some manufacturers will specify a “rated power” but then list a “maximum depth-of-discharge” (DOD) that limits the
actual energy available. For some technologies, the energy available may be proportional to the discharge rate and
temperature (higher discharge rates typically allow less energy to be removed from the battery).
NERC | Energy Storage: Overview of Electrochemical Storage | February 2021
xIntroduction
Storage Duration
Storage duration is the amount of time the energy storage can discharge at the system power capacity before
depleting its energy capacity. For example, a rated battery with 1 MW of power capacity and 4 MWh of usable system
energy capacity will have a reserve duration of four hours at a specified discharge rate.
Cycle Life
This characteristic is specific to the battery/energy storage medium. Cycle life is the number of times the battery can
be discharged and recharged during its useful life over a specific SOC range. Cycle life is often specified as number of
cycles to a specific depth of discharge (DOD) since many batteries will have a longer life if discharges are kept shallow.
This assumes that cycle life is directionally proportional to DOD and is equivalent to something like 5,000 cycles to
50% DOD or 2,500 cycles to 100% DOD. This may not be the case for some battery types and chemistries. There is an
increasing trend to provide warranties based on “energy throughput.” This is derived by the summation of the total
amount of energy a battery is expected to deliver over its lifetime (e.g., the number of kWh, stored energy delivered
by the battery). This term is universal and can be apply to all types of batteries no matter what their degradation
mechanism or rate is over time.
Self-discharge
Self-discharge occurs when the stored charge (or energy) of the battery is reduced through internal chemical
reactions or without being discharged to perform work for the grid or a customer. Self-discharge, expressed as a
percentage of charge lost over a certain period, reduces the amount of energy available for discharge and is an
important parameter to consider in batteries intended for longer-duration applications.
State of Charge
SOC, expressed as a percentage, represents the battery’s present level of charge and ranges from completely
discharged to fully charged. The SOC influences a battery’s ability to provide energy or ancillary services to the grid
at any given time. Different battery technologies have an inherent SOC range that, when operated within, avoids
accelerated cell degradation. The achievable high and low SOC values are specific to a battery chemistry and type.
Round-trip efficiency
Round-trip efficiency, which is measured as a percentage, is a ratio of the energy charged to the battery to the energy
discharged from the battery. It represents the total efficiency of the battery system to resupply energy taken from
its source, including losses from self-discharge. Although battery manufacturers often refer to the dc-dc efficiency
(i.e., round-trip efficiency from the dc charge controller) and do not include the losses due to required subsystems,
such as HVAC, natural gas detection, and fire protection. In contrast, ac-ac efficiency (i.e. the round-trip efficiency
from the point of interconnection) includes all system losses that are typically more important as it measures the
battery as it is charging and discharging from the point of interconnection to the power system, which uses ac
(Denholm 2019).
System Life
This is the expected calendar life of the BESS used for its designed purpose and intent, also known as installation life.
The system life incorporates the expected service life, degradation mechanism, and rate of all subcomponents for an
application or use case. This includes but is not limited to the following: battery, electronics, power conversion, and
interconnection equipment. Typically, this term is used only for the battery degradation, which may be a factor of
cell corrosion, capacity degradation, life of seals/membranes, or other factors. If designed and installed properly,
battery degradation is truly dependent on how an end user operates their system. Battery applications are typically
broken up into two categories: energy and power. Energy applications can include time shift, supply capacity, and
spinning reserves. Power applications are typically load ramping and/or following voltage support and frequency
response. Because energy response typically has a deeper depth of discharge on a consistent basis, these applications
have a steeper degradation curve for some chemistries.
NERC | Energy Storage: Overview of Electrochemical Storage | February 2021
xiIntroduction
Using the battery outside its designed purpose may affect its capabilities and life. Changing or modifying the use case,
cycle frequency, DOD, charge/discharge parameters, or rate will affect the warranty of the battery and may exceed
the battery or the power electronic capabilities. Entities should contact battery manufacturers and evaluate any
effects of changing the use case from the original design before making changes to installations or subcomponents.
Safety
If used incorrectly, all batteries become a risk and can pose a danger to the equipment and personnel. The higher the
energy density of the battery means the more attention to the design, maintenance, and operation of the BESS is
required.
NERC | Energy Storage: Overview of Electrochemical Storage | February 2021
xiiChapter 1: Applications of Battery Energy Storage for the Grid
BESS are an well suited technology to provide short-term grid contingency support (tens of seconds) and long-term
energy support/reserve (up to four hours) with the BESS capable of short settling times and the operational flexibility
inherent to energy storage. BESS can provide the ERS of frequency regulation, ramping, and voltage support in a
manner that can replicate current levels of ERS from synchronous facilities. In addition, BESS can also provide ancillary
services with several hours of energy capacity reserve ready for the grid. The main BESS applications in power system
generation, transmission, and operation are described in Figure 1.1.8
Batteries can provide services for system operation and for solar PV and wind generators as well as defer investments
in peak generation.
Figure 1.1: Main Battery Applications in the Grid9
The following section identifies the major reported services BESS are providing.
Operating Reserves and Frequency Regulation
The ability to maintain specified reserves and/or adequate reserves beyond the firm system demand describes the
function of operating reserves. Operating reserves consist of attributes like regulation, load following, and
contingency reserves (spinning, non‐spinning, and supplemental).10 BESS can provide the regulation and load
following capability to supply/absorb additional energy for the unexpected grid energy imbalance, or they can
provide ramping capability of the grid during times of major load shifts.11 With provided flexible ramping capability,
8 https://www.irena.org/-/media/Files/IRENA/Agency/Publication/2019/Sep/IRENA_Utility-scale-batteries_2019.pdf
9
IBR in Figure 1.1 are inverter-based resources.
10 https://www.nerc.com/comm/Other/essntlrlbltysrvcstskfrcDL/ERSTF%20Concept%20Paper.pdf
11 These are typically the morning, afternoon, and evening times that are exacerbated by high solar PV penetration.
NERC | Energy Storage: Overview of Electrochemical Storage | February 2021
1Chapter 1: Applications of Battery Energy Storage for the Grid
BESS can help BAs respond to large ramps during the day and reduce any ramping rate requirement of other
resources.
BESS can also provide the grid primary frequency response (PFR). BESS have FFR capability as a full-converter type of
power electronic device that, if enabled, allows the BESS to provide a large power injection before most conventional
generation. These two functions, PFT and FFR, are short-term reliability services. BESS can also provide longer-
duration frequency services with the stored energy that can provide grid the secondary frequency response or
tertiary frequency response.
Voltage support
Generating facilities are required to provide reactive power to the grid as called for in NERC’s Reliability Standards.
BESS can provide the reactive needed to support grid voltage stability on the transmission system. BESS can be a
reactive resource to provide local voltage support acting as a transmission asset that similar to shunt reactive
devices,12 such as capacitor, static VAR Compensator (SVC), capacitors, or other power electronic controlled devices.
This can occur independently from or in parallel with their frequency regulation service.
Inverter-Based Resources (IBR) Energy Capacity Firming
Renewable energy resources, such as wind plants and solar PV, are variable energy resources as their “fuel source”
is inherently variable (wind speed and solar irradiation). BESS can support renewable energy resources by providing
energy during times of intermittent or expected unavailability (i.e., at times when the wind speed drops for wind
generation or at night for solar PV). The addition of BESS can result in a higher capacity factor for the hybrid system.
Peaking Capacity
BESS can discharge energy at the peak loading conditions to meet the peak demand as well as provide peaking
generation capacity replacing the need to use high cost natural gas plants that have historically been dispatched
during peak seasons. Furthermore, BESS can ameliorate congestion issues and serve as a substitute for peak shaving.
Energy Arbitrage
BESS can take the advantage of different energy market prices by charging battery during low price hours and
discharging during peak price hours.
Transmission and Distribution Upgrade Deferrals
When the peak electricity demand exceeds the existing electricity grid’s transmission and distribution capacity, the
grid’s infrastructure should be upgraded to deliver energy to the end-use customer or demand response options
explored. However, these upgrades can be expensive to meet a limitation that may only occur for a few hours of the
year.
BESS can help alleviate the peak demand stresses on the system. BESS can reduce grid congestion and improve overall
transmission and distribution asset use especially with mobile BESS that can be BESS relocated to new areas when
they are no longer needed in the original location.
Blackstart Capability
Following a power system blackout, system blackstart capability serves to provide an initial start‐up power supply for
the other synchronous generators restoration and re‐energize the transmission system without normal grid support.
A BESS can be a potential blackstart resource as the stored energy lasts hours and can provide initial start-up power
for itself and other generation facilities.
12 Shunt reactive devices are a parallel pathway to ground in order to provide a service to the electricity grid, typically on managing reactive
power. These are different from series-connected resources.
NERC | Energy Storage: Overview of Electrochemical Storage | February 2021
2Chapter 1: Applications of Battery Energy Storage for the Grid
Figure I.2 shows the cumulative installed capacity (MW) for BPS-connected storage systems in the United States in
2019 by the service the systems provide. Operating reserves and ancillary services make up a large portion of these
MWs of cumulative installed capacity.
Figure 1.2: United States BPS-Connected Battery Energy Storage Capacity by Service13
Status of Rated Power (MW) and Energy (MWh)
The impact that BESS can have on the future sustainable energy grid is substantial. As of September 2020, the United
States and Canada had over 37 GW of rated power in energy storage with 90% coming from pumped hydro (Figure
1.3). The remaining 10% is from lithium-ion, thermal storage, compressed air, flywheel, lead batteries, and flow
batteries. The most dominant electrochemical storage technology is lithium-ion, which accounts for about half the
installed rated power.
Figure 1.3: Electric Storage Capacity in the United States and Canada, by Type of Storage
Technology14
13 https://www.nrel.gov/docs/fy19osti/74426.pdf
14
Graph adapted from the DOE website, “DOE Global Energy Storage Database,” Energy Storage Exchange, www.energystorageexchange.org.
NERC | Energy Storage: Overview of Electrochemical Storage | February 2021
3Chapter 1: Applications of Battery Energy Storage for the Grid
Another view of battery storage technologies across the regulated ISO/RTO markets is shown in Figure 1.4. Power
capacity (MW) is 282 MW for PJM, 180 MW for CAL-ISO, and 94 MW for ERCOT; the energy capacity (MWh) is 176
MWh for PJM, 503 MWh for CAL-ISO, and 54 MWh for ERCOT.
Sources: U.S. Energy Information Administration, Form EIA-860M, Preliminary Monthly Electric Generator Inventory; U.S. Energy
Information Administration, Form EIA-860, Annual Electric Generator Report Note: Energy capacity data for large-scale battery storage
installed in 2018 are based on preliminary estimates.
Figure 1.4: United States Grid-Connected Energy Storage Projects
NERC | Energy Storage: Overview of Electrochemical Storage | February 2021
4Chapter 2: Lithium-Ion and Flow Batteries
The U.S. Department of Energy projects that, by year 2050, 35% of the United States energy will come from wind
(404 GWs of capacity)15 and 27% will come from solar PV (632 GWs of capacity).16 Similarly, BloombergNEF projected
the whole world energy storage installations (including electric vehicles and not including pumped hydropower) will
multiply exponentially, from 9 GW deployed as of 2018 to 1,200 GW lithium-ion batteries by 2050.17 The United
States has the fastest growth rate of energy storage worldwide and it is anticipated that the United States will lead
the significant growth of BESS. See Figure 2.1 that demonstrates this exponential growth.
Figure 2.1: Exponential Growth Projected for Electrochemical Storage18
Cost Trends
The cost of batteries is projected to continue to fall over the medium- to long-term. However, the rate of decrease is
likely to vary significantly by battery technology. Likewise, the various components of a BESS are likely to decrease at
different rates based on variables like the level of standardization, economies of scale, and industry learning.
BESS costs are typically described in two ways:
Cost per kW (MW): This is the total installed cost of the system divided by the instantaneous output power
rating of the system. The units are either $/kW-ac (preferred) or $/kW-dc.
15 https://www.energy.gov/sites/prod/files/wind_vision_highlights.pdf
16 https://www.energy.gov/sites/prod/files/SunShot%20Vision%20Study.pdf
17 https://www.energy.gov/sites/prod/files/2019/07/f65/Storage%20Cost%20and%20Performance%20Characterization%20Report_Final.pdf
18
https://www.pnmforwardtogether.com/assets/uploads/PNM-IRP-Nov-19-2019.pdf
NERC | Energy Storage: Overview of Electrochemical Storage | February 2021
5Chapter 2: Lithium-Ion and Flow Batteries
Cost per kWh (MWh): This is the cost of the system divided by its projected energy output. The appropriate
unit of measure is $/kWh-ac (preferred) or $/kWh-dc. One must also specify whether this is based on the
useable storage capacity versus the rated storage capacity, if different. In addition, for any given BESS, this
cost metric can be expressed in the following ways:
Installed cost: This includes the equipment cost of the battery, balance of system costs, and any
engineering, procurement, and construction costs.
Levelized cost: This is the “all-in” cost to design, construct, and use of the BESS over the course of its
useful life. Notably, this includes maintenance costs, effects of battery degradation (i.e., decreased
output), etc. When comparing a BESS against an alternative resource, the levelized cost of storage (LCOS)
is the preferred unit of measurement. The levelized cost is a function of both system cost and expected
life. Even though lead acid batteries are relatively inexpensive, their low cycle life makes each
charge/discharge cycle expensive, precluding them from energy market participation under most
circumstances (Figure 2.2).
Improvements from the past five years have pushed the levelized capital cost down significantly.19
Figure 2.2: Estimated Levelized Capital Costs of Battery Storage20
Electricity Storage Technologies
There are many electricity storage technologies at or near commercial viability with many more at various stages of
development. This area is rapidly evolving and a summary of the categories in current technologies are mechanical,
electrochemical, thermal, electrical, and chemical, as shown in Figure 2.3.
19
Lazard (2018), Lazard’s Levelized Cost of Storage Analysis – Version 4.0
20
Energy Storage Association, Storage Technology Primer
NERC | Energy Storage: Overview of Electrochemical Storage | February 2021
6Chapter 2: Lithium-Ion and Flow Batteries
Figure 2.3: Classification of Storage Technologies21
The most commercially viable technologies are lithium-ion and flow batteries due to the cost of storage, efficiency of
storage, and energy price spreads.
Lithium-Ion
The basic premise for electrochemical storage is that it uses electricity to drive a chemical reaction while charging
and then it reverses that reaction to release electricity when discharging. Lithium-ion is the dominant storage
technology because of its moderate cost, high efficiency, and long lifetime. These characteristics make lithium-ion
batteries well suited for the frequency regulation market.
Figure 2.4: Ion flow in lithium-Ion battery22
21
Energy Storage battery types, https://energystorage.pnnl.gov/batterytypes.asp, Energy Storage Association, Storage Technology Primer
22 Argyrou MC, Christodoulides P, Kalogirou SA (2018). Energy storage for electricity generation and related processes: technologies appraisal
and grid scale applications. Renew Sustain Energy Rev 94:804–821
NERC | Energy Storage: Overview of Electrochemical Storage | February 2021
7Chapter 2: Lithium-Ion and Flow Batteries
A summary of some of the advantages and disadvantages of lithium-ion battery technology is shown in Table 2.1.
Table 2.1: Advantages and Disadvantages of Lithium-Ion BESS23
Advantages Disadvantages
They have high specific energy and high load They require protection circuits to prevent thermal
capabilities with power cells. runaway/fire that could destroy the BESS.
They have a long cycle and extended shelf life as well They degrade at high temperatures and when stored at
as being maintenance free. high voltage.
They have high capacity, low internal resistance, and No rapid charge is possible at freezing temperatures
good Coulombic efficiency. (Chapter 2: Lithium-Ion and Flow Batteries
Figure 2.5: Schematic of Flow Batteries
The electrolyte is stored in tanks and pumped through the core to generate electricity; charging is the process in
reverse. The volume of the electrolyte governs its battery capacity.24
Large-scale flow batteries exceeding 100 kWh have been in use in Japan since 1996. There is also a move towards
cost and size reduction. Rather than building a large battery resembling a chemical plant, newer systems come in
container-sizes of typically 250 kWh that can be stacked. Modern flow batteries are also starting to emerge in Europe.
Just like any other technology, there are advantages and disadvantages for flow battery energy storage, summarized
in Table 2.2.25
Table 2.2: Advantages and Disadvantages of Flow BESS
Advantages Disadvantages
External electrolyte storing enables independent
Chemical handling with potential leakage of
power and energy adjustment to specific applications
acidic solutions can pose a complication.
(wide range of E/P ratios is possible).
The need for sensors. Pumping and flow
They have achieved a relatively high conversion
management mechanisms may increase
efficiency.
maintenance costs.
They possess a high cycle life and durability as well as There is a high cost of some active materials or
sustained performance over lifetime and are aided by key system elements, such as membrane or
absence of morphological changes in electrodes. electrolyte storage vessels.
24 Van Der Linden S (2006) Bulk energy storage potential in the United States, current developments, and future prospects. Energy 31(15):3446–
3457
25 International Renewable Energy Agency, based on Li and Liu, 2017; Sensible, 2016; Skyllas-Kazacos et al, 2011; Linden and Reddy, 2002.
NERC | Energy Storage: Overview of Electrochemical Storage | February 2021
9Chapter 3: Battery Energy Storage for the North American
Footprint
United States Energy Information Administration
In the United States, EIA projects that battery storage is expected to continue to grow at an accelerated pace through
2050. Figure 3.1 shows Annual Energy Outlook (AEO)26 projections of battery storage penetration given several
assumptions around the continued growth of renewables coupled with the decline in fossil fuel generation.
Figure 3.1: Growth in Utility-Scale Battery Storage following Growth in Solar
Hybrid plants are increasingly popular as storage is added to planned and existing renewable energy power plants.
The EIA provides a breakdown of the number of facilities that are hybrid BESS plants and an in-depth view of the
applications the batteries are serving at these plants. These hybrid plants shown are either wind or solar generation
co-located with batteries. Figure 3.2 (arrows) shows 19 hybrid renewable-BESS existed in 2016 with that number
climbing to 53 in 2019. The EIA projects that the number of sites will double by 2023. Figure 3.2 also shows the
gigawatts of capacity that is operating as of February 2020 as well as a projection to the end of 2023.
Figure 3.2: Count and Capacity of Renewable Hybrid Facilities in the United States (2011–
2023)
26
https://www.eia.gov/outlooks/aeo/
NERC | Energy Storage: Overview of Electrochemical Storage | February 2021
10Chapter 3: Battery Energy Storage for the North American Footprint
Figure 3.3 breaks down the total number of facilities that operate as wind/solar with a battery along with the number
of facilities performing a specific function. The most popular function currently served as of 2018 is the storage of
excess wind and solar energy to prevent curtailment of these resources when the wind decreases or the sun does
not shine. Arbitrage is seemingly unpopular with only 3 of the 43 facilities serving this function.
Figure 3.3: Applications Served by Utility-Scale Batteries at Renewable Hybrid Facilities
(2018)
Figure 3.4 details the planned renewable plus storage capacity by state for the top ten states. The EIA details that
over 90% of the total operating hybrid capacity (renewable generator plus energy storage) capacity in the country is
located in just nine states. In addition, Texas alone holds 46% of the current total. Although nearly 25% of the total
United States battery capacity is installed as part of a hybrid system, only 1% of total wind capacity and 2% of total
solar capacity is part of a hybrid system. Many of these future projects result from state initiatives to reach renewable
goals set forth for the electricity generation sector. The planned batteries are becoming increasingly larger as the
cost of energy storage becomes cheaper.
Figure 3.4: Operating and Planned Renewable plus Storage Capacity in GW for Top 10 States
NERC | Energy Storage: Overview of Electrochemical Storage | February 2021
11Chapter 4: NERC–WECC Study on BESS Fast Frequency
Response
NERC and the Reliability Issues Steering Committee (RISC) have identified the changing resource mix and the
corresponding necessary changes of BPS planning as two of the critical risks and challenges to BPS reliability.27 NERC
and WECC have developed a joint study to assess the Western Interconnection (WI) grid dynamic frequency stability
impact of the large penetrations of renewable energy resources and the support of fast frequency response (FFR)
from BESS.
Projections of BESS in the Western Interconnection Grid
BESS are experiencing rapid growth in both the BPS and distribution power systems due to declining costs and the
ability to provide reliable grid stability support. BESS provide a variety of differing products, one of which is the
support of BPS frequency during grid events by supplying FFR.
One of the largest growth areas of BESS projects has been in California. In May 2020, PG&E announced five new BESS
projects that are scheduled to come on-line by August 2021 (Table 4.1).28 By 2023, PG&E will have awarded BESS
contracts that total more than 1 GW capacity, which is more than double the capacity.
Table 4.1: PG&E Batteries On-Line
Counterparty /Project Name Storage Technology Term (years) Size (MW)
Dynegy Marketing and Trade,
Lithium Ion Batteries 10 100
LLC/Project
Diablo Energy Storage, LLC/Project Lithium Ion Batteries 15 150
Gateway Energy Storage, LLC/Project Lithium Ion Batteries 15 50
NextEra Energy Resource Development,
Lithium Ion Batteries 15 63
LLC /(Blythe Energy storage Project)
Coso Battery Storage, LLC/Project Lithium Ion Batteries 15 60
Total Capacity 423
As IBRs have grown and BESS continue to grow and evolve, it becomes important to understand how battery storage
can help mitigate or prevent events on the interconnected system. Events that can initiate under frequency load shed
(UFLS) schemes are a threat to reliability. Over the past several years, significant events have occurred across the
globe that have resulted in UFLS: Australia had two grid separations and load loss event in 201829 and 201930and the
National Grid in the United Kingdom had a blackout in 2019.31 These events occurred in areas that have experienced
significant increases in IBRs. In the United Kingdom event, BESS have helped the overall system32 but not enough to
restore frequency to a level that could avoid UFLS. From the 2018 South Australia (SA) event final report, the large-
scale battery storage was valuable in this event as it assisted to mitigate the initial decline in system frequency. In
addition, it provided balancing support for the fluctuating frequency and rapidly changed the output from discharging
27https://www.nerc.com/comm/RISC/Related%20Files%20DL/ERO_Reliability_Risk_Priorities_RISC_Reccommendations_Board_Approved_No
v_2016.pdf
28https://www.pge.com/en/about/newsroom/newsdetails/index.page?title=20200519_pge_poised_to_expand_battery_energy_storage_cap
acity_by_more_than_420_megawatts
29https://www.aemo.com.au/-/media/Files/Electricity/NEM/Market_Notices_and_Events/Power_System_Incident_Reports/2018/Qld---SA-
Separation-25-August-2018-Incident-Report.pdf
30https://www.aemo.com.au/-/media/files/electricity/nem/market_notices_and_events/power_system_incident_reports/2019/final-report-
sa-and-victoria-separation-event-16-november-2019.pdf?la=en&hash=231CA53842A89C65036F1F288D0DCF73
31https://www.ofgem.gov.uk/system/files/docs/2019/09/eso_technical_report_-_final.pdf
32https://www.current-news.co.uk/blogs/batteries-and-black-outs-how-storage-helped-bring-the-uk-system-back-online-and-how-they-
could-do-more
NERC | Energy Storage: Overview of Electrochemical Storage | February 2021
12Chapter 4: NERC–WECC Study on BESS Fast Frequency Response
to charging as needed to limit the over and under frequency conditions in SA following the SA separation from the
rest of Australia. These events lead to the need for additional studies to determine how BESS can be used for FFR to
rapidly support grid frequency when large generator trip events occur along with a large penetration of IBRs.
NERC and WECC Study Scope
With the increasing penetration of IBRs and retirement of synchronous generators that provide inertial and PFR
support to the grid frequency stability, the NERC/WECC joint study investigates how BESS can support and improve
grid frequency stability. The study scope was limited to BPS connected BESS devices and did not include devices
interconnected through the distribution system. The main objectives of the study included the evaluation of the
following:
The WI grid light load case with low grid inertia conditions
BESS FFR capability to support the WI grid frequency stability for a large generator trip contingency
The effects of BESS FFR over a typical primary frequency control time frame33
The grid frequency stability with a large penetration of IBRs that operate at maximum available output
condition and do not provide under frequency support to the grid
Different locations for BESS placement and the impact to grid frequency performance
Dynamic grid frequency performance based on the frequency nadir of monitored buses throughout the model
in addition to a calculated median frequency
The study aimed to accomplish the following objectives:
Determined at what penetration of IBR facilities34 WI frequency performance would initiate UFLS schemes35
Demonstrate the BESS FFR capabilities and improve frequency performance on an Interconnection-wide grid
Find the needed BESS capacity for study case to return to the base case’s frequency performance36
Determine if the BESS FFR support is location sensitive
Provide the a few sensitivities to account for BESS technology specific characteristics and their impact to
Interconnection-wide performance37
Classic Frequency Excursion Recovery
A typical frequency recovery curve after a large generation loss event is shown in Figure 4.1.38 The frequency
performance is described in four periods: arrest, rebound, stabilizing, and recovery. Based on Figure 4.1, the event
starts at time t+0 second and the pre-disturbance frequency Value A is defined as the average frequency prior to time
t+0. Point C is the lowest frequency point from t+0 to t+12 seconds, and it is called the frequency nadir. Point B is
defined as the average of the frequency between t+20 and t+52 seconds. To better track frequency response, these
three points have been identified by the NERC Frequency Working Group as the crucial metrics from any given event.
The study team tracked Point C, the nadir, as well as the rate of change of frequency (RoCoF) to qualify the relative
frequency response benefits the BESS can provide.
33 Generally between 0 and 52 seconds
34 Modeled as nonresponsive to under frequency deviations
35 This is the study case.
36 Base case is the original case without changing out frequency supportive synchronous generation with the nonresponsive under frequency
IBR facilities.
37 For instance, fast switching from discharging to charging or conditions where BESS is nearing low SOC.
38 https://www.nerc.com/comm/OC/Documents/2019%20FRAA%20Report%20Final.pdf
NERC | Energy Storage: Overview of Electrochemical Storage | February 2021
13Chapter 4: NERC–WECC Study on BESS Fast Frequency Response
Figure 4.1: Classic Frequency Excursion Recovery
WI Grid Base Case and Study Case Model
To begin, the study team selected the WI 2021 Light Load Spring Planning Case as a starting point.39 The team captured
the WI grid frequency performance subject to a disturbance of the WI’s largest N-2 events (two Palo Verde units)
based on the NERC recommended resource contingency Criteria.40 Between the two contingencies, neither reached
the first stage of UFLS, hence the study team altered the base case by changing the synchronous generator model
with an IBR model that provided no frequency support. There is 8.2% renewable energy power (Wind + PV) output in
the base case, and the team altered the penetration to lower the frequency nadir. The team removed 80% of all
synchronous generation modeled (based on inertia) in California as well as the top 75 facilities that provided the most
PFR to reduce the nadir close to the first stage of UFLS. Compared to the base case, the study case has a reduction of
40% synchronous generator capacity (in MVA) that is replaced by IBRs (with non-frequency-responsive controls), and
the corresponding inertia dropped by 34.4%. This altered case is referred to as the “Study Case” in the sections
below.41
Grid Frequency Response Reserve and BESS FFR
Comparing to the Base Case, the Study Case has a 9.4 GW (26.3%) reduction of spinning reserve and 7.8 GW (23.5%)
reduction of frequency response reserve. With the added 1,250 MW BESS42 to the study case, frequency performance
was similar to the Base Case. The different cases basic information related to grid frequency stability are summarized
in Table 4.2.
Table 4.2: 2021 Light Load Spring Case Summary and Comparison
Quantity Base Case Study Case Study Case + BESS
Total Capacity on Line 119,886 MW 119,886 MW 121,136 MW
Total Case Inertia 604,665 MVA-sec 396,947 MVA-sec 396,947 MVA-sec
Resource MW dispatched 96,312 MW 96,312 MW 96,312 MW
Total Load on the system 92,306 MW 92,306 MW 92,306 MW
Frequency Responsive MW on line 75,294 MW 50,748 MW 51,998 MW
Spinning Reserve (total headroom) 38,041 MW 28,625 MW 29,875 MW
39 This is due to this case having the lowest inertia of the available cases at time of study. That is, lowest number of synchronous facilities online
to provide energy to arrest a frequency decline.
40 https://www.nerc.com/docs/pc/FRI_Report_10-30-12_Master_w-appendices.pdf
41 To assist in determining the total IBR penetration differences, the study case has a total or 48.2% IBR penetration and the frequency nadir
has 0.05 Hz margin until the first stage of WI UFLS.
42This is 12.5% of reduced spinning reserves or 16.67% of frequency response reserves.
NERC | Energy Storage: Overview of Electrochemical Storage | February 2021
14You can also read