ENVIRONMENT PLAN (YEAR 2) - East Cambridgeshire District Council A Strategy And Action Plan To Boost The Environment And Help Mitigate Climate ...
←
→
Page content transcription
If your browser does not render page correctly, please read the page content below

East Cambridgeshire District Council

ENVIRONMENT PLAN (YEAR 2)
A Strategy And Action Plan To Boost The
Environment And Help Mitigate Climate Change

                              June 2021
Contents
Foreword                                                    3
1 Introduction                                              5
2 Mitigating Climate Change                                 11
  Cambridgeshire-Peterborough’s Carbon Footprint            13
  East Cambridgeshire’s Carbon Footprint                    15
  East Cambridgeshire District Council’s Carbon Footprint   17
    Defining the Scope                                      17
    Excluded Emissions                                      19
    Data Collection                                         19
    Calculating the Baseline                                20
    Overall Summary                                         20
    Intensity Ratios                                        23
3. Carbon Emission Overall Target and Interim Targets       24
4. Biodiversity and the Natural Environment                 30
5. Ideas Forum                                              35
6. Actions and Projects                                     36
  Review of our Top 20 Actions for 2020/21                  36
  Our 20 Commitments for 2021/22                            43
7 Financing the Strategy and Action Plan                    45
8 Further Reading                                           46
9 Monitoring and Evaluation                                 47
  Identifying Projects                                      47
  Initiating Projects                                       47
  Monitoring                                                47
  Reporting Progress                                        47
  Baseline Year Recalculation Policy                        47
10 Stakeholder engagement                                   49
Appendices                                                  50

                                                    2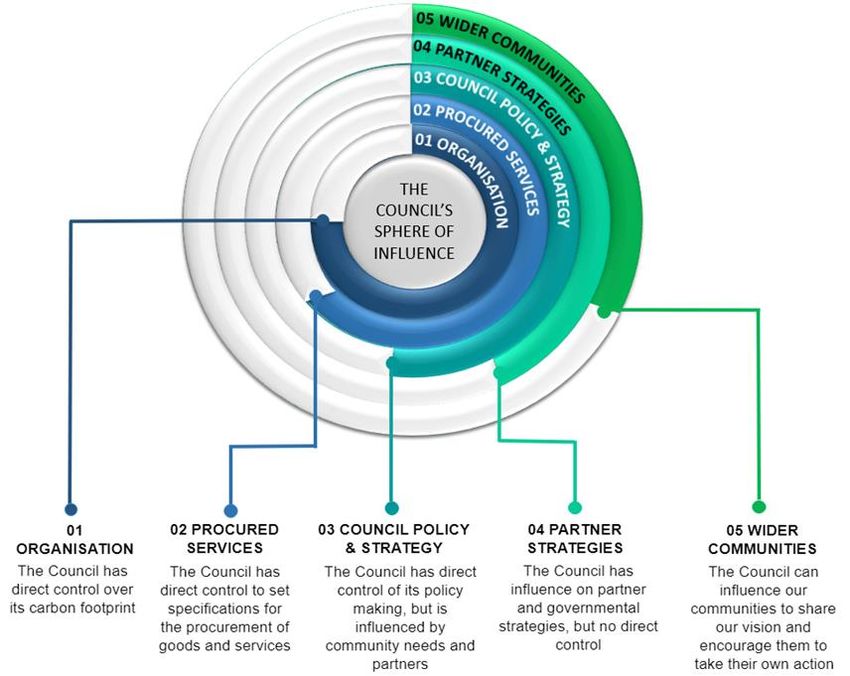
Foreword

In recognition of our declaration of a climate emergency, East
Cambridgeshire District Council published its first ever
Environment and Climate Change Strategy and Action Plan in
June 2020. I am very pleased to introduce this second edition,
June 2021.
I am delighted that this Council, over its first action year, has
achieved a huge amount despite, like you, having to deal with
the devastating impact of the pandemic.
We’ve seen real progress on our environment ambitions these past 12 months. My personal highlights
include:
   •    100% of electricity used by the Council is now sourced from renewable energy;
   •    We’ve replaced all street lights that we are responsible for with low energy LED bulbs;
   •    Based on robust evidence we gathered over the past year, we have successfully been
        awarded over £1m for energy efficiency improvements. This is new money, to spent this year,
        partly on our own buildings (The Grange, Ely), but the vast majority allocated for low income
        households in the district; and
   •    New planning policies adopted, which will help make sure developers do their bit for the
        Natural Environment and Climate Change.
But we need to step up our activities, go further and achieve more. And we urge you to do the same.
If 2020/21 was the year of the pandemic, let’s make 2021/22 the year of the environment, globally and
nationally, from cities to hamlets, and right down to our own homes.
I’m delighted that the UK will be the centre of global environment attention later this year, as we host
the UN climate summit in Glasgow (November 2021), bringing leaders from around the globe to
hopefully agree the next steps in tackling climate change and boosting our natural environment. And
I congratulate the UK government for committing in April to set the world’s most ambitious climate
change target into law, in order to reduce carbon emissions by 78% by 2035 compared to 1990 levels.
I am also thrilled to read of the Queen’s Green Canopy, a national programme of tree planting
launched in May to celebrate the upcoming Queen’s platinum jubilee. Also, the Environment Bill going
through parliament this year will bring significant natural environment benefits to our country.
But protecting our climate and our natural environment needs action by everyone, not just
governments. It requires action by individuals, community groups, businesses and other
organisations. And that includes this Council. This Council needs to demonstrate that it is doing all it
can to make a difference, whether that is by reducing its own carbon footprint, or by using its own land
to help boost the natural environment. And it needs to use its leadership role to help facilitate and
encourage others to also act.
This updated Plan reports on what we achieved over the past 12 months, and what we plan to do over
the next 12 months. We’ve created a new Top 20 set of actions we intend to deliver, which includes:
    •   planting more trees on our land (including a new hedge-based maze, designed by you!);
    •   putting in place energy efficiency measures in our own buildings;
    •   investigating whether we can install our own renewable energy infrastructure;
    •   doubling our efforts to work in schools to help educate the next generation of climate and
        environment leaders; and

                                                   3
•   offering free fruit trees to schools, community groups and parish councils, to help create
        community orchards of the future.
And we’ve set some new targets in this Plan, including an ambitious target of reducing our carbon
footprint by up to one-third by 2026, and by another third by 2030, with a view to being a truly net-zero
carbon council by 2040, ten years earlier than our original commitment set in 2019. It will be tough,
but we can do it: by reducing as much as possible the energy we use; by moving away from using
fossil fuels to electricity; and by generating our own renewable energy.
I’m really excited about the future. Let’s change the focus from tackling a pandemic crisis to tackling
the climate and biodiversity crisis. I want this Council to be at the forefront of that ‘green recovery’
agenda, and I would urge all of you to join us and play your part.
Together we can make a real difference; we can achieve a clean, green, East Cambridgeshire; and
we can do our bit to minimise global climate change.

Anna Bailey
Leader - East Cambridgeshire District Council

Acknowledgements

In preparing this Environment Plan, the Council wishes to acknowledge the help and support of the County Council. With
its agreement, we have aligned our Plan with its similar environment strategy, and have included similar diagrams and
statistical evidence.

                                                          4
1 Introduction

The overriding context
The current generation has a duty to protect and improve the health of our planet for those that follow.
The world is facing unprecedented challenges in population growth, climate change, pollution and
ever increasing and competing demands on its land and natural resources. By 2050 the world
population is expected to rise from its current level of 7.7 billion to 9.8 billion 1 . There is global
consensus that climate change poses significant risk to the health of the planet and its ability to sustain
life.
Local Authorities have a responsibility, both in their own activities and those undertaken with partners,
as well as in the influence they can bring to bear, to reduce the adverse effects of their populations
on the planet.
East Cambridgeshire, and Cambridgeshire as a whole, is a growing area. Increasing populations
result in increasing need for businesses, houses, health, retail and leisure outlets, transport and other
supporting infrastructure, all of which can lead to adverse impacts on the environment. With growth
comes a responsibility to balance competing demands and mitigate the negative impacts of that
growth as far as is reasonably possible.
We know, and fully support, that residents are calling for action. We acknowledge that this Council
has a significant role to play in protecting and improving the environment for future generations.

What have we declared?
In October 2019, East Cambridgeshire District Council declared a climate emergency and committed
to the development of an annual Environment and Climate Change Strategy and Action Plan (our
‘Environment Plan’). We published our first Environment Plan in June 2020, and, following a full
refresh, we are pleased to publish this second Plan.
This Council acknowledges that our natural and built environment is the most precious inheritance for
which we act as caretakers for the next generation.
We also accept that greater rigour is needed now, and hereafter, to protect our environment and
mitigate the effects of climate change. We accept that every day action is delayed it becomes more
likely we will pass irreversible environmental tipping points. Human driven climate change is one of
the most complex issues facing us today. It poses significant risk to our health, our economy, our
environment, and endangers the wellbeing of future generations.
Pollution, in all forms, is also another global environmental concern. It involves many dimensions –
science, economics, society, politics and moral and ethical questions – and is a global problem, felt
on local scales, that will be around for decades and centuries to come. People of all ages, all walks
of life and all social and economic backgrounds are becoming increasingly concerned they will leave
or inherit an environment that is irreparably damaged, forcing others to live with the consequences of
the decisions we make today.
Carbon dioxide, the greenhouse gas that has driven recent global warming, lingers in the atmosphere
for hundreds of years, and the planet (especially the oceans) takes a while to respond to warming. So
even if we stopped emitting all greenhouse gases today, global warming and climate change will

1
 United Nations, Department of Economic and Social Affairs
https://www.un.org/development/desa/en/news/population/world-population-prospects-2017.html

                                                    5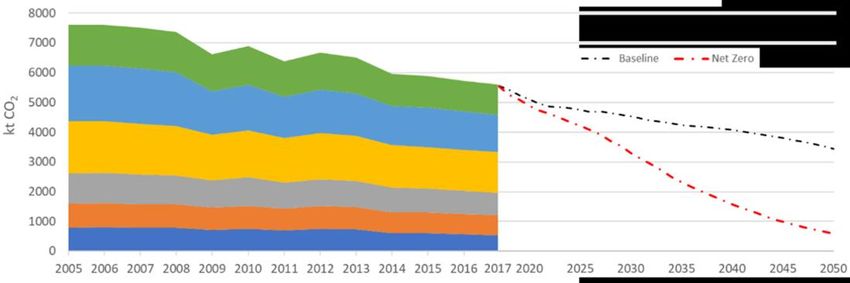
continue to affect future generations. All Governments (national, regional and local) have a duty to
limit the negative impacts of environmental change by cutting carbon emissions, protecting
biodiversity and reducing pollution. The necessity of reaching net-zero was enshrined in UK law on
27th June 2019, requiring the UK to bring all greenhouse gas emissions to net zero by 2050. More
recently (in April 2021), Government has committed to amending the law to include a new interim
target of a 78% cut in emissions by 2035.
Human activity contributes significantly to the increases in global average air and ocean temperatures,
widespread melting of snow and ice, and rising global average sea level. The International Panel on
Climate Change (IPCC) estimates that human activity has already caused 1°C warming above pre-
industrial levels. If temperatures increase at the current rate, warming is likely to reach 1.5°C between
2030 and 2052, leading to regional scale changes to climate including dramatic increases in the
frequency and intensity of flood or drought events across the world, including the UK. These risks are
set to increase should warming reach 2°C, and the longer that temperatures remain high, the harder
it becomes to reverse the damage.

Balancing growth and environmental protection
As one of the fastest growing counties within the UK, Cambridgeshire experiences increased demand
for things like housing, food, water resources and efficient public transport, all of which compete for
land use and put pressure on our natural environment. Some land use changes bring negative effects
to our environment, for example, damage to landscape from minerals extraction for building materials,
loss of natural habitat, increased air pollution from power generation, unsustainable travel and the
impact of agricultural pesticides on water quality and biodiversity.
Saying ‘no’ to growth is not an option. There is a pressing need for new homes and infrastructure, but
we recognise the need for sustainable growth such as minimising the need to travel, providing
sustainable transport options and reducing the carbon emissions from buildings, whilst enhancing
natural assets through restoring local heritage, providing increased green spaces for people and
nature and increasing tree planting to assist with shade and urban cooling.

Imperatives for Action
There are three clear imperatives for action, as outlined by the Global Commission for Adaptation,
which will directly impact our ability to serve our communities in the most effective way.
The Human Imperative: Climate change exacerbates existing challenges to our services and the
communities we serve. Increasing frequencies of heatwaves, flooding and its contamination of water
supplies pose a particular threat for our most vulnerable residents. Climate refugees, people
displaced from their homes as a result of the impacts of climate change, are likely to bring increased
pressure on our social care delivery by 2050. It also puts an unfair burden on future generations who
will have to cope with the challenges we are leaving them.
The Environmental Imperative: The natural environment is our first line of defence against extreme
environmental events such as floods, droughts and heatwaves. A thriving natural environment is
fundamental to effective and lasting adaptation. Yet, one in four species is facing extinction, about a
quarter of all ice-free land is now subject to degradation, and ocean temperatures and acidity are
rising. Climate change will bring adverse effects on our natural environment everywhere. We must
protect and work with nature to build resilience and reduce climate risks at all scales before the
damage has gone too far. Humans are, after all, part of nature, not apart from nature.
The Economic Imperative: Mitigation and adaptation are now in our strong economic self-interest:
the cost of doing nothing far outweighs the cost of taking positive action now. The Global Commission
on Adaptation has demonstrated that the overall rate of return on investments in improved resilience
                                                   6
is high, with benefit-cost ratios ranging from 2:1 to 10:1, and in some cases even higher. Introducing
climate adaptation considerations into our financial decision making will have commercial benefit to
our economy in the long run.

What have we done so far?
We know we can and must do more. But we should not dismiss the good work and action we have
already completed. In our first Action Plan (June 2020) we set out what we had already achieved as
a Council up to June 2020. In the last 12 months we have achieved further real progress to help
protect the environment - see Chapter 6 for details.
We need to build on this positive work, to further embed positive environmental thinking, behaviours,
and action throughout the Council, as an organisation, and to seek to influence partners and others
to do the same. This updated Plan aims to further facilitate that process.

Our Vision (updated for June 2021)
    Our vision for 2040 is to deliver net zero carbon emissions for the Council’s operations
    and, in partnership with all stakeholders, for East Cambridgeshire as a whole, with clear
    and demonstrable progress towards that target year on year. At the same time, we will
    support our communities and East Cambridgeshire’s biodiversity and environmental
    assets to adapt and flourish as our climate changes.
Our vision also fully aligns with that of the County Council, as follows:

          (Source of graphics: Cambridgeshire County Council Climate Change and Environment Strategy)

Interim Targets
This Council recognises the need to act fast now to reduce our net emissions as quickly as possible,
and as deeply as possible, on our journey to net zero emissions.
As such, and new for this second edition Plan (June 2021), the Council is bringing forward by 10
years, from 2050 to 2040, its own net zero carbon emissions target date, and for the first time has
set the following interim targets:
    • A 20-33% reduction in our net CO2e emissions by year 2025/26.
    • A 66-80% reduction in our net CO2e emissions by year 2030/31.
    • A near 100% reduction in our net CO2 emissions by year 2034/35.
    • A truly net zero carbon emission organisation by 2040, with no fossil fuel consumption.
For further information on how these interim targets have been established, and the assumptions
and definitions used, please see section 3.

                                                      7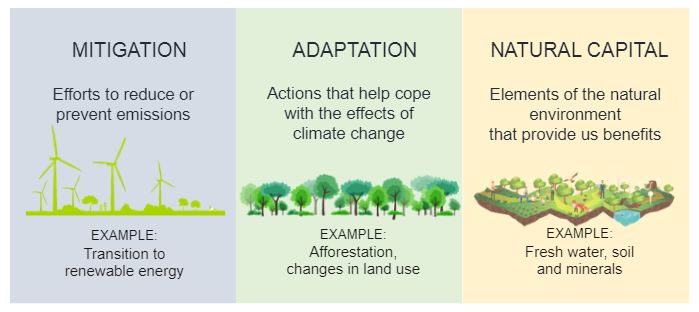
Purpose of the Environment Plan
The purpose of the Environment Plan is to provide a clear statement of the Council’s climate change
and environmental objectives and to set out how the Council will continue to address environmental
and climate change challenges.
It will describe how we will look to address our own impacts and how working together with our public
sector partners and our communities we will support the transformation needed across East
Cambridgeshire to tackle these challenges.

Objectives
Our Objectives are to:
   •   Reduce our own, and the district’s as a whole, greenhouse gas emissions to mitigate the
       impacts of human-made climate change;
   •   Support our communities and biodiversity to adapt to a changing climate;
   •   Improve East Cambridgeshire’s natural environment for the benefit of present and future
       generations;
   •   Empower East Cambridgeshire communities and businesses to buy-into and support the
       delivery of the Plan;

Our Approach
To deliver the vison and objectives of the Plan we will continue to step up our engagement with
Officers, Members, partners, businesses and our communities to build a shared understanding of the
challenges and grow our collective knowledge, capacity and skills to create the vision we have set
ourselves.
This will include:
   •   Identifying, and keeping up to date (annually), the carbon footprint for the Council’s
       operations and for the district as a whole;
   •   Monitoring and reviewing our carbon targets and tracking carbon emissions reductions for the
       Council’s operational footprint and the broader impact of its activities and policies;
   •   Preparing and regularly updating an action plan with our staff, communities and partners that
       shows how we are going to deliver our Plan, where we will lead or where we must support or
       work with others to lead;
   •   Working closely with Cambridgeshire and Peterborough Combined Authority and
       Cambridgeshire County Council to support the implementation of county wide measures;
   •   Demonstrating leadership and setting a good example, through using our numerous statutory
       responsibilities and duties to bring forward positive change; and
   •   Financing the delivery of the Plan and providing a framework for the Council to inform its
       budget setting and delivery of its corporate priorities for the people of East Cambridgeshire.

Identifying the Key themes to build our Environment Plan
In preparing its own strategy, Cambridgeshire County Council identified, in 2020, three key themes
covering technical, organisational and engagement aspects to provide the context and how we work
with partners and our community. East Cambridgeshire District Council endorses these themes and,
to assist with coordination of activities with the County Council, will use the same themes in this Plan.
They are:

                                                   8
• Quantifying our carbon footprints to inform and deliver climate change mitigation through
efforts to reduce or prevent carbon emissions;
• Adaptation to cope with the existing and future impacts of climate change;
• Enhancing and conserving natural capital such as wildlife, plants, air, water and soils.
(Source: Cambridgeshire County Council Climate Change and Environment Strategy)
What is mitigation?
Mitigation of carbon emissions addresses the causes of climate change. It describes those actions
which reduce, prevent or capture greenhouse gas emissions. Alongside the views of our
communities, the current carbon footprints of both this Council as an organisation, and that of the
entire geographical area of East Cambridgeshire as a whole, informs our action planning.
What is adaptation?
Adaptation consists of those actions that enable us to deal with the effects of climate change, such as
flood risk management in response to heavier more frequent rainfall. We have commenced
preparation of a separate document in relation to the adaptation actions the Council can take, though
Appendix 3 has some preliminary views on how society can and will need to adapt.
What is natural capital?
Natural capital comprises our ‘stock’ of waters, land, air, species, minerals and oceans. This stock
underpins our economy by producing value for people, both directly and indirectly. Goods provided
by natural capital include clean air and water, food, energy, wildlife, recreation and protection from
hazards. Improving our natural capital addresses how to enhance our existing nature reserves,
improve biodiversity and tackle air, land and water pollution to keep our planet healthy for all species.
Control and influence of the strategy
This is a Plan for the Council (rather than the district of East Cambridgeshire) and identifies how we
must work with our public and private sector partners and communities across East Cambridgeshire
and beyond. As part of its strategy, the Council recognises what is under its direct control and wider
influence. The diagram below was developed by the County Council, but is equally applicable to East
Cambridgeshire District Council:
910
2 Mitigating Climate Change
Introduction
Mitigation can mean using new technologies and renewable energy, making older equipment more
energy efficient, reducing consumption and waste, or changing management practices or consumer
behaviour, to reduce or prevent emission of greenhouse gases and limit the magnitude or rate of long-
term global warming due to human emissions of greenhouse gases.
It is important to understand that the sooner mitigation of carbon emissions occurs, the greater the
overall reduction of carbon emissions generated by 2040. For example, if you reduce 20 tonnes of
CO2 in 2020, this produces a cumulative impact of 400 tonnes reduction by 2040.
‘Net Zero Carbon’ means, first, the reduction of greenhouse gas emissions to the lowest possible
level. Then, for any remaining emissions, offsetting them through carbon removal methods such as
tree planting or carbon capture and storage, so we have ‘net zero’ emissions overall to the
atmosphere.
However, offsetting should be seen as a last resort. Planting trees, even on a massive scale across
East Cambridgeshire, will only go a tiny fraction of the way to balance out our current emissions.
For the UK as a whole, the net zero target legally must be reached by the end of 2050.
Pathway to Net Zero Carbon

              (Source: Cambridgeshire County Council Climate Change and Environment Strategy)

Carbon Footprints
Before an individual, organisation or nation decides what it should do differently to reduce its
emissions, it needs to properly understand what its current activities are emitting. This is sometimes
known as working out a ‘carbon footprint’ which, in technical terms, is a measure of the greenhouse
gases (GHGs) 2 emitted into the atmosphere from sources in a specified area or organisation. It
usually includes all relevant greenhouse gases, the most common of which is carbon dioxide (CO2).
Emissions of other GHGs such as methane (CH4) or nitrous oxide (N2O), are measured in ‘carbon
dioxide equivalent’ (CO2e)3.

2
  The main GHGs are: carbon dioxide (CO2), methane (CH4), nitrous oxide (N2O), hydrofluorocarbons (HFCs), perfluorocarbons (PFCs),
sulphur hexafluoride (SF6) and Nitrogen Trifluoride (NF3). The Kyoto Protocol – the international agreement addressing climate
change - covers these seven main GHGs. The last four are fluorinated gases ("F-gases") which are a range of man-made compounds
(including HFCs, PFCs, SF6 and NF3) used in a variety of industries including refrigeration, air-conditioning and the manufacture of
cosmetics, pharmaceuticals, electronics and aluminium. F-gases are extremely potent greenhouse gases with some having GWPs of
several thousand or more (BEIS, 2019a). The greenhouse gases covered by the Kyoto Protocol account for over 99% of global
greenhouse gas emissions.
3
 By using CO2e as a measuring tool means that the different global warming potential (GWP) of different gases are taken into
account. Quantities of GHGs are multiplied by their GWP to give results in units of carbon dioxide equivalent (CO 2e)

                                                                11
Nationwide, emissions of CO2 make up 81% of GHG emissions, with the remainder from methane
(11%), nitrous oxide (4%) and fluorinated gases (3%), when weighted by Global Warming Potential
(GWP)4. The biggest source of greenhouse gas emissions in the UK is transport, closely followed by
energy supply.
To help set the wider context, this Environment Plan reports the carbon footprint of the geographical
area of Cambridgeshire-Peterborough as a whole, then East Cambridgeshire as a whole, and finally
that of East Cambridgeshire District Council as an organisation.
Whilst not an exact science, you can also have a go at calculating your own (or your family’s) carbon
footprint using an online tool such as https://footprint.wwf.org.uk/. Calculating a carbon footprint can
provide a useful indicator of how much impact you or a business is having, and pointers to where
action could be taken to reduce the footprint (and hence reduce your impact on the environment).
4
Global warming potential. A factor describing the radiative force impact (degree of harm to the atmosphere) of one unit of a given
GHG relative to one unit of CO2.
12Cambridgeshire-Peterborough’s Carbon Footprint
In 2019, Cambridgeshire County Council’s annual collaboration with the Cambridge University
Science and Policy Exchange (CUSPE) brought a team of researchers together to develop an
evidence base of current carbon emissions for Cambridgeshire and Peterborough (improving on the
‘CO2-only’ data published by the Department for Business Energy and Industrial Strategy), to provide
a more accurate carbon footprint for the area.
This report found that Cambridgeshire and Peterborough communities together produced 6.1 million
tonnes of carbon dioxide equivalent (CO2e) in 2017. The breakdown of this is shown below (source:
CUSPE) (LULUCF = land use, land use change and forestry).
Figure: Breakdown of Cambridgeshire and Peterborough GHG emissions by source, 2017.
As well as looking at current emissions, the research team also modelled two scenarios projecting
future emissions up to 2050; presented as: “business as usual” and “net zero emissions by 2050”.
The difference between the two scenarios highlights the policy gap to reach Government’s ambition
of net zero carbon by 2050.
This is illustrated on the following page.
13Figure: GHG Emissions Pathways to 2050 (Source: Cambridgeshire County Council Climate Change and
Environment Strategy)
To achieve the ambitious reduction scenario, the report highlighted the key areas that Councils across
Cambridgeshire, and their partners, should consider incorporating into new policy, including:
• Decarbonisation of heat and improvements to the energy efficiency of the housing stock;
• Implementation of low carbon heating and carbon capture and storage in commercial and
industrial buildings;
• All cars, vans, buses and motorcycles and most HGVs to be electric, as well as shifting more
transport away from cars to walking, cycling and public transport;
• A significant reduction of food waste, reduction of demand for red meat and dairy by 20%,
and increased fertiliser efficiency, breeding measures, and livestock food additives;
• Deployment of carbon capture and storage on waste sites, increasing capture of landfill and
compost gas emissions and electrification of waste transport;
• Extensive afforestation;
• Further research on peatland emissions and to work with experts to find the best solution to
ameliorate the current impact of our peatland areas.
The full report from the CUSPE team can be viewed online here: CUPSE Report.
Cambridgeshire-Peterborough Independent Commission on Climate
More recently, and launched by the Combined Authority for Cambridgeshire-Peterborough in 2020,
the Independent Commission on Climate produced its Initial Recommendations report in March
2021. That report puts a spot light on four key areas of transport, buildings, energy and peat. It also
provides overarching recommendations, including the need for more investment into mitigating and
adapting to climate change.
It gives some practical suggestions for how residents can take action themselves, and calls for
Government to devolve more powers and funding to the Combined Authority and local authorities
across Cambridgeshire to support the reduction in greenhouse gas emissions. A final report is due
later in 2021. The Initial Recommendations report can be found at:
https://f.hubspotusercontent40.net/hubfs/6985942/CLIMATE%20COMMISSION%20REPORT_Final.pdf .
14East Cambridgeshire’s Carbon Footprint
Ideally, the carbon footprint for the geographical area of East Cambridgeshire should comprise all
GHG emissions that occur in the area – this includes commercial and industrial sources, domestic
homes, transport, agriculture, waste and land use.
There is no simple 100% accurate way of calculating a carbon footprint, as it relies on a number of
assumptions. The Government Department for Business, Energy and Industrial Strategy (BEIS)
annually publishes detailed local authority level CO2 emissions data. However, this does not provide
data on the other recognised Kyoto Protocol GHGs emissions, collectively known as CO 2e emissions.
As such, this data ‘misses’ 19% of all GHGs.
The data is published with a 2 year lag (year x-2), and therefore 2018 is the most recent data available.
From this, it is evident the trend in East Cambridgeshire is reflective of the national trend: CO 2
emissions slowly and steadily declining over the last few years, due mainly to the decarbonisation5 of
the electricity grid. See figure below. Emissions from agriculture, waste and peatlands are not
included in these figures because they primarily produce methane rather than CO 2, therefore are
missed from these calculations (BEIS, 2020). The drying (due to intensive agriculture) of peatlands is
also not included, but if they were included could increase the carbon footprint of East Cambridgeshire
(more research is underway on this, by the Combined Authority and other partners).
Figure: East Cambridgeshire’s CO2 emissions by end-user sector, 2005 – 2018 (BEIS, 2020)
5
Decarbonisation means reducing the carbon intensity of energy in the national grid, this is achieved by
reducing the proportion of fossil fuels and increasing the proportion of renewable energy sources such as solar
and wind.
15It is also useful to look at this data on a per capita basis. This shows that each resident in East
Cambridgeshire is currently responsible for emissions amounting to 7.81 tCO2 annually, illustrated in
the figure below, significantly higher than the national average at 5.19 tCO2. We are uncertain at this
stage precisely why this is the case, though most of Cambridgeshire has a similar higher than national
average.
Figure: Per capita emissions for East Cambridgeshire and UK National Average, 2005 – 2018 (BEIS 2020)
16East Cambridgeshire District Council’s Carbon Footprint
Defining the Scope
The previous section, looking at Cambridgeshire-Peterborough as a whole, and East Cambridgeshire
as a whole, used data collected and published by other parties. However, to work out the carbon
footprint of an individual company or organisation, like East Cambridgeshire District Council, then a
lot more data collection and analysis is required to determine a robust carbon footprint.
The starting point for carbon management is to accurately establish the emissions baseline. The
scope of the baseline includes the required types and sources of emissions over a defined timescale.
The baseline is a fixed point against which a reduction target can be set and future performance
monitored. Our baseline was set as emissions arising in 2018/19 (details below).
Emissions-releasing activities are classified into three groups known as scopes. Scope 1 and 2 are
generally considered to be areas that an organisation has a high degree of control over and can
therefore reduce the resultant emissions significantly, if not completely. Scope 3 are considered to be
indirect emissions that an organisation cannot directly control and therefore the ability to reduce
emissions to net-zero is less realistic.
These scopes, and their relevant associated activities, are defined in the GHG Protocol Corporate
Standard as follows:
Scope Definition / Activity
1 (Direct) Emissions from sources that are owned or controlled by the
organisation
Fuels Fuel sources combusted at a site or in an asset owned or controlled by the
organisation.
Refrigerants Refrigerants that leak from air-conditioning equipment.
Passenger vehicles Travel in cars and on motorcycles owned or controlled by the organisation.
Delivery vehicles Travel in vans and heavy goods vehicles that are owned or controlled by the
organisation.
2 (Indirect) Emissions that are a consequence of the organisation’s operations,
but occur from sources owned or controlled by another company
Electricity (grid) Electricity used by an organisation at sites owned or controlled by them.
3 (Other Indirect) Emissions that are a consequence of the organisation’s operations,
which occur at sources which they do not own or control
Business travel Travel for business purposes in assets not owned or directly operated by
the organisation.
Hotel stays Overnight hotel stays for work purposes.
Material use Process emissions from purchased materials.
Waste disposal Emissions from end-of-life disposal of different materials using a variety of
different disposal methods.
Water supply Emissions from water delivered through the mains supply network.
17Water treatment Emissions from water returned to the sewage system through mains drains.
Transmission & Emissions associated with grid losses (the energy loss that occurs in getting
Distribution the electricity from the power plant to the organisations that purchase it).
Well-to-Tank (WTT) Upstream emissions of extraction, refining and transportation of a primary
fuel source prior to its point of combustion.
Table: GHG Emission scopes and associated emission releasing activities (BEIS,2020)
In order to then produce our organisational carbon footprint it is essential to accurately establish the
scope of the operations on which our organisation will report. This process is known as defining the
‘organisational boundary’.
The organisational boundary means establishing what activities and functions are counted (or ‘in
scope’) for the purpose of determining the Council’s overall emissions, and by default what activities
and functions are not counted (‘out of scope’). This stage of the process involves reviewing the
Council’s operations to determine activities that give rise to carbon emissions.
We have determined that it is appropriate to include the following sources:
Activities typical to an office based
Scope Identified Council emission sources
organisation
Production of electricity, • Gas used in Council Offices e.g. The Grange
Stationary heat or steam • Gas used in buildings operated by the Council
e.g. E-Space North
Transportation of raw • Travel in cars, vans and heavy goods vehicles
Mobile
materials/waste operated by the Council
1
Hydrofluorocarbons • Air conditioning used in Council Offices e.g. The
(HFC) emissions during Grange
Fugitive use of refrigeration and
air-conditioning
equipment
Consumption of • Electricity used in Council Offices e.g. The
purchased electricity, Grange, Portley Hill Depot
heat or steam • Electricity used in street and car park lighting
which also includes road signs and illuminated
2 Stationary bollards
• Electricity used in business facilities operated by
the Council e.g. E-space North, E-space South
• Electricity used in public facilities operated by the
Council e.g. Ely Market Square, Jubilee Gardens
Stationary Production emissions
& from purchased Excluded (see below)
Process materials
Transportation of raw • Staff business travel and accommodation
3
materials/ products/ • Employee commuting – Excluded (see below)
Mobile waste, employee • Supply and treatment of water used in Council
business travel, Offices e.g. The Grange
employee commuting • Supply and treatment of water used in public
facilities e.g. Public toilets
Table: Identified Council related emissions in relation to typical GHG emissions for service sector / office based
organisations (WRI/WBCSD, 2004)
18Excluded Emissions
In addition to those sources detailed above there are other areas which give rise to emissions that the
Council feels should be included but for which, at this time, insufficient detail is held to enable them
to be included. These all fall within the category of ‘scope 3’:
Scope 3
• Waste production
• Purchased materials
• Employee commuting
• Third parties
It is not unusual for such matters to be categorised as ‘out of scope’. However, over time, we intend
to make as many of these areas as possible ‘in scope’, therefore taking even greater responsibility for
emissions arising, even where we don’t have direct control over those emissions.
Data Collection
The energy data used to calculate the baseline was gathered from different sources, for example
invoices received by the Council, annual energy statements from utility providers and property
services. Work continues to ensure that this data is robust and systems are in place to ensure ongoing
timely and accurate collection of such data.
Energy Type Source Data Quality/Estimation techniques
Gas Energy invoices from different Where estimations have been used records
suppliers, meter readings. are held with source data.
Methods include:
Annualising consumption or average data
calculated using bookended data.
Passenger vehicles Staff mileage claims, fuel Annualising consumption where required
purchased and vehicle log
books.
Delivery vehicles Fuel purchased and vehicle log Annualising consumption where required
books.
Electricity Energy invoices from different Where estimations have been used records
suppliers, meter readings. are held with source data.
Methods include:
Annualising consumption or average data
calculated using bookended periods.
Business travel Staff mileage claims N/A
Hotel Stays Staff claim forms N/A
Refrigerants Energy invoices N/A
Water supply Energy invoices from different Annualising consumption where required
suppliers.
Table: Source of data by energy type
19Calculating the Baseline
To calculate CO2e emissions arising, it is necessary to convert the ‘raw’ data (such as KWh of
electricity used) into CO2e emissions. This process is relatively straight forward, using what are known
as ‘conversion factors’. The carbon conversion factors used for this Plan are the 2018 UK Government
published carbon conversion factors (BEIS, 2020c).
The Council will use the most up to date conversion factors each time it updates this Plan or reports
on its carbon footprint. The key conversion factors used (for this second Plan, June 2021) are as
follows:
Energy Type Conversion factor
Fuels
Natural Gas 0.18385 kg CO2e / kWh (Gross CV)
Diesel (average biofuel blend) 2.59411 kg CO2e / litre
Petrol (average biofuel blend) 2.20904 kg CO2e / litre
Electricity
UK electricity 0.2556 kg CO2e / kWh (Gross CV)
Vehicles (passenger, delivery and business travel)
Small diesel car 0.22868 kg CO2e / mile
Medium diesel car 0.27459 kg CO2e / mile
Large diesel car 0.33713 kg CO2e / mile
Small petrol car 0.24736 kg CO2e / mile
Medium petrol car 0.30945 kg CO2e / mile
Large petrol car 0.45536 kg CO2e / mile
Small car (unknown fuel type) 0.24072 kg CO2e / mile
Large car (unknown fuel type) 0.36785 kg CO2e / mile
Average car (unknown fuel type) 0.28502 kg CO2e / mile
Water
Water supply 0.344 kg CO2e / cubic metres
Water treatment 0.708 kg CO2e / cubic metres
Transmission & Distribution
UK electricity 0.02413 kg CO2e / kWh
Well-To-Tank
Various Various (dependant on fuel type)
Table: Key GHG conversion factors (BEIS 2020)
Overall Summary
The carbon footprint of East Cambridgeshire District Council (as an organisation) comprises
emissions that occur as a result of the Council’s own operations. We have calculated the carbon
footprint of the Council’s own operations in line with the UK Government’s Environmental Reporting
Guidelines for Voluntary Greenhouse Gas Reporting6.
6
These reporting guidelines are based on internationally-recognised standards from the World Resources Institute and
World Business Council for Sustainable Development: the GHG Protocol Corporate Accounting and Reporting Standard,
and the GHG Protocol Scope 3 standard. (BEIS, 2019a)
20The first Plan, of June 2020, reported the baseline upon which future years progress will be monitored.
That baseline carbon footprint (using data for the financial year 1 April 2018 to 31 March 2019) resulted
in a baseline carbon footprint for the Council, as an organisation, for 2018/19 of 1,317 tonnes of
CO2e (full breakdown in the June 2020 Plan).
This second Plan, of June 2021, reports the carbon footprint for the Council for 2019/20 (i.e. to April
2020). It therefore accounts for emissions which occurred prior to the first Plan being produced in
June 2020. As such, actions taken since the first Plan was agreed in 2020 are not reflected in the
calculations for the carbon footprint reported below, but should start to be reflected in the June 2022
Plan onwards.
The resultant carbon footprint is calculated as being (for 2019-20) 1,315 tonnes of CO2e. This is
summarised in the table below:
Total Gross Emissions 2019-20 Tonnes of CO2e % contribution
for Scope 1 (Direct) 871 66%
for Scope 2 (Indirect) 120 9%
for Scope 3 (Other indirect) 325 25%
Grand Total 1,315 100%
Table: Emissions by scope, 2019-20
Scope 1 (direct) and scope 2 (purchased electricity) emissions amounted to 991 tonnes CO2e. Scope
1 and 2 includes emissions from gas and oil for heating our buildings, electricity for our buildings and
street lighting etc. and emissions from fleet vehicles.
Thus overall, in headline terms, the Council’s carbon footprint for 2019/20 (1,315 CO2e) showed little
change from the baseline year of 2018/19 (1,317 CO2e) being only slightly down by 0.15%, but as the
figures on the next two pages demonstrate, there was a fairly significant drop in emissions from its
buildings but an opposite increase in its vehicle’s emissions, increasing the share of emissions via
vehicles to over four-fifths of all the Council’s emissions.
Further details on the 2019/20 carbon footprint are provided on the following two pages, starting with
a breakdown in more detail of where the Council’s emissions arise.
Figure: Emissions by business area, 2019-20
21Understanding the Council’s biggest emitters helps focus identification of projects, as set out in
Section 6 of this Plan. The largest single contributing area is a consequence of the Council’s ‘fleet
vehicles’ (i.e. the vehicles it uses for waste collection, maintaining our parks and open spaces, general
maintenance of our properties and land, and any lease vehicles; it also includes what is known as
‘well to tank’, that being the emissions arising from the production and distribution of fuel before it
enters the vehicles). When the Council’s fleet vehicles are combined with the relatively small (but still
significant) staff business travel, the Council’s ‘transport’ activities consequently result in 1,097 tonnes
of CO2e in 2019/20 (baseline = 1,049tCO2e), which is 83.4% of the Council’s entire volume of
emissions. In comparison, the Council’s buildings (such as The Grange and E-Space North) emitted
216 tonnes of CO2e (baseline = 268tCO2e), or 16.6% of the Council’s emissions.
Of the Council’s ‘fleet vehicles’, the following table breaks the figures down further, and also factors
in the ‘well to tank’ element for each row. As can be seen below, the Council’s waste collection vehicles
are responsible for two-thirds of the Council’s entire emissions:
Fleet Vehicle Activity Fleet Vehicle Activity Tonnes CO2e % of Council’s
Distance or fuel consumed (including well entire emissions
to tank element) of 1,315 tonnes
Waste Collection (ECSS) 265,169 litres diesel 851 64.7%
15,803 litres diesel & 4,276 4.7%
General Maintenance 62
litres petrol
Parks and Open Spaces 22,257 litres diesel 71 5.4%
Lease Vehicles 15,907 miles 5 0.4%
Total (fleet vehicles as a % of Council’s total GHG emissions) 75.2%
Table: Fleet vehicle emissions by activity
More detailed figures on all the Council’s emissions are set out below (with ‘well-to-tank’ listed
separately, rather than merged into the individual applicable rows):
Grand
GHG Emissions (Tonnes CO2e) Scope 1 Scope 2 Scope 3
Total
Buildings & utilities 71 119 26 216
Electricity for Council Buildings - 118 - 118
Electricity for Street Lighting - 1 - 1
Gas Consumption 71 - - 71
Water and sewerage - - 7 7
Transmission & Distribution - - 10 10
Well-to-tank emissions for fuels used - - 9 9
Transport 800 - 297 1,097
Staff Business travel - - 85 85
Fleet Vehicles 800 - - 800
Well-to-tank emissions for fuels used - - 212 212
22Waste - - 1 1
Council Building Waste Disposal - - 1 1
Grand Total 1,315
Table: Breakdown of emissions, tonnes of CO2e
Figure: Breakdown of emissions by scope and type, tonnes of CO2e
Intensity Ratios
Intensity ratios express the GHG impact per unit of physical activity or unit of economic value. It is
common for organisations to report their intensity ratio, though this is only really of value when
comparing one organisation with a very similar organisation, to see how a ‘peer’ organisation
compares. The intensity ratio that is most relevant to the Council’s emissions is tonnes of CO 2e per
full time equivalents. The Council employed 183 FTE in 2019-20 which equates to an intensity
measure of 5.41 tCO2e/FTE (scope 1 and 2 only).
233. Carbon Emission Overall Target and Interim Targets
Introduction
When declaring a climate emergency in October 2019, the Council agreed that it “will explore and
consider…measures required and feasibility of reaching net zero carbon emissions by the Council by
2050”. The relevance of 2050 is important: it is the same year legally committed to by UK government,
whereby UK greenhouse gas emissions by 2050 should be net zero emissions7.
However, even since October 2019, the urgency to reach net zero as soon as possible is ever
increasing, and the importance of deep, early cuts to emissions is increasingly needed. For example,
national Government itself has recently (April 2021) committed to a 78% cut by 2035, as a step
towards net zero by 2050. And new analysis shows that, across Cambridgeshire, we are starting at a
higher baseline than most other area - our emissions are approximately 25% higher per person than
the UK average8. Put another way, we have only about 6 years remaining under ‘business as usual’
before Cambridgeshire, as a collective, will have exhausted all of our ‘allowed’ share of emissions to
20509. We can’t, therefore, wait until 2050 to act. We have to act now.
As such, over the past 12 months, the Council has explored two matters: first, whether the 2050 date
should be brought forward for the Council’s operations to become net zero; second, establishing a set
of interim targets to monitor progress towards net zero.
As set out in the previous section, the Council’s ‘carbon footprint’ is 1,315 tonnes CO2e in the financial
year 2019/20. That is the figure we need to drive down as quickly as possible.
Determining interim targets requires an analysis of what is causing our emissions. The previous
section highlighted the following:
• The Council’s Fleet Vehicles (of which, waste collection vehicles are the primary source)
are far and away the leading cause of the Council’s emissions: around 75%.
• Our two main buildings also cause a significant contribution, with The Grange
(predominantly heating, electric use): 10%; and E Space North: 5%.
• Vehicle business mileage, from staff and Members undertaking site visits or meetings etc
(but does not include staff commuting; but such mileage would form part of an individual’s
carbon footprint) also makes a significant contribution: 7%.
To get to net zero emissions, then obviously each of the above contributors needs to reduce their
fossil fuel consumption to zero (or close to zero) and do so by relying more on renewable sources of
energy.
One option, especially in the interim stages towards net zero, is to produce more renewable energy
than it consumes, to offset any remaining fossil fuel or other combustion fuel usage. However, this is
not technically allowable under the true definition of ‘net zero carbon’ because it still involves the use
of fossil fuels which are not offset by carbon capture. But, an argument can be made to use this as a
basis for interim targets during the period when the national grid is still reliant on fossil fuels, because
the renewable energy generated and exported to the grid should result in an equivalent reduction in
7
- see The Climate Change Act 2008 (2050 Target Amendment) Order 2019
8
- see Cambridgeshire & Peterborough Independent Commission on Climate, Interim Report, March 2021
9
- see Cambridgeshire & Peterborough Independent Commission on Climate, Interim Report, March 2021
24fossil fuels needed to be consumed by the grid (though this assumption will gradually become less
reliable, as the grid on some days of the year (sunny and windy days) could be entirely renewable
energy fed in any event, meaning any additional renewable energy fed into it by the Council’s
infrastructure would not be offsetting any fossil fuel use, unless such energy is stored in some way).
Overall, to get to net zero will require national measures (primarily, the 100% decarbonisation of the
electricity grid, and the likely outlawing of fossil fuel direct combustion in vehicles). Ultimately, it will
require society to be almost entirely run on electricity (rather than direct combustion of fossil fuels,
such as gas, petrol and diesel), and that electricity created through renewable energy sources.
But, this Council does not want to simply ‘wait for change to happen’ and wait for measures to be
mandated on organisations such as this Council. Indeed, many would argue we have a moral duty to
make change happen, and quickly, in order for this Council to do its bit to help avert the worst of the
emerging environmental crisis. As such, setting challenging organisational-targets towards net zero
is a sensible and appropriate measure for all organisations, including this Council.
Establishing a set of Targets
So, what could those interim targets be for the Council? The Council has considered a wide range of
evidence to inform its position, including:
• Research emerging from the Tyndall Centre, a partnership of universities bringing together
researchers from the social and natural sciences and engineering to develop sustainable
responses to climate change, which often broadly recommends that CO2e emissions for an
organisation should be reduced by an average of 13.5% per year, or 50% every 5 years.
• The need for deep cuts in emissions to be made early, and the more difficult (smaller) cuts to
be made later. One of the principles behind their approach is the idea that to meet Paris
Agreement (2015) commitments and IPCC recommendations (2018) (i.e. limit global
temperature to 1.5C increase), we have around 7 years of Business as Usual (BAU) carbon
left to emit i.e. if we carry on as normal, within about 6-7 years from now, we would have used
up our entire ‘budget’ of carbon that can be emitted if we are to stay within 1.5-2% rise in global
temperatures. To stretch out those years beyond 7 years requires cuts to be made now, and
the deeper the earlier cuts are, the longer you can stretch it out before you need to eliminate
carbon emissions entirely (on a net basis).
• In December 2020, the UK Climate Change Committee published a ‘world first’ detailed route
map for a fully decarbonised UK, and set a target of 78% cuts in emissions by 2035 (from a
1990 base – by 2019, UK emissions are already down 41% from 1990 base). Interestingly,
such cuts by 2035 are not recommended to be evenly spread across all industries and uses,
with some operations targeted as 100% net zero before 2035, and others (such as “trucks”)
being low carbon “by 2040”. Turning the CCC 78% target by 2035 into an ECDC target is
difficult, because of the 1990 baseline adopted by CCC, rather than our 2018/19 baseline. But,
roughly speaking, and reflecting the 41% reduction already made nationally, it equates to a
65% emissions cut by 2035 as an ECDC organisational target.
• In April 2021, UK government backed the above target of a 78% cut in emissions by 2035, and
committed to putting that target into law.
• Reviewing the targets being set by other Councils across the country, and their proposals to
meet any such targets (though many Councils have set no target at all).
• Cambridgeshire-Peterborough Climate Commission work, as commissioned by the Combined
Authority, which has published a set of interim recommendations including a recommendation
25that “All…Council operations should be net zero by 2030, underpinned by a regional Science
Based Targets (SBTi)-type action plan.”
• Consideration of targets and recommendations from a wide range of other organisations and
lobby groups, such as, for example, that of Extinction Rebellion UK, which seeks the UK to
become net-zero by 2025.
In determining an interim target, it has to be ambitious yet realistic. And, on that basis, it is a statement
of fact that the biggest source of emissions by the Council is from its vehicle fleet, and of that (and by
far), from its waste collection vehicles.
And therein lies a fundamental problem: reducing the emissions from our vehicle fleet is extremely
challenging and not a straight forward problem to solve or plan for. First, it would require low
carbon/electric waste collection vehicles to be available on the market, that can successfully
undertake waste collection in a rural district such as East Cambridgeshire. Put simply, such vehicles
are not presently available. Even if they were, or soon became available, they would require
considerable capital cost to purchase (running into £m’s). And, to complicate things further,
Government has delayed consulting and finalising its waste strategy, with such a strategy presently
expected to dictate significant changes to the way waste is collected and managed, which means any
early purchase of new vehicles now could be incompatible with that new national strategy and
requirements.
Even if these hurdles can be overcome in the next few years, it also has to be factored in that getting
rid of perfectly useable vehicles ‘early’ (i.e. before end of life), in order to switch to a low carbon
vehicle, could arguably be a counter-productive measure from an emissions point of view due to the
huge embodied carbon10 in a new vehicle. This is because the embodied carbon in a vehicle is often
greater than the carbon emissions emitted in the entire operating life of a fossil fuel consuming vehicle
(it is, for example, accepted internationally that most petrol or diesel cars produced in the world
consume more energy (and hence emissions of CO2e) during the manufacturing of that car, than the
car will ever emit through its entire life of petrol/diesel consuming use).
Thus, buying an electric waste collection vehicle or other low carbon vehicle may appear a good
measure, and will actually reduce a council’s headline annual carbon footprint (especially if the vehicle
is charged via renewable energy), but the net consequence on the environment may be worse due to
the hidden carbon footprint of embodied carbon – put more simply, you could be doing wrong, when
you think you are doing right. Taking the right decision, therefore, is not always a simple calculation,
irrespective of the amount of money involved.
On the basis of the evidence available, therefore, it is not feasible to set a significant reduction in
carbon emission from our (waste collection dominated) fleet vehicles until probably around 2030,
when it is hoped such low carbon / electric vehicles will be available on the market. In the meantime,
as an alternative, we should focus on making the delivery rounds of such vehicles as efficient as
possible (and hence reduce the miles travelled), investigate whether any lower emission fuels are
available to service the existing fleet (such as biofuels) and put in place a target date of securing low
carbon / electric fleet vehicles starting from around 2030, and ending by 2035. Any new purchase in
the meantime (to replace any vehicles which reach end of life prior to 2030), should focus on aligning
to a new end of life of around 2030 to 2035.
10
Embodied carbon includes any CO₂e created during the manufacturing of a product (eg building materials require
material extraction, transport to manufacturer, manufacturing etc) and the transport of those products to the final
destination (eg building materials to the building site). Put simply, embodied carbon is the carbon footprint of a
product or project before it becomes operational or is used.
26Turning to our office and other buildings, there is greater scope to reduce their carbon footprint in the
shorter term, through a combination of energy efficiency measures, behaviour change (of staff
occupying and using such buildings) and through renewable energy generation. As part of that
process, we should make the transition away from gas heating to electric based heating, but only
when such gas heating systems reach, or are close to reaching, ‘end of life’, again for embodied
carbon reasons. Again, we could target a 2030 date for such a transition to take place.
However, even if we implemented all of the above by, say, 2030 or 2035, for vehicles and for buildings,
the Council would not be ‘net zero’ because of the carbon element of electricity. For example, an
electric vehicle in use today is not ‘carbon neutral’ if it is charged up via the grid (the grid still being
powered by gas and coal to a significant degree).
Thus, to align to the ‘net zero’ aspirations, the Council itself would need to generate the same amount
of electricity from renewable sources as it consumed, at least until the national grid was truly
decarbonised. To do this, the Council would need to explore direct investment in renewable energy
generation, on its own land, on a commercial scale. For example, rather than the Council focussing
only on reducing its energy use, it also focusses attention on generating renewable energy in the first
place. And, in doing so, determines how, for each £1 spent, the greatest net CO2e savings can be
achieved.
For example, once the easier and relatively inexpensive energy efficiency saving measures have been
taken (on our buildings or vehicle routes), chasing further savings may cost a lot of money for very
little CO2e saving. A more effective measure could be to generate renewable electricity ourselves, so
that overall our emissions are reducing towards net zero on an interim basis. Of course, land will be
needed to make this happen (and may have to be bought if not available). There will also be planning
issue to consider, as well as local community views on installing renewable energy infrastructure. But,
very approximately, and subject to those issues and constraints, an investment of around £2m in
renewable infrastructure (e.g. for a relatively small solar PV farm (5-8ha), or 1-2 wind turbines) would
likely generate enough electricity and CO2e savings equivalent of the entire CO2e that ECDC presently
emits, per year. That investment would, of course, also deliver an annual financial return from the
selling of such generated electricity.
This Council has agreed to investigate the potential of this option, and is presently securing preliminary
advice on what its options are. The most promising appears to be PV solar panels on its own land,
potentially acting as a ‘roof’ over one or more of its car parks.
If the investigations prove that a deliverable and viable option exists, then it is feasible for such
measures to be in place by 2025, and the scale of which could steadily grow up to 2030 and beyond.
Bringing all of the above together, the evidence is pointing to the following ambitious interim targets
as being realistically possible (though note the definition of what is a ‘net reduction’ in the third bullet,
and also note the risks on the following page):
• A 20-33% reduction in our net CO2e emissions by year 2025/26. That will be achieved via:
reduced energy use in our buildings; a lower carbon conversion factor for the energy we do
use, due to the broader national decarbonisation of the electricity grid; maximising the efficiency
and performance of our existing fleet vehicles; investment in our own renewable energy
infrastructure; and minimising the use of business miles of our staff.
• A 66-80% reduction in our net CO2e emissions by year 2030/31. That will be achieved via
further investment in our own renewable energy infrastructure; some investment in electric
based fleet vehicles; and (potentially) moving off the gas grid to heat our buildings.
27You can also read