Equity Outlook September 30, 2020 - Franklin Street Partners
←
→
Page content transcription
If your browser does not render page correctly, please read the page content below
September 30, 2020
Equity Outlook

Rounding the Final Corner of a Turbulent 2020
In the third quarter, global equities added to one of the
strongest intra-year rallies in market history and continued
their robust recovery from pandemic-induced weakness earlier
in the year. The benchmark S&P 500 index is now up 5.6%
year to date even as the pandemic remains at large. During the
third quarter, familiar large cap growth companies continued
                                                                      Christy L. Phillips         Dennis C. Greenway, II, CFA Todd D. Young
to lead the recovery, raising questions over concentration risk       cphillips@fspnc.com         dgreenway@fspnc.com         tyoung@fspnc.com
and the potential for cyclically-oriented rotation. Overall, we       Head   of Equity Strategies Senior Equity Analyst and   Senior Equity Analyst
                                                                      and Director of Research    Portfolio Manager           and Portfolio Manager
believe the largest risks to equity performance relate to the
ongoing Covid-19 pandemic – the potential emergence of a damaging second wave, delayed vaccine development and/or
distribution, and other related issues that threaten to derail progress toward recovery and the return toward normalization.
Additional concerns include the looming November U.S. election season, possible fiscal and/or monetary policy missteps,
and continuing geopolitical tensions with China. Despite these worries, remain constructive overall on equities,
particularly given the absolute low levels of global interest rates and the continued improvement in the corporate earnings
outlook. While many investors are wondering if the market is exhibiting irrational exuberance, we think the rebound has
been broadly warranted, and we forecast a sustainable long-run recovery in the U.S. economy.

                                                                                                                                                  1
EQUITY MARKET RECAP

For the third quarter of 2020, the benchmark S&P 500
gained +8.9%, another solid quarter of performance
and, along with the June quarter, part of the best
two quarter performance since 2009. Following the
S&P 500’s 2020 closing low on March 23, the index
increased +51.8% and remarkably stood higher on
the year by +5.6%. Smaller U.S. stocks also enjoyed
a solid rally, with the mid cap S&P 400 and small
                                                          economically-cyclical sectors in Materials and
cap Russell 2000 advancing +4.8% and +4.9%,
                                                          Industrials also bested the overall index. Energy
respectively. Growth stocks continued their long-
                                                          remains a troubled sector and was down over -20% for
running outperformance relative to value counterparts,
                                                          the September period; despite relatively range-bound
as the Russell 1000 Growth Index provided a +13.2%
                                                          crude oil prices and an impressive rally in natural gas,
gain versus +5.6% for the Russell 1000 Value Index
                                                          energy-related equities continue to struggle from
for the September quarter. International stocks also
                                                          concerns over both oversupplied conditions and a long
participated in the move higher; the MSCI ACWI
                                                          recovery in underlying demand.
ex-U.S. index gained +6.3% for the third quarter while
the MSCI Emerging Market Index was up +9.7%.              The discussion over “growth versus value” has been
The Japanese Nikkei 225 and Shanghai CSI 300 led          a popular topic, as the gap in performance has been
major international markets, while indices in the U.K.,   significant for some time. Since growth stocks began
France, and Spain lagged.                                 their relative outperformance at end of the second
                                                          quarter of 2013, the Russell 1000 Growth Index has
Ten of eleven S&P 500 sectors posted positive
                                                          recorded a cumulative total return of +232.1% versus
performance during the third quarter. Performance
                                                          +70.8% for the Russell 1000 Value Index and +142.7%
varied wildly during the period. While traditionally
                                                          for the S&P 500. Speculation over the reasoning
“growth-oriented” sectors such as Consumer
                                                          for this outperformance has been wide and includes
Discretionary, Technology, and Communication
                                                          anything and everything from interest rate policy
Services outperformed the broader benchmark,
                                                          to the rise of systematic and quantitative trading

                                                                                                                     2
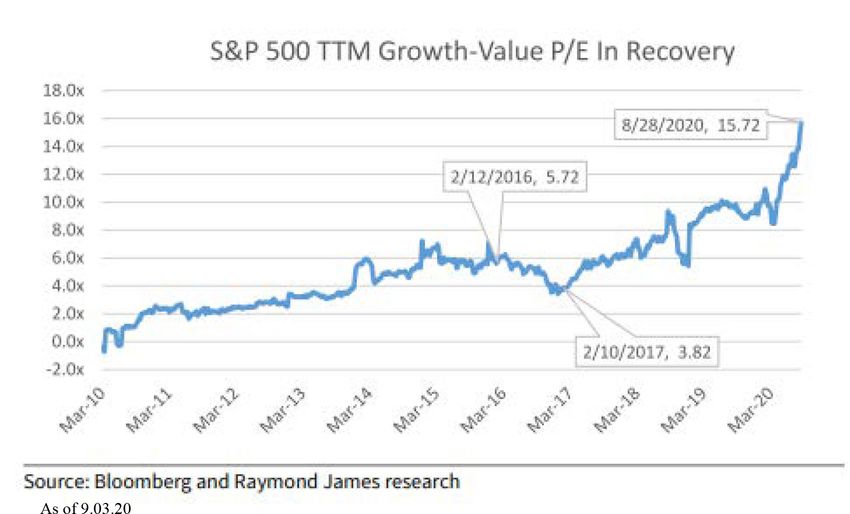
strategies. During the crisis, growth has only expanded   the most recent period, we have selectively been
its P/E premium over value as illustrated in the chart    adding companies with more economic sensitivity to
below. However, there have been several occasions         a recovery, yet continue to meet our definition of an
in 2020 where year-to-date growth leaders trail more      advantaged business.
cyclically-oriented laggards that are often more
commonly found in value indices, i.e., the rotation
trade. This pattern has occurred on multiple occasions
– from mid-May to mid-June, from early to mid-July,
and most recently, from early to mid-September. In
each instance, market watchers debate the likelihood
of a more lasting rotation from growth to value.
How do we manage the growth versus value positioning
at FSP? Specifically, we manage concentrated large-
cap equity strategies, all benchmarked to the S&P
500, with a variety of style tilts that reflect risk,
return, and income objectives. Our investment
process does not focus on a simple growth versus value
                                                          WHAT TO EXPECT GOING FORWARD
framework; rather, we try to identify businesses in all
sectors with sustainable structural, competitive, and/    The outlook for global equities in 2020 dawned with
or economic advantages with attractive valuations.        reasonable optimism; trade tensions between the
We have favored growth-levered companies in 2019          U.S. and China, the world’s two largest economies,
and 2020, particularly technology and consumer-           had begun to thaw and suggested a stabilization
related companies in industries such as digital           of global economic growth. However, the entire
graphics and video gaming, financial technology, and      tenor of the year quickly changed in mid-February,
differentiated consumer businesses with a strong          as the rapid spread of the Covid-19 virus led to the
e-commerce presence. However, the portfolios’ are         World Health Organization declaring the first global
not overwhelmingly levered to growth in any of our        pandemic in over a century in mid-March. Since that
concentrated strategies at the current time. During       point, Covid-19 and the responses to the pandemic

                                                                                                                  3
by global monetary and fiscal authorities have been       moving from +20% in early August to +35% as of
the most important factors affecting risk assets          October 9th. Reported employment statistics have
in all geographies. We expect this to continue for        also recovered more quickly than expected; the U.S.
the balance of 2020 and into next year. The biggest       unemployment rate peaked in April at 14.7% but has
determinant of equity performance remains the             since fallen to 7.9% in September. The consistent flow
Covid-19 pandemic and its impacts on both global          of better-than-expected economic growth has been
economic growth and corporate profitability.              a key factor in positive equity performance from the
                                                          March bottom. We believe the rebound is broadly
Since the U.S. and a majority of the developed
                                                          warranted, and we forecast a sustainable long-run
world began voluntarily shutting down much of its
                                                          recovery in the U.S. economy.
economic output and overall activity in early March,
investors have speculated about the shape of the          Fears of an intensifying reemergence of Covid-19
recovery and the path of the “reopening” process.         cases (the “second wave”) have been discussed since
Domestically, reopening has not been a coordinated,       the pandemic’s start. While scientists have learned
linear progression – the virus affected various regions   much about the disease in a relatively short period
at different times and individual states and localities   of time, the likelihood of a second wave is not truly
have pursued vastly differing reopening policies based    known; this has not stopped speculation that cooler
on any number of factors. As expected, there have         temperatures in the Northern Hemisphere’s autumn
been ebbs and flows during the process, with both         and winter seasons, along with seasonal common cold
pullback and accelerations requiring close attention      and influenza concerns, could slow reopening progress
as to the potential impacts on economic activity. Not     and put a damper on expected economic growth. In
surprisingly, economic data has been extraordinarily      the last weeks of the third quarter, there was a rise
volatile, but reports have largely surprised to the       in positive cases in many European countries, and
upside. Second-quarter U.S. GDP estimates were            daily positive cases in New York State exceeded 1,000
feared as low as -40% to -50%, but the revised figure     on September 29 for the first time since mid-June.
currently stands at -31.4%. Further, estimates of         Certainly, potential second wave data will be monitored
the recovery in the third quarter have also steadily      closely given its importance in the progression of
increased with the Atlanta Fed’s GDPNow assessment        recovery.

                                                                                                                    4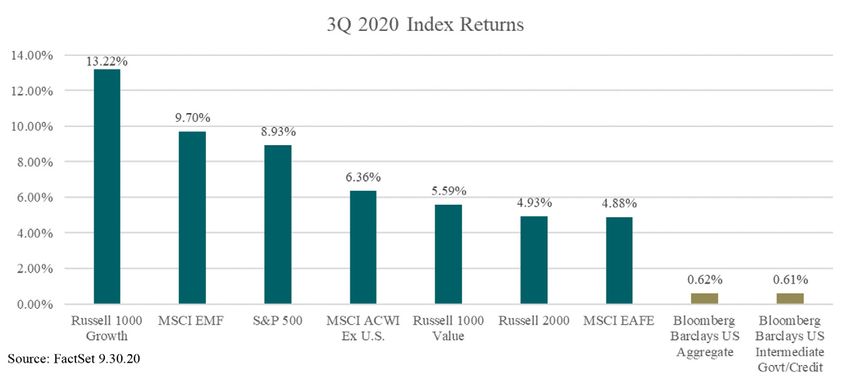
As we move into the fourth quarter of 2020 and               presidency, as stocks have performed both strongly
into 2021, a key catalyst for equities, in our view, will    and poorly under both Republican and Democratic
be the successful development and distribution of            administrations. However, a contested result that
an effective vaccine as well as therapeutic options.         extends the process and raises legitimacy concerns
Progress toward the vaccine goal accelerated in the          could create uncertainty in the minds of investors and
third quarter, as no less than 8 potential vaccines (of at   lead to elevated volatility. Other volatility triggers
least 180 in development) were in large-scale efficacy       include the potential for a policy mistake from either
and safety trials (Phase 3). The U.S. government’s           monetary or fiscal authorities, such as an ineffective
Operation Warp Speed has a stated goal of producing          stimulus program from Congress, and a flaring of U.S./
and delivering 300 million doses of an effective vaccine     China geopolitical anxieties. While none of these
with initial doses available by January 2021, and there      issues would constitute our “base case,” we do consider
have been numerous rumors and whispers of an                 their potential effects on economic growth and
accelerated schedule. As we’ve discussed previously,         corporate profitability.
the significance of continued progress toward an
                                                             Similarly to evaluations of economic growth, the range
effective vaccine should not be underestimated, given
                                                             of estimates on corporate earnings have been wide
its importance to renewed economic growth, and will
                                                             and volatile but have largely surprised to the upside.
continue to strongly influence the direction of stocks.
                                                             Aggregate estimates for S&P 500 earnings per share
Despite the importance of the pandemic toward                in 2020 have moved from $176 to begin the year, to
future equity performance, there are other risks worth       $125 at the end of the second quarter, to $131 currently.
monitoring that potentially heighten market volatility       However, 2021 estimates have emerged as the more
– the November U.S. elections, fiscal stimulus mistakes,     important factor in valuation; the range of forecasts
and a flaring of U.S./China geopolitical tension. Ahead      remains wide but has narrowed and risen as economic
of the November U.S. elections, campaign rhetoric has        and corporate recoveries have proven more resilient
intensified and led to predictions of market doom if         than expected. As of the end of September, the
one candidate or another wins the race for the White         consensus 2021 S&P 500 EPS estimate stood at $165 –
House; historical data suggests that U.S. large cap          importantly for market sentiment, this figure is above
equities are not driven by the party occupying the           2019’s $161. We believe that it is safe to assume that the

                                                                                                                          5
level of economic activity and earnings will be higher ASSET ALLOCATION AND INTERNAL STRATEGIES
in 2021 than in 2020, barring a second wave of the
As we’ve previously discussed, several client portfolios
virus resulting in a generalized lockdown of economic
have deviated from longer-term strategic weightings
activity or a policy error.
due to the extreme volatility in investment markets
Likewise, in addition to various earnings outcomes, and deviations of performance in various asset
we must contemplate a wider range of valuation classes. In these instances, we continue to prudently
considerations. Over the last twenty-five years, the rebalance, which involves selling asset classes that
average P/E multiple on next-twelve-month S&P 500 have outperformed and buying those that have
EPS has been 16.4x. While the current P/E multiple underperformed. During the third quarter, we made
of 2021 estimated earnings currently stands well above a few tactical changes in terms of asset allocations;
average, it is important to consider that stock prices due to interest rate expectations and anticipation
are ultimately a function of future earnings and interest of continued U.S. large cap growth outperformance,
rates, and the absolute low levels of U.S. Treasury rates FSP reduced both passive U.S. mid-cap equity and
suggests a higher P/E multiple is justified. passive S&P 500 index exposure and added to the
existing passive position in the NASDAQ 100 QQQ
ETF. Proceeds from the passive mid and large-cap
reductions will also be allocated to an additional
emerging markets manager when appropriate. While
we made these moves from a long-term perspective,
early returns have been promising. We continue to
maintain a slight bias toward growth over value and
domestic over international equities.
In internally-managed portfolios, we continue to
focus on companies with truly advantaged business
models and longer-term secular opportunities, making
changes in accordance with the style, risk, and reward
6objectives for each individual strategy. We continue to design, we manage concentrated equity portfolios. In
believe that advantaged companies with strong balance addition, we own positions in each of the five largest
sheets, high free cash flow generation, and the capital weightings in various portfolios, as we currently
flexibility to navigate this unique period will emerge as believe each represents the pinnacle of an advantaged
stronger competitors over the longer term. business with sustainable longer-term opportunities.
While there are notable differences between the five
Much has been written about the concentration of
companies, each shares a number of similarities –
performance in a relatively small number of stocks,
namely, asset light business models with a significant
and acronyms like “FANG” have become important
component of sticky, service-oriented revenues, strong
parts of the investment lexicon. Currently, the five
balance sheets, and high switching costs.
largest names in the S&P 500 – Apple, Microsoft,
Amazon, Alphabet (Google), and Facebook – comprise The first three quarters of 2020 have been historic with
nearly 23% of the index’s total market value; this unprecedented economic and investment volatility,
compares with 11.6% at the end of 2013 and represents and we understand the impact that such activity can
the highest level of concentration in five companies place on investor anxiety. We are always available for
since 1977 (IBM, General Electric, General Motors, questions and concerns, and welcome the opportunity
AT&T, Exxon). While we are mindful of the dangers of to discuss markets and individual holdings. We thank
excessively consensus thinking, we are not necessarily you for your continued confidence.
troubled by the idea of large positions as, by our own
7DISCLOSURES
This market update is not to be construed as an offering or intended as a recommendation to buy or sell securities and is being provided for
informational purposes only. These points represent the opinions of the author, and, as such, should not be construed as investment advice. The
information is current as of the date of this market update and is subject to change at any time based on market and other conditions. The accuracy
of information received from third parties, although taken from reliable sources, cannot be guaranteed.
Results shown are purely historical and are no indication of future performance. Past performance is not intended to be, and is not to be construed
as, an indication of likely future results and should be only one of several factors when engaging an investment manager. Index performance is
intended to illustrate historical market trends and is provided solely as representative of the general market performance for the same period of
time. Indices are unmanaged, may not include the reinvestment of income or short positions, and do not incur investment management fees. An
investor is unable to invest in an index.
Investing involves risk. You should understand the risks of a proposed investment and consider the degree of risk you wish to tolerate before
investing. It should not be assumed that the investment strategies discussed were or will be profitable. The specific securities identified in this
presentation are shown for illustrative purposes only and should not be considered a recommendation by Franklin Street to buy or sell a particular
security. It should not be assumed that investments in these securities were or will be profitable. The securities may or may not be held or have been
bought or sold in a portfolio. Actual holdings will vary depending on the size of an account, cash flows within an account, and restrictions on an
account. Portfolio holdings are subject to change daily.
Franklin Street Partners is a dba for Franklin Street Advisors, Inc. (FSA), which includes references to our former parent entity, Franklin Street
Partners, Inc. (FSP). FSA is a wholly-owned, indirect subsidiary of Fifth Third Bank, National Association and Fifth Third Bancorp. FSA is an
investment advisor registered with the U.S. Securities and Exchange Commission (SEC) under the Investment Advisers Act of 1940. Registration
as an investment adviser does not imply any level of skill or training. Additional information about the advisory services offered by FSA is available
upon request and also on the SEC’s website at www.advisorinfo.sec.gov.
8You can also read