Estimating the rate of spread of Olive Quick Decline Syndrome, caused by Xylella fastidiosa ssp. pauca, in Puglia - April 30, 2021, Lia Hemerik - EFSA
←
→
Page content transcription
If your browser does not render page correctly, please read the page content below

Estimating the rate of spread of Olive Quick Decline
Syndrome, caused by Xylella fastidiosa ssp. pauca, in Puglia

 April 30, 2021, Lia Hemerik
 David Kottelenberg, Maria Saponari, Wopke van der Werf
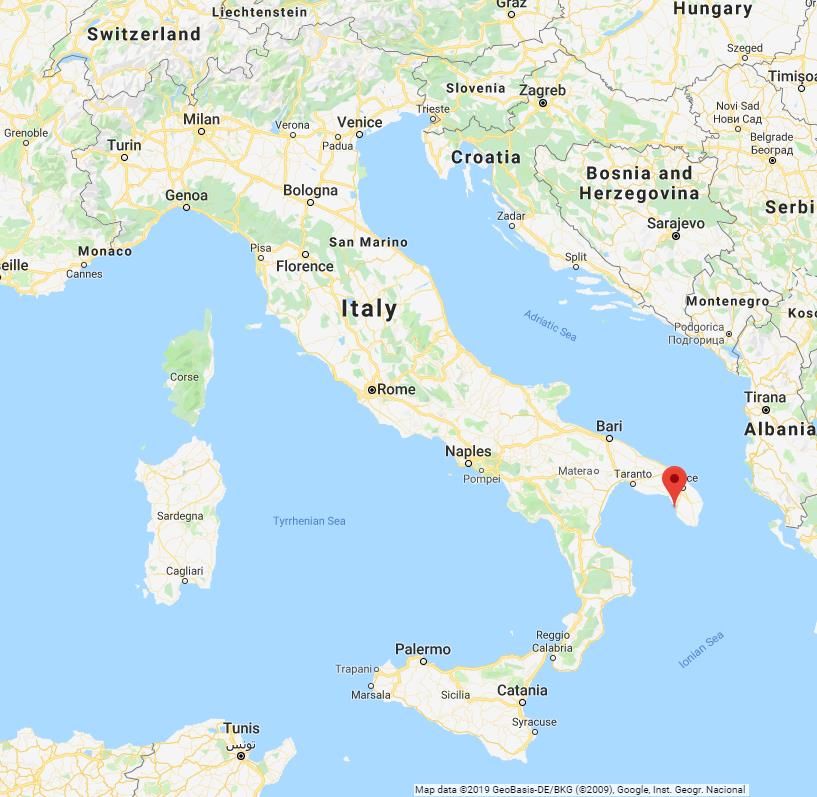
Spreading of X. fastidiosa into Italy

 o In 2000 an epidemic of PD occurred in
 the United States in southern California
 o Spread by an invasive species of
 sharpshooters
 o In 2013 X. fastidiosa was first identified
 in Europe in Gallipoli (Apulia, Italy)
 o Subspecies pauca
 o Causing olive quick decline
 syndrome (OQDS)
 Location of Gallipoli
 Map data ©2019 GeoBasis-DE/BKG (©2009). Google Inst. Geogr. Nacional

 1
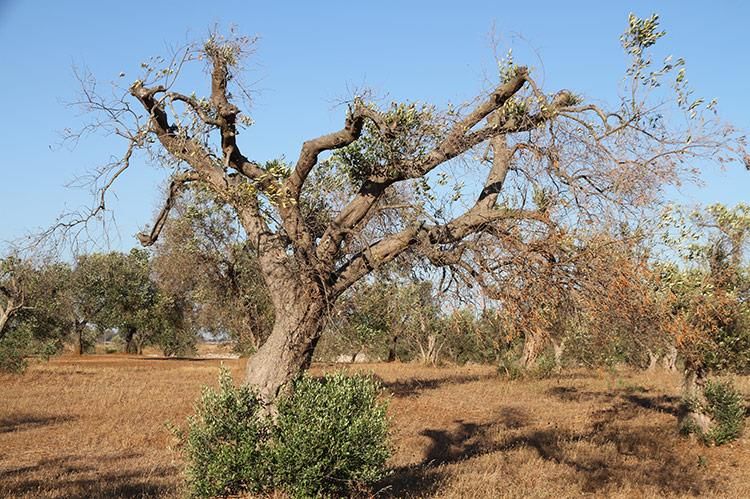
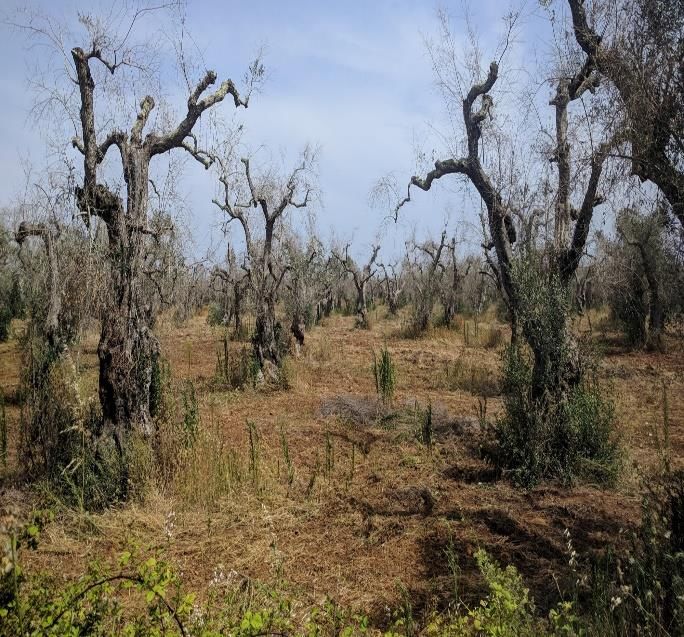
Olive Quick Decline Syndrome (OQDS)

o Leaf scorching

o Desiccation of twigs and branches

o After a few years, the tree dies

o Large economic losses
 o Olive and olive oil are main sources
 of income for the region
 o No export of plants
o Cultural impact
 o Family orchards
 Olive tree suffering from OQDS
 o Centuries old trees

 2
Vector: Spittlebug (Philaenus spumarius)

o Can be found throughout most of Europe

o Can survive in many climate types

o Female migrating behavior and dispersal
 cause short range spread of X. fastidiosa

o Possibly hides in clothing or vehicles,
 causing long range spread of X. fastidiosa
 Spittlebug

 © Helen Macky

 3
 Taken from www.terrain.net.nz/friends-of-te-henui-group/local-insects/spittle-bugs.html

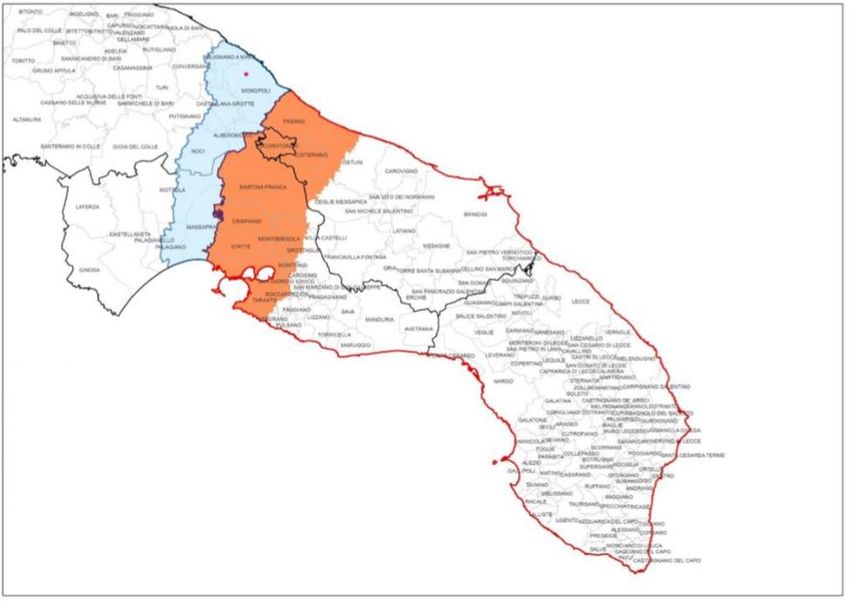
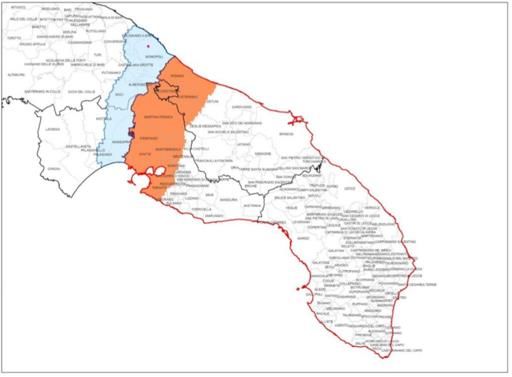
Models

o Many models have been developed
 o Spatially explicit spread model (White et
 al., 2017)
 o SIR model (Soubeyrand et al., 2018)
 o Network model (Strona, Carstens &
 Beck, 2017)
o No models analyzing the shape of the
 invasion front or rate of spread
 Demarcated zones in Puglia, Italy (European Union, 2019).
 o Even though data is available
o Expert knowledge before study: in one year time 90% of newly
 infected plants will be within 5.2 km from previously infected area
 (95% CI of 0.7 – 14 km)

 4
Sampling data

o Spatio-temporal data available from 2013 - 2018
o Very heterogeneous sampling in space and time
o Until 2016, no clear sampling strategy

 2013 2014 2015

 Locations of sampling in Puglia

 2016 2017 2018

 (km)
 5

Research questions and Data

 o What is the shape of the travelling invasion front of Xylella
 fastidiosa in Puglia?
 o What is the rate at which this front moves through Puglia?
 o What is the width of the front?
o The columns
 o no: number, lon: longitude, lat: latitude
 o Result
 o0: Xylella is absent (these I call negatives)
 o1: Xylella is present (these I call positives)
 o Date, Year, Month

o 409,515 rows
 o 298,230 rows after removal of NA’s and missing
 coordinates

 6
Methods: Rate of Spread

o Eight datasets (four types of information sharing & two
 temporal cut-offs)

o Data transformation: Adapted from Kloch & Krynski, 2008.

 Concentric circles around a central
Calculate for each calendar year or year from April to point with 1 km widths.

April, and in each concentric ring
 o number of positives,
 o number of measurements,
 o proportion of positives (= number of positives /
 number of measurements)

 The transformed data. Showing the first 10 rows of the
 2013 data frame.
 7
Data and models
Deterministic models Stochastic models
Negative exponential (NE): Binomial distribution: 1 , , =
 1 = exp(− )
 (1 − ) −

Logistic function:
 1 Mean:
 2 = Deviance: (1 − )
 1 + exp( − 50 )

Constrained negative exponential function (CNE): Beta-binomial distribution: 2 | , θ =
 Γ(θ) ! Γ( + θ)Γ( − +(1− )θ)
 1 if < 100 , Γ( θ)Γ((1− )θ) ! − ! Γ( +θ)
 3 = ൞ 1
 exp(− ) if ≥ 100 .
 exp(− ( 100 )) Mean:
 −1
 Deviance: 1 − 1+
Hill function: −1

 4 = 1 −
 ℎ +

 8
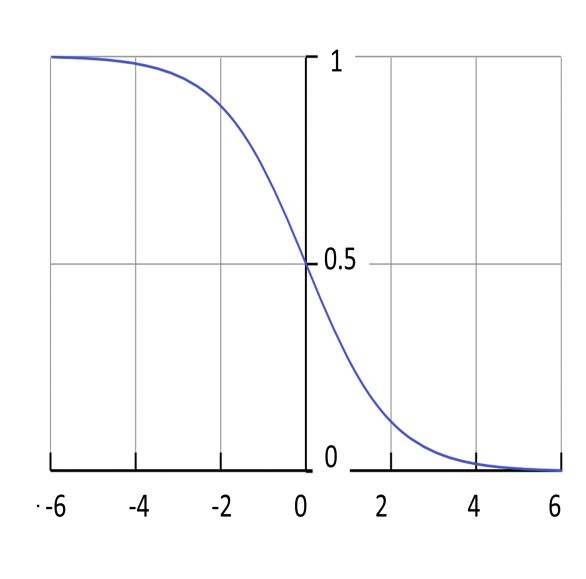
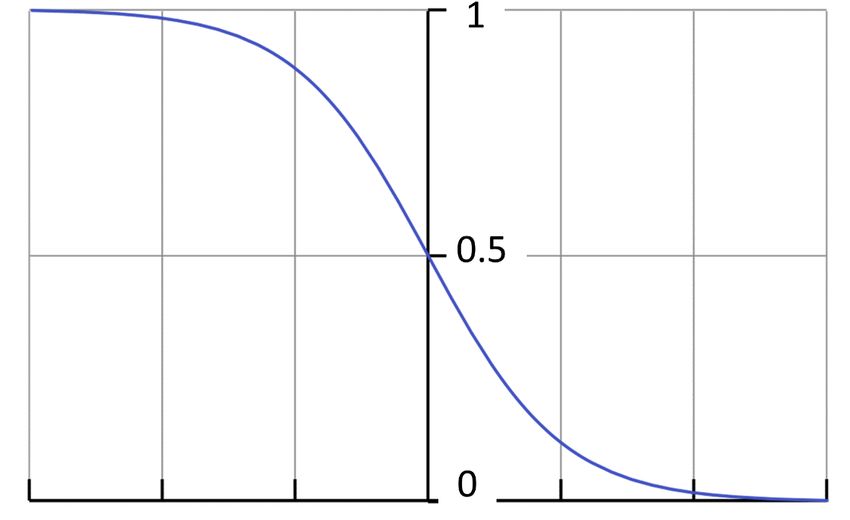
Binomial distribution Beta-binomial distribution

Results Year
 Negative
 exponential
 Logistic CNE Hill Negative
 exponential
 Logistic CNE Hill

 2013 159 159 159 159 78 78 78 80
 2014 344 344 344 356 232 232 232 232
 AIC 2015 8853 8847 8847 8133 457 457 457 459
 2016 587 239 239 265 221 139 145 141
 2017 4673 4442 4442 4612 334 334 334 327
 2018 87 87 87 90 108 77 77 78
 Total 14703 17227 14169 13603 1430 1317 1323 1317

 The fitted logistic, CNE, and Hill functions for each calendar year.
 9
Determining the rate of spread

 ▪ Logistic function: = 1+ exp( −( 50+ )) 1
 : rate of spread in km/year
 : time in years since 2013
 Assumption:
 The rate of spread and the shape of the front are constant over the years

 Parameters
 r 0.059 km -1
 x50 -25.76 km
 c 9.95
 km/year

The fitted logistic curves to estimate the rate of spread.

 10
Width of front

 Starting with
0.95
 = .
 + − +

 = .
 + − +
0.05
 We get ( )
 − =

 width

Resulting in an estimate of 5− 95= 99.8 km.

 1− 99= 2log (99)/0.059=155.8 km.

 11
Discussion

o First analysis that estimates the shape of an invasion front
o Non-trivial task because of the difficult data
o Because of this we have simulated the sampling process
o and performed simulations with different assumed points of origin

o First empirical estimate of the rate of spread of an X. fastidiosa invasion in
 Europe 10 km per year (95% CI 7.5-12.5 km per year)
o The width of the front is 100 to 160 km
o This knowledge on the spread of X. fastidiosa can aid management
 decisions in controlling the disease

 Kottelenberg D., L. Hemerik, M. Saponari, W. van der Werf (2021)
 Scientific Reports11:1061 https://doi.org/10.1038/s41598-020-79279-x
 12
Thanks to David Kottelenberg, Maria

Saponari and Wopke van der Werf

Thank you for your
attention!
You can also read