Examination of permittivity for depolarization field of ferroelectric by ab initio calculation, suggesting hidden mechanisms - Nature
←
→
Page content transcription
If your browser does not render page correctly, please read the page content below
www.nature.com/scientificreports
OPEN Examination of permittivity
for depolarization field
of ferroelectric by ab initio
calculation, suggesting hidden
mechanisms
Yukio Watanabe
Electrostatics of depolarization field Ed in relation to the polarization is studied. In particular,
the value of permittivity for Ed (εd) in prototypical situations of ferroelectrics, including Mehta
formula, is examined by ab initio calculations. By using spontaneous polarization PS corresponding
to accurate experiment ones, we show εd = 1, which suggests that the results of εd ≫ 1 indicate
hidden mechanisms; εd = 1 suggests that the effect of Ed is significant to induce intriguing important
phenomena overlooked by εd ≫ 1. A bridge between εd = 1 and εd ≫ 1, i.e. the consistency of εd = 1
with conventional results is presented. The exact electrostatic equality of head-to-head–tail-to-tail
domains to free-standing ferroelectrics is deduced. Hence, most stoichiometric clean freestanding
monodomain ferroelectrics and head-to-head–tail-to-tail domains are shown unstable regardless
of size, unless partially metallic. This verifies the previous results in a transparent manner. This
conclusion is shown consistent with a recent hyperferroelectric LiBeSb and “freestanding” monolayer
ferroelectrics, of which origin is suggested to be adsorbates. In addition, this restriction is suggested
to break in externally strained ultrathin ferroelectrics. The macroscopic formulas of Ed are found valid
down to a several unit-cells, when electronic and atomic-scale surface effects are unimportant and
accurate PS is used.
Ferroelectrics (FEs) have reversible spontaneous polarization PS that is useful in various applications, for which
high insulativity is desired. Therefore, ideal insulativity of FE is assumed in most studies. In such high insulativity
charge − ∇·PS originating from inhomogeneity or the existence of surface; For a homogeneous PS, Ed disappears
FEs, the depolarization field Ed exists universally even in the absence of external electric field Eext, owing to the
for infinite FE without surface or FE with no surface effect and ideal metal electrodes.
Although analytical formulas of Ed are unnecessary in ab initio calculations, they are indispensable for non
ab initio examinations of PS configurations, stability of domains, and critical thicknesses of F Es1–17. These for-
mulas use the permittivity for Ed (εd), of which difference affects critically the results. No controversy exists for
εd = εf used in combination with an initial PS that is an ideal bulk PS for no macroscopic field in FE as in Kittel
models1,2. Here, εf is static linear permittivity εr of FE. Otherwise, the choice of εd is controversial.
Because the polarization P under Eext is P = PS + (εf − 1)ε0Eext (ε0: vacuum permittivity) and the permittivity of
FE under Ed is still εf ≫ 1 (“Results”), the standard choice of εd is εf4–10,16,17. We define accurate PS as PS obtained
by accurate experiments of ideal samples; Accurate PS can be obtained from ion and electron distribution, e.g.
by transmission electron microscopy TEM. When a FE is homogeneous or single-domained, accurate PS can be
obtained by standard electrical measurements (“Results”). An alternate description of accurate PS is that PS is a
total polarization under the influence of Ed and Eext = 0.
Examples of εd = εf are followings, which are for single domain homogeneous FEs. In this paragraph, “experi-
mental” PS refers to PS of each specific sample, which is obtain by the measurements of that sample or is PS of
similar samples. Mehta et al.4 studied Ed in capacitors, using experimental εd = εf = 1000 and PS = 10 μC/cm2
obtained from the saturated polarization of thin film capacitors. Black et al.5 studied Ed of thin film capacitors,
using experimental εd = εf = 350 obtained from the polarization-hysteresis near saturation and PS obtained from
the saturated polarization. Zhao et al.6 estimated Ed of poly-vinylidenefluoride–trifluoroethylene [P(VDF–TrFE)]
Kyushu University, Fukuoka, Japan. email: watanabe@phys.kyushu‑u.ac.jp
Scientific Reports | (2021) 11:2155 | https://doi.org/10.1038/s41598-021-81237-0 1
Vol.:(0123456789)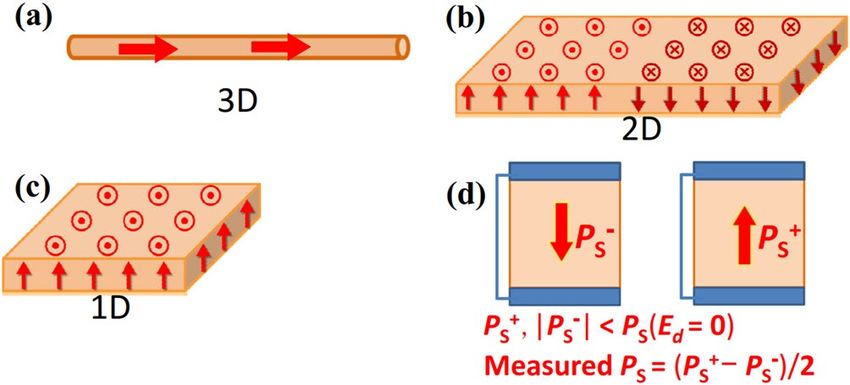
www.nature.com/scientificreports/
thin films by using Ed = − PS/εfε0 with PS from remnant polarization measurements (7 μC/cm2) and εd = εf = 10.
In the electrostatic study of Tian et al.7, Ed in BiFeO3 thin films was estimated by using εf = 60 (in Eq. (1) of
Ref.7), where this P is initially a total polarization of a single domain state. Kim et al.8 estimated Ed in BaTiO3
(BTO) ultrathin films through the formula by M ehta4 with the experimental remnant P obtained from pulse
train methods and εd = εf = 80 from εf − Eext curves. In the Ginzburg–Landau–Devonshire (GLD) theory of BTO
ultrathin films by Jo et al.9, Ed was given through the Mehta f ormula4 with the same P as P in the GLD equation
and εd = εf = 80 of Ref.8, where P in GLD theory is the total polarization. Schroeder et al.10 estimated Ed in HfO2
and PZT ultrathin films through the Mehta formula4 with experimental PS and εd = εf = 20–300. Similar analyses
with εd = εf ≫ 1 are frequently employed16,17.
Contrastingly, a primitive considerations show εd = 1 for PS, i.e. a total PS (≡ P(Ef(Eext = 0)))13, where Ef is the
total macroscopic electric filed in FE. For freestanding FEs, for example, Ef(Eext) = Eext − P(Ef(Eext))/ε0 or Ef(Eext)
= Eext/εf − P(Ef(Eext = 0))/ε0 (“Results”). This implies that εd = εf4–10,16,17 may be double counting, while we note that
the electrical measurements of PS4–10,16,17 are indirect measurements based on induced charge per area in elec-
trodes Q. If εd = 1 is correct, the successes of the analyses using εd = εf are attributed to inappropriate parameters
or unidentified screening mechanisms.
We think that the existence of this controversy on εd is due to explanations based on macroscopic quantities.
Because macroscopic explanations are abstract, they are unsuitable to bridge the gap between two conflicting
views of εd. On the other hand, ab initio estimation of εd is considered as the clearest method for this problem
but is not reported to our knowledge. Hence, we clarify εd in the formulas of Ed, by ab initio simulations in which
ab initio PS is exactly P(Ef(Eext = 0)), which is considered as PS obtained by accurate experiments of ideal samples.
Here, the standard theoretical assumptions: pure, stoichiometric, clean FEs are used.
Ed is related to fundamental issues such as stability of monodomains, critical thicknesses of FE, and the emer-
gence of ferroelectricity in superlattices. Some of these subjects require the consideration of other effects such as
strain-induced FE and electronic effect at electrodes11. To avoid the complexity, we concentrate on free-standing
insulating FE and its electrostatic identicals, i.e. head-to-head–tail-to-tail (HH–TT) domains. Thus, we estimate
the value of εd in the formula of Ed in a clear manner.
As expected from the electronic interaction at the e lectrode11, it may be argued that the formula of Ed based
on electrostatics is not possible for nm-FEs. We resolve this by focusing on the formulas of Ed and using ab initio
PS in the formulas. Therefore, PS in these formulas contains the effects of the interactions in slabs or superlattices,
whereas the absence of these effects in conventional studies has limited the applicability. The use of nonlinear εf
is often better than linear εf but can be approximated by an average linear εf12. Therefore, the conclusions below
are applicable also to the nonlinear εf (≫ 1).
Model
For simplicity, we discuss 1-dimensional (1D) cases with Eext = 0, where FEs with thickness lf are in periodic slabs
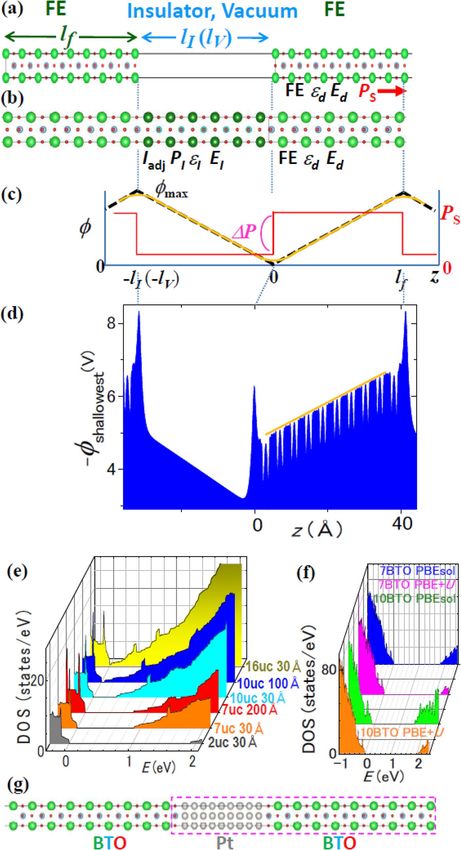
(Fig. 1). Here, 1D refers not to the shape of object (Fig. 2) but to the case where all the properties change only along
one coordinate; Fig. 1a,b show FE in vacuum with thickness lV and FE/paraelectric (Iadj) superlattice, respectively,
while the latter mimics an inhomogeneous FE. Iadj stands for both vacuum and insulator, which is dielectric or
FE having different PS. The polarization, thickness, and permittivity of Iadj are PI, lI, and εI, respectively, and the
thickness of slab is lSC = lf + lI (lV). The angles of the polarization P of FE and Iadj to the slab direction are θ and
θI, respectively.
The macroscopic and atomic electrostatic potential (ϕ) of these models are represented by Fig. 1c,d, respec-
tively. ab initio Ed (Edab initio) was obtained from the envelope of the peak tops of atomic electrostatic potential,
of which example is Fig. 1d. All these FE/vacuum and FE/paraelectric exhibited the density of states (DOS) of
insulators (Fig. 1e,f). Additionally, B aTiO3 (BTO) capacitors are examined, where metal layers are standard
electrode materials for FEs: S rRuO3 or Pt and ~ 20 Å (Fig. 1g).
Accurate estimation of PS is indispensable for estimating Ed correctly and achieved by direct Berry phase
calculations. To enable these calculations, we designed special FE slabs and procedures described in “Meth-
ods”. This is because stable 1D-FEs in vacuum are metallic14,15 and, hence, direct Berry phase calculations are
not possible; Even a two unit-cell thick (~ 8 Å) BTO in vacuum is metallic, when FE is enforced18. To achieve
insulativity, we used tetragonal (P4mm) SrTiO3 (STO) of which a-axis lattice constant increased by 0.5% and
decreased by 0.01% from that of the theoretical cubic phase. For these a-axis lattice constants, bulk STO was FE19.
We refer to them as STO1.005 and STO.9999, respectively, of which bulk PS’s were 3.56 μC/cm2 and 6.15 μC/
cm2, respectively, by V ASP19–28.
Macroscopic equations of Ed are obtained in a following manner. The normal component of P of FE (P⊥)
under Ed is P⊥ = PS cos θ + (εd − 1) ε0Ed in standard a pproaches4–10,16,17. The equation of continuity of electric flux
is PScos θ + εdε0Ed = PI cos θI + ε0EI, where EI is the macroscopic electric field in Iadj. The validity of this continu-
ity in the presence of peaks at the surfaces (Fig. 1d) is explained in “Methods”. The continuity of potential in a
periodic boundary condition yields EIlI = − Edlf (Fig. 1c). Therefore, we have for θ = 0
P − PI
Ed = − S
.
l (1)
ε0 εd + lfI
For θ ≠ 0 and θI ≠ 0, Eq. (1) is Ed = − (PS cos θ − PI cos θI)/ε0(εd + lf/lI). In the present study, PS and PI in Eq. (1)
are given by ab initio calculations that simultaneously yield Ed consistent with PS. Therefore, the only unknown
quantity is εd.
When PI = (εI − 1)ε0EI, Eq. (2) for θ = 0 is
Scientific Reports | (2021) 11:2155 | https://doi.org/10.1038/s41598-021-81237-0 2
Vol:.(1234567890)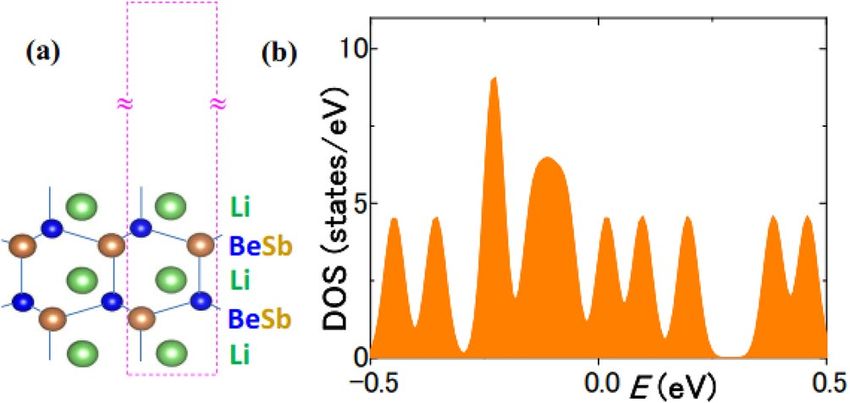
www.nature.com/scientificreports/

                                  inhomogeneous FE. (c) Macroscopic model. The minimum and maximum electrostatic potential ϕ are 0 and ϕmax, respectively. (d)
                                  Figure 1.  Atomic model of (a) FE/vacuum and (b) FE/Iadj, where FE is BTO and Iadj is STO. BTO/STO serves also as a mimic of an

                                  Example of estimation of Ed from the atomic − eϕ. The orange line shows the envelope yielding Ed. (e) Progressive development of 2D
                                  metallic layer: DOS of STO1.005/vacuum, where lf in unit-cells and lV in Å are shown on the right. 10-unit-cell-STO with lV = 100 Å is
                                  marginally insulating, while 16-unit-cell-STO with lV = 30 Å is metallic. The insulating slabs are used in Fig. 3. PS in the slab was typically
                                  1 μC/cm2. (f) DOS of 7 and 10-unit-cell BTO/5-unit-cell-STO calculated with PBEsol and PBE + U. (g) Atomic model of BTO/Pt.

Scientific Reports |   (2021) 11:2155 |                     https://doi.org/10.1038/s41598-021-81237-0                                                                         3

                                                                                                                                                                         Vol.:(0123456789)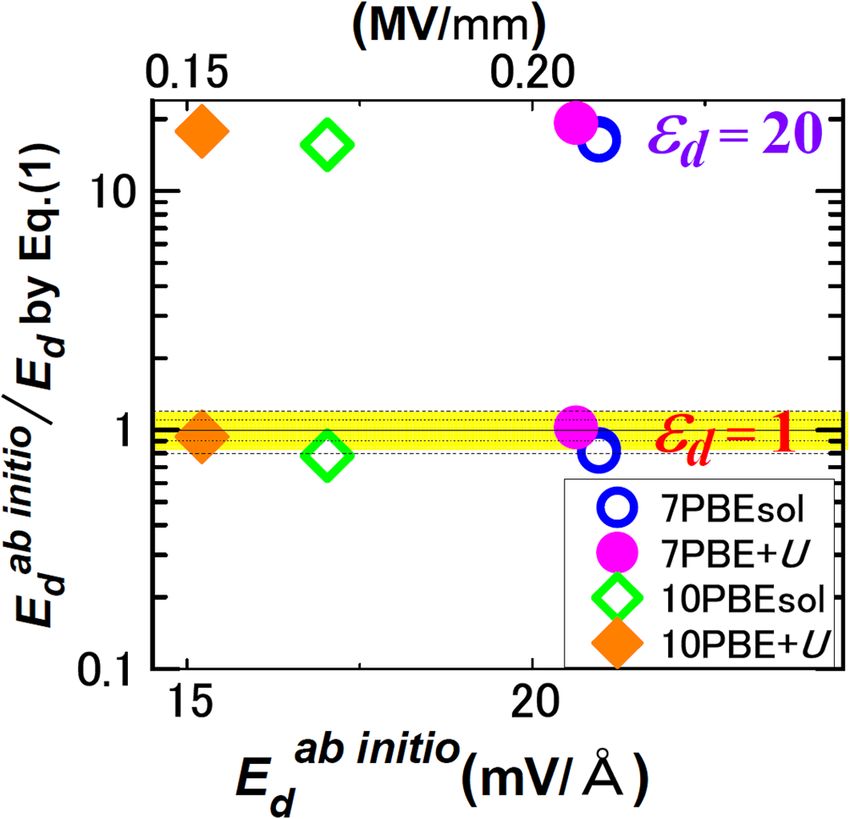
www.nature.com/scientificreports/
Figure 2. Definition of (a) three, (b) two, (c) one-dimensions for FE in this article. Dimensionality is not
referred to the shape of an object. θ is the angle between the normal to the surface in (c) and the direction
of PS. (d) Typical measurement of PS in a capacitor. This is smaller than bulk PS (Ed = 0), because of nonzero
screening length in electrodes.
P
Ed = − S
.
εI lf (2)
ε0 εd + lI
For θ ≠ 0 and θI ≠ 0, Eq. (2) is Ed = − PS cos θ/ε0(εd + εIlf/lI).
Equation (2) yields also Ed in FE capacitors, because equations of continuity of electric flux similar to the
above hold; A short-circuited FE capacitor is modelled as a perfect-metal/insulator(lI/2)/FE/insulator(lI/2)/
perfect-metal29, where the perfect metal refers to a metal with zero screening length and the thickness of each
screening layer λ is lI/2. Assuming PI = εIε0EI in screening layer, Eq. (2) is applicable and yields the Mehta f ormula4
with εd = εf and lI = 2λ. For FE capacitors with θ ≠ 0, the formula beneath Eq. (2) is applicable. Because we neglected
the electronic interactions at the metal/FE interface of 1–2 unit-cell, e.g. quantum mechanical s mearing30, the
formula for capacitors may be inaccurate for lf < several unit-cells.
The nominal FE thickness lf is the distance between the center position of a top ion and that of a bottom ion,
but twice of the atom radius ~ 0.5 Å × 2 should be added. In case of FE/vacuum, this correction was examined
by considering the smear-out of electrons into v acuum29; When λsmear (~ 0.8 Å) is the distance between an
outermost electron density and a center of ion position (“Methods”), FE thickness appropriate for electrostat-
ics is lfeff = lf + 2λsmear. As seen below, Eqs. (1) and (2) can be valid down to a few nm lf in case of FE/vacuum.
Additionally, surface buckling layer is electrostatically a dipole layer, and its net charge is zero. Therefore, even
in the presence of buckling layer, these formulas for 1D are also valid, by regarding buckling layer as dead layer
(“Methods”); The effective thickness is lfeff − 2lbuckle, where lbuckle is the thickness of a buckling layer ~ 1–2 unit-cells.
Results
Estimation of εd. εd was examined through the comparison of ab initio Ed with Ed of Eq. (1) or (2) that
uses different values of εd. For FE/vacuum (PI = 0), PS in Eq. (1) was the rigorously calculated PS of the slab by
Berry phase. For FE/insulators and FE capacitors, PS and PI in Eq. (2) were calculated ab initio. Therefore, all the
parameters in Eqs. (1) and (2) except for εd are accurately known.
Figure 3 compares Ed’s by Eq. (1) with Edab initio’s, where Eq. (1) uses εd = 1, 4. Here, εd = 4 is the lower bound
of electronic permittivity of STO29. Edab initio is accurate for a long lf, and data for lV ≫ lf reflects the effect of εd
explicitly because of Ed ~ − PS/ε0εd. Large symbols in Fig. 3 show the data points satisfying both conditions and,
hence, are important.
In Fig. 3, Eq. (1) with εd = 1 agrees with Edab initio within 10% always for λsmear = 0.8 Å and mostly for λsmear = c/2.
The difference between Ed’s for λsmear = 0.8 Å and = c/2 provides typical error bar and is approximately 10%. Equa-
Additionally, Eq. (1) yields the potential difference ϕmax =|Ed|lf = PS/ε0(εd/lf + 1/lV), which, with εd = 1, quantitatively
tion (1) with εd = 4 deviates from Edab initio’s by more than 140%, and the deviations increase monotonically with εd.
agrees with bandgap Eg that decreases with lf and lV in Fig. 1e.
For BTO/STO, Fig. 4 compares Ed’s by Eq. (1) with Edab initio’s, where Eq. (1) uses ab initio PS and ab initio PI.
For εd = 1, Eq. (1) agrees within ± 20% with Edab initio. In particular, the agreements are within ± 6% in the results by
PBE + U (a method of ab initio calculation (“Methods”)). Equation (2) with εd = 20 deviated by more than 1000%
from Edab initio. The deviation increased monotonically with εd, whereas εf > 20 is usual for inorganic FEs4,5,7–10,16,17.
For capacitors, Fig. 5a,b compare Ed by Eq. (2) with Edab initio, where Eq. (2) uses ab initio PS and lI/2εI ≈ 0.1 Å,
0.05 Å; Ed’s by Eq. (2) with εd = 1 agrees best with Edab initio’s. The disagreements of Eq. (2) with Edab initio’s increases
with εd. The differences between open and filled symbols provide typical error bar and are 10–20%. Consequently,
all the studied cases indicate εd = 1 (Figs. 3, 4, 5).
Bridge between εd = 1 and εf13. We showed εd = 1 and will use it below. By noting that electrical measure-
ments of PS are based on the change of charge per area in electrodes ΔQ induced by Eext, a bridge between εd = 1
and εd = εf will be shown. Because most studies4–10,16,17 are for FE capacitors, the followings are for 1D FE capaci-
tors with θ = 0, which can represent FE/vacuum for εI = 1 and freestanding FE for lI/εI ≫ lf.
Scientific Reports | (2021) 11:2155 | https://doi.org/10.1038/s41598-021-81237-0 4
Vol:.(1234567890)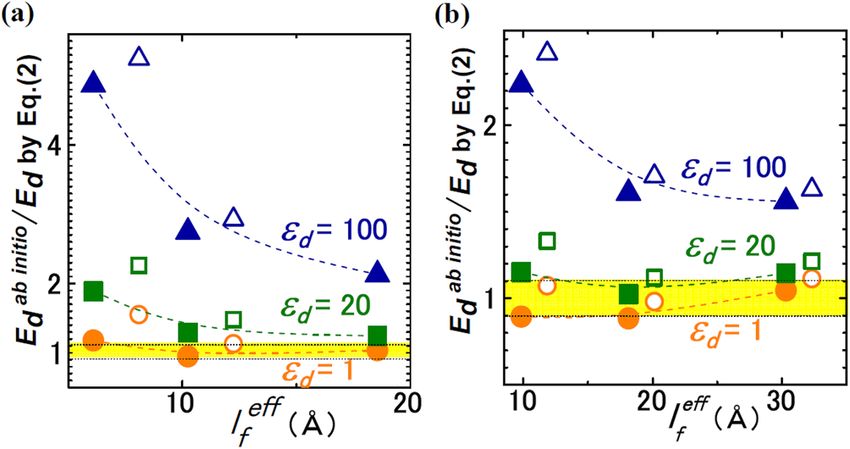
www.nature.com/scientificreports/

                                  Figure 3.  FE/vacuum. Comparison of Edab initio with Eq. (1) with εd = 1, 4 for STO1.005/vacuum and STO0.9999/
                                  vacuum. The yellow band shows the range of 1 ± 0.1. The filled and open symbols represent data in which
                                  lf in Eq. (2) is estimated with λsmear = 0.8 Å and λsmear = c/2, respectively. The shape of symbol indicates a
                                  slab structure: For STO1.005, orange circles, red triangles, light blue diamonds, and blue inverted triangles
                                  correspond to 7-unit-cell-STO with lV = 30 Å, 7-unit-cell-STO with lV = 200 Å, 10-unit-cell-STO with lV = 30 Å,
                                  and 10-unit-cell-STO with lV = 100 Å, respectively. For STO0.9999, red squares, green pentagons, and blue
                                  90°-rotated triangles correspond to 5-unit-cell-STO with lV = 300 Å, 6-unit-cell-STO with lV = 30 Å, and 7-unit-
                                  cell-STO with lV = 30 Å, respectively.

                                  Figure 4.  FE/paraelectric. Comparison of Edab initio with Eq. (1) with εd = 1, 20 for BTO/5-unit-cell-STO. The
                                  yellow band shows the range of 1 ± 0.2, and the dotted lines inside of the band show the range of 1 ± 0.1. Inset
                                  explains the BTO thickness lf in unit-cells and ab initio method (PBEsol or PBE + U).

Scientific Reports |   (2021) 11:2155 |                https://doi.org/10.1038/s41598-021-81237-0                                                    5

                                                                                                                                               Vol.:(0123456789)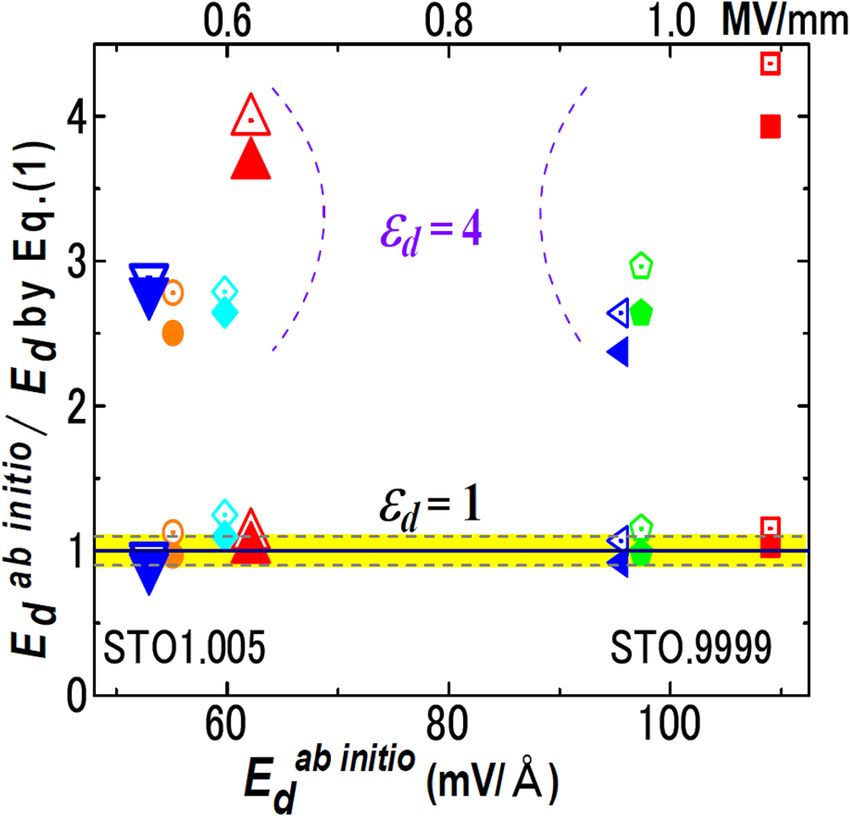
www.nature.com/scientificreports/
Figure 5. FE capacitor. Comparison of Edab initio with Eq. (2) with εd = 1 (orange), 20 (green), and 100 (blue)
for (a) BTO/SrRuO3 and (b) BTO/Pt. The filled and open symbols represent the data for lfeff = lT-B − ucBTO,
lT-B − 1.5ucBTO, respectively.
Using the total electric field in FE Ef and the total polarization of FE P, PS ≡ P(Ef(Eext = 0)) and Ed ≡ Ef(Eext = 0).
When the potential difference between the electrodes is V, Eq. (2) changes to Ef(V) = V/(lf + lI/εI) − P(Ef(Eext))
/ε0(1 + εIlf/lI)13. EI, the field in the screening layer of the electrode, is EI(V) = V/εI(lf + lI/εI) + P(Ef(Eext))lf/ε0lI(1 +
εIlf/lI).
Ef(V) can be written as Ef(E ext) = E ext + E d(Ef(E ext)), where E ext ≡ V/(lf + l I/ε I) (= V/lf for lf ≫ l I/ε I) and
Ed(Ef(Eext)) ≡ − P(Ef(Eext))/ε0(1 + εIlf/lI) similar to Eq. (2).
εf is defined by εf − 1 = {P(Ef(Eext)) − PS}/ε0(Ef(Eext) − Ed), where Ed = Ef(Eext = 0) = − PS/ε0 for lf ≫ lI/εI, and εf (≫ 1)
is linear for |Eext| ≪ |PS|/ε0. Hence, P(Ef(Eext)) = PS + (εf − 1)(ε0Ef(Eext) + PS) for lf ≫ lI/εI.
The substitution of this P(Ef(Eext)) in the expression of Ef(Eext) yields Ef(Eext) = Eext/εf − PS/ε0 for lI/εI ≫ lf (free-
standing), suggesting that the measured permittivity is εf.
We show an example: ΔQ = εIε0(EI(V) − EI(V = 0)) = V/(lf/εfε0 + lI/εIε0)13 from the above expression of EI(V). This
is equal to ΔQ = CV, where C = (Cf−1 + CI−1)−1 (Cf ≡ εfε0/lf, CI ≡ εIε0/lI) is a series capacitance per area. In particular,
for lf ≫ εflI/εI, ΔQ = εfε0V/lf = Cf V. Therefore, the permittivity of FE under Ed = Ef(Eext = 0) = − PS/ε0 is εf.
Additionally, Eq. (2) with εd = 1 shows D = PS − PS/(1 + εIlf/lI), while D = Q. Because lI/εI ~ 0.1 Å, the difference
between the real PS and the measured PS is detectable only for lf < 10 Å. As for potential difference, Eq. (2) is well
approximated by Ed = − PSlI/(εIε0lf) for lf > 10 Å, because lI/εI is short ~ 0.1 Å. Therefore, the potential difference
across the capacitor is independent of the FE thickness lf, when the quality of FE is independent of lf and FE is
ideally stoichiometric.
Discussions
Here, we discuss only monodomain FE (Fig. 2c).
Permittivity for non‑polarization field (built‑in field). Because the polarization P in standard GLD
theories9,31–34 are formulated with a single total polarization, εd = 1 should be used in standard GLD theories.
The preceding results have shown that the permittivity that expresses the change of P in response to Eext is εf
(≫ 1) even for FE under Ed. By the same logic, the change of P by built-in internal field Ebi is also expressed by
εf (≫ 1), where Ebi is not due to P or a dipole that is not expressed by P. Ebi exists in FEs by various mechanisms
such as the diffusion potentials at pn and Schottky junctions and chemical orders, e.g. LaAlO3 in the polar
catastrophe model.
For example, PS = 0 and Ed = 0 in a bulk cubic BTO. However, Ebi ≠ 0, when the surfaces of a cubic BTO slab are
asymmetrically terminated to form a dipole, e.g., BaO/TiO2/BaO/…/TiO2/BaO/TiO2. Hence, to achieve Ebi = 0,
the present study used chemically symmetric slabs (Fig. 1a,b,g), e.g. BaO/TiO2/BaO/…/TiO2/BaO.
Insulativity condition. For 1D-FE to remain insulating without artifactual screening, elf|Ed| < Eg (e: ele-
mentary charge), for which Eq. (2) and εd = 1 yield 1/lf > ePS cos θ/ε0Eg − εI/lI. Therefore, the condition of insula-
tivity is one of the followings
Eg ∗
lI ≤ 1.8ÅεI , (3)
PS∗ (TC )cos θ
−1
PS∗ (TC )cos θ
εI
lf < 1.8Å − 1.8Å , (4)
Eg ∗ lI
where Eg* and PS*(TC) are bulk Eg normalized by 2 eV and PS of bulk FE at TC normalized by 10 μC/cm2, respec-
tively, and the unit of lf and lV is Å. PS of bulk FE at TC approximates the critical PS of FE that is about to become
paraelectric by Ed12. Equations (3) and (4) explain the insulativity of FEs in Fig. 1e,f.
Scientific Reports | (2021) 11:2155 | https://doi.org/10.1038/s41598-021-81237-0 6
Vol:.(1234567890)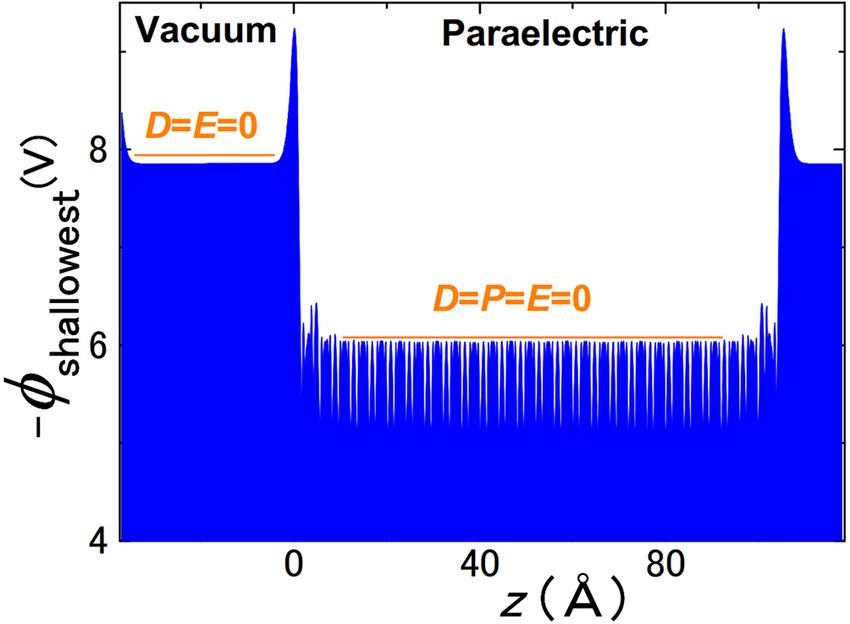
www.nature.com/scientificreports/
Figure 6. (a) Atomic model of LiBeSb/vacuum. (b) DOS showing metallicity of LiBeSb/vacuum.
Freestanding insulating FE and HH–TT. The giant permittivity and large piezoelectric coefficients of FE
are regarded as an electrical softness due to the tailing-effect of structural instabilities, i.e. phase transitions. This
suggests that these properties are incompatible with an extremely stable FEs. For freestanding FEs (lI = ∞, θ = 0),
Eq. (3) yields lf < 1.8 Å(Eg/2 eV)/(PS(TC)/10 μC/cm2). This suggests that freestanding FEs with normal bulk prop-
erties are FEs with metallic layer or insulating p araelectrics12,15 as explained by the following GLD analysis. This
conclusion is valid also for HH–TT domains with θ = 0.
Standard GLD theories are based on a single polarization vector P as the order parameter. We approximate the
polarization possibly missed in such GLD t heory29 by an extra permittivity εNG − 135,36, while εNG is speculatively
close to electronic permittivity29. The GLD energy F of an insulating FE is F = (T − T0)P2/2Cε0 + βP4/4 + γP6/4 − PEd
/2, where T0, C, β, γ, and θ are Curie–Weiss temperature, Curie constant, and GLD coefficients, respectively. The
effect of strain can be incorporated in T0 and β31–34,37. Curie temperature TC is T0 + ΔT, where ΔT = 3β2/16γCε0.
For 2nd order transition, γ = 0, β > 0, and TC = T0. The effect of Ed = − PS/ε0εNG is the change of T0 to T0 − C/εNG in
F, where Eq. (2) with εd = εNG and lI = ∞ is used.
Hence, the existence of freestanding FE that undergoes 2nd order FE transition is TC > C/εNG. This means
χGL < εNG/2 at T = 0, because χGL = C/2TC at T = 0. The total permittivity εf = χGL + εNG at T = 0 is < 3εNG/2 and < 7.5
for εNG = 529.
Similarly, for FE undergoing 1st order FE transition, it is known that χGL = 1/{(T − T0)/Cε0 + 3βP2 + 5γP4}
ε0 at T < TC. Stable state satisfies ∂F/∂P = (T − T0)/Cε0 + βP2 + γP4 = 0. Therefore, χGL = 1/(4T0/Cε0 − 2βP2)ε0 < C/
4T0 at T = 0 (We assume T0 > 0), and TC = T0 + ΔT = T0 + 3β2/16γCε0. Because ΔT ≪ T0 in almost all FEs2, 31–34,
we may assume TC < 2T0. Under this assumption, χGL < C/2TC at T = 0, and C < εNGTC means χGL < εNG/2 at T = 0.
εf = χGL + εNG < 3εNG/2 at T = 0, which is < 7.5 for εNG = 5.
These εf’s of FEs undergoing 2nd and 1st transitions appear too small for experimentally observed bulk
metal oxide FEs. Therefore, freestanding insulating FEs satisfying C < εNGTC are unlikely to exist, unless εNG is
far larger than 5; That is, for freestanding FE materials, there exists virtually one choice between a partial loss
of insulativity and a loss of FE.
Design of freestanding insulating FE. For freestanding insulating FE (θ = 0), C < εNGTC was shown,
while Δϕ ~ PS(Ed)lf/ε0. Therefore, FE materials having a very large εNG (≫ 5) can retain FE and remain insulating,
when ultrathin. Such FE materials are unlikely to exist. Alternatively, we may consider electrically freestanding FE
or FE with clean surface that is not mechanically freestanding. In this case, T0 (~ TC) of common FEs increases
to T0eff by inplane strain, while ab initio calculations shows that T0eff is much larger than those of standard GLD
theories37. Therefore, heavily strained FE materials may retain FE and remain insulating, when ultrathin (For-
mula estimating an effective T0 from ab initio PS is Ref. [88] of Ref.37). The above indicates that εf of such FE
is extremely low for Ed = 0 but can be large for Ed ≠ 0, because the coefficient of the first term GLD energy F is
(T − T0eff + C/εNG)/2Cε0 (freestanding).
LiBeSb. LiBeSb with P 63mc symmetry38 is reported as a hyper-FE that retains both FE and insulativity in FE/
paraelectric superlattices, which may contradict the above conclusion on insulativity and FE stability. Therefore,
we ab initio calculated one-unit-cell LiBeSb (lf = 6.08 Å) in vacuum (Fig. 6a). Figure 6b shows a metallic DOS
of LiBeSb for lV = 31.7 Å, while metallicity increases with lV. This is consistent with the above conclusion and
the previous reports14,15,39–41. Equations (3) and (4) explain the insulativity of L
iBeSb38 as the effect of adjacent
dielectric. Actually, similar to LiBeSb, BTO/STO superlattices are insulating as in Fig. 1f, while BTO/vacuum is
partially metallic18.
Freestanding and free‑surface FE: hidden mechanism. Mechanically freestanding FE is customar-
ily referred to as freestanding; Ji et al.42 reported exceptionally intriguing results of the freestanding insulating
BiFeO3 (BFO) that retains FE down to monolayer. This appears to contradict both the reports of metallicity
at HH–TT domains of BFO and the present results, esp. the single choice between insulating paraelectric and
partially metallic FE.
If εd = εf = 100, the potential difference Δϕ across freestanding insulating BFO of 1–4 unit-cell thickness with
a moderate PS ~ 20 μC/cm2 is 0.09–0.36 V by Eq. (2) with lI = ∞, which allows this BFO to be insulating in agree-
ment with Ji et al.42. For εd = 1, Δϕ increases by 100 times, by which BFO’s have to be partially metallic.
Scientific Reports | (2021) 11:2155 | https://doi.org/10.1038/s41598-021-81237-0 7
Vol.:(0123456789)www.nature.com/scientificreports/
Figure 7. Ab initio electrostatic potential ϕ of paraelectric insulating BTO in vacuum showing peaks due to
ion positions are fully relaxed, and the insulting paraelectric state is the lowest energy state. ϕ = 0 in FE means
surface dipoles formed by electron smear-out and buckling. In this calculation of 26.5 unit-cell-BTO slab, all the
Ed = 0, for which Eq. (2) suggests PS = 0. PS = 0 is also directly confirmed by ab initio calculations. Similarly, Ed = 0
in vacuum. Therefore, D = 0 in FE and vacuum.
Hence, we shall look at the measurements of Ji et al.42. For freestanding FE, it was shown that the surface or
boundary of 1 ~ 2 unit-cell thickness was metal and the rest was insulating FE14,15,39,40. So, the metallicity is detect-
able only by inplane conductance, which is absent in Ji et al.42. Second, because the crystallographic properties of
FE with these metal layers was shown to be those of F E14,15,39,40, the crystallographic measurements of Ji et al.42
do not exclude metallic layers. Third, because piezoelectric measurements use bottom and top electrode (or tip)
and may move i ons43, those by Ji et al.42 are not that of freestanding FE. Consequently, all the measurements of
Ji et al.42 do not contradict the conclusion of the present paper.
More importantly, the interdisciplinarity of nano FE hides true mechanisms. In the present case, “freestand-
ing” is defined by surface science and electrostatics. For example, Fong et al. found monodomain FE of 3 unit-
cell thickness as opposed to Ed-limited domain and size effect, which was later attributed to a dsorbates44. This
was covered by adsorbates even in ultrahigh vacuum (UHV)46. Actually, the free surface with PS ⊥ surface is
agrees with recent ab initio s tudy45. Further, photoemission spectroscopy in UHV showed that S rTiO3 surface
insulator-like in air and metallic in UHV when c leaned14. Because the insulating freestanding F E42 was exposed
to air and water, we suggest adsorbates as its hidden mechanism.
Conclusion
We studied the electrostatics of Ed, especially, the value of permittivity εd in the formula of Ed by ab initio
simulations, where ab initio PS corresponded accurately to experimental PS. For this, the standard theoretical
assumptions: pure, insulating, stoichiometric, and clean FEs were used. To validate the analyses of Ed based on
electrostatics, we concentrated on the formulas of Ed for accurate ab initio total P(Ef(Eext = 0)) that contained
various atomic effects and corresponded to experimental PS. Further, we focused on the simplest cases of Ed:
freestanding 1D-FE, HH–TT domains, and superlattices that mimicked inhomogeneous FE and FE/dielectric.
The present ab initio simulations showed εd = 1 ± 0.06–1 ± 0.2. That is, εd = 1 should be applied to experimental
and standard-GLD PS’s. A contradiction between εd = 1 and εd = εf was resolved by a bridge; Even under Ed, the
permittivity for Eext and built-in field Ebi was εf. Therefore, if a study requires εd ≫ 14–10,16,17, the value of PS is incor-
rect, the values of the parameters are inappropriate, or, most likely, hidden screening mechanisms e xist14,15,43–48.
For freestanding insulating FEs (lI = ∞), Eq. (2) yields Ed = − PS/ε0 (or Ed = − PScos θ/ε0), while, for HH–TT
insulating domains, Eq. (1) with PI = − PS and lI = lf yields the same Ed. Therefore, when the effects at surface of
1–2 unit-cell is unimportant, freestanding FEs are electrostatically exactly identical with HH–TT domains.
Consequently, both the electrostatic energy of Ed and the FE free energy of insulating freestanding and
HH–TT FEs scale linearly with lf. This implies that the stability of 1D-freestanding and HH–TT insulating FEs is
independent of size12,15, when the energy increase by surface effect and domain walls energy is ignored. A strain
effect to overcome this restriction was suggested.
Because lfPS/ε0 < Eg/e by εd = 1, the insulativity required an extremely small bulk PS ≪ 1 μC/cm2 or paraelec-
tricity (Fig. 7). Alternatively, the stability of 1D-freestanding and HH–TT FEs for of (θ ≈ 0) required a partially
metallic FE. This conclusion verified the previous results14–16, 39–41 in a material-independent manner and was
confirmed also for hyper-FE LiBeSb that was reported to be insulating in FE/paraelectric38. This conclusion
appeared inconsistent with “freestanding” monolayer B FO42. But, the examinations of experimental p rocedures42
suggested adsorbates as a hidden m echanism43–46.
The electrostatic formulas of Ed (Eqs. 1 and 2) were valid down to a several unit-cell scale (Figs. 3, 4, 5), when
atomic-scale surface effects, e.g. interactions with electrodes11,28 were unimportant. Even with buckling at FE
surfaces, these formulas can be valid by regarding buckling layers as dead layer.
Scientific Reports | (2021) 11:2155 | https://doi.org/10.1038/s41598-021-81237-0 8
Vol:.(1234567890)www.nature.com/scientificreports/
Methods
Ab initio calculations. In the examinations of FE/vacuum, the results of SrO-terminated STO slabs are
presented, because they have Eg wider than Eg of the TiO2-terminated STO slabs (Fig. 1e). To enforce FE, the
ion-positions in the STO/vacuum slabs were not optimized, because, otherwise, FE disappears (Fig. 7). There-
fore, the STO unit-cells in the slabs retained the ion positions of bulk STO1.005 or STO.9999. These calculations
of STO/vacuum were only for the examination of Ed and εd and do not correspond to standard experiments. PS
of STO1.005 in the slab was typically 1 μC/cm2.
The models of FE/paraelectric are BTO/STO superlattices. All the calculated forces were < 1 meV/Å after
geometry relaxation, and the a-axis lattice constant of STO was expanded by 1.1–1.3%. The bulk STOs that had
these a-axis lattice constants were paraelectric19. The a-lattice constant of BTO/SrRuO3 and BTO/Pt capacitor
was fixed at the theoretical a-axis lattice constant of cubic STO and bulk tetragonal BTO, respectively, and all
other ion positions were relaxed (Fig. 1g). The atomic models of BTO/SrRuO3 are similar to BTO/STO (Fig. 1b).
The use of the theoretical a-lattice constant of cubic STO corresponds to the thin films on STO substrates. The
surfaces of the BTO and S rRuO3 were TiO2 and SrO, respectively, and Pt atoms at the interface aligned with O
atoms of T iO2 plane.
The present study is about the formulas of Ed for given structure parameters. Here, the change of PS by the
interactions in the slabs is included consistently in these formulas by the use of ab initio PS in these formulas.
The ab initio calculations with V ASP20–22 used the projector augmented wave m ethod23 with a Monk-
horst–Pack24 mesh of 8 × 8 × 2 for slabs and an energy cutoff of 650 eV. PBEsol functional25 was used, unless
otherwise mentioned. Ab initio PS was calculated through Berry phase26. The results of BTO/STO were reexam-
ined with PBE f unctional27 with Hubbard U (PBE + U)28, which was used also for BTO/Pt. In the slab calculations,
graphic processing units a cceleration49,50 was used. The supercells were produced by VESTA51.
Accurate estimation of PS under Ed. For correct εd, accurate estimations of a total polarization PS under
Ed are essential. Because we compare Eqs. (1) and (2) using ab initio PS with Ed for the ion positions same as those
of this PS, the accuracy of PS for given ion positions matters.
Berry phase calculation of PS for given ion positions is accurate but only possible for insulators. For example,
the present Berry phase calculations yields PS of bulk B aTiO3 that agree with experimental PS within 4%, when
experimental ion positions and lattice constants of at 303 K are u sed37.
Therefore, to obtain accurate PS, the dipole moment of a whole slab was calculated with Berry phase; We
treated these slabs as unit-cells to apply Berry phase calculations directly, unlike conventional approaches. PS
was obtained by dividing the dipole moment by the volume of FE part of the slab. These PS’s were referred to
“rigorously calculated PS’s of the slab” and obtained for all the FE/vacuum and BTO/STO slabs. Here, STO1.005
and STO.9999 slabs are insulating, allowing accurate Berry phase calculations.
Additionally, PS of the unit-cell that possessed exactly the same ion positions as those in the slab was calcu-
lated with Berry phase and, then corrected with atomic polarization by Ed by the procedures in Ref.29. These PS’s
agree perfectly with “rigorously calculated PS’s of the slab”, which further confirmed the accuracy of the present
PS’s of FE/vacuum and BTO/STO. These corrected PS’s29 were used for capacitors. Therefore, in the present study,
PS’s are accurate total PS’s and self-consistent with Ed. Hence, PS’s in Figs. 3, 4 and 5 are accurate.
Validity of continuity of electric flux and surface dipoles. Equations (1) and (2) are applicable to the
regions much larger than unit-cell. Here, the peaks of 1.5 Å width at the surface in Fig. 1d may be suspected to
invalidate Eqs. (1) and (2). These peaks are due to effective surface dipoles caused by electron tunneling smear-
out; Surface electrons smear out in vacuum, making positive charge density inside the surface and negative
charge density in vacuum.
The heights and shape of the two peaks from the baseline (yellow line in Fig. 1d) are the same (1.53 V).
This means σ+R = σ+L and σ−R = σ−L as expected from their origin, where σ+R, σ−R, σ+L, and σ−L are positive and
negative charge densities that yield the right and left peak, respectively. Because of the charge neutrality of FE,
σ+R + σ+L + σ−R + σ−L = 0, i.e. σ−R + σ+R = 0. Therefore, the continuity of the electric fluxes DFE in FE and DI in Iadj
(Fig. 1b) is DFE − DI = σ−R + σ+R = 0, i.e. the continuity of electric flux DFE = DI, where DFE = PScos θ + εdε0Ed and
DI = PI cos θI + ε0EI. A clearer example is shown in Fig. 7, which evidently shows the continuity of electric flux
and, hence, validates the use of Eqs. (1) and (2).
Because surface buckling in vacuum is electrostatically dipole due to ion displacements, the arguments exactly
the same as the above hold. Therefore, the electric flux of the inside DFE and the outside DV of the buckling layer
is continuous (DFE = DV).
Effective lf (lfeff). For FE/vacuum, the effective lf (lfeff) was estimated from the planer averaged electron den-
sity ρ profiles29. Below, z = 0 corresponds to the position of bottom ion. Because ρ at z = − 0.8 Å was same as
the minimum ρ of inner part in all the ρ–z curves, the region of z = 0 ~ − 0.8 Å was considered as a part of FE
(λsmear = 0.8 Å), and lfeff was lfeff = lf + 2λsmear. In addition, λsmear = c/2 (half unit-cell) was also tested, and lV = lSC − lfeff.
For BTO/STO, lf was defined as the distance between the top and bottom Ti ions of BTO (Fig. 1b), and lI = lSC − lf.
For FE capacitors, lfeff was lT-B − ucBTO (outermost ions are Ti, u cBTO: length of a BTO unit-cell), for which the
quantum mechanical s mearing29 may be responsible. The estimations with lT-B − 1.5ucBTO were also tested. The
effective thicknesses of the screening layer, i.e. the effective passive layer lI/2εI of BTO/SrRuO3 and BTO/Pt were
estimated as 0.1 Å and approximately 0.05 Å, r espectively29.
Scientific Reports | (2021) 11:2155 | https://doi.org/10.1038/s41598-021-81237-0 9
Vol.:(0123456789)www.nature.com/scientificreports/
Data availability
The data required to reproduce these findings can be provided upon reasonable requests to the corresponding
author.
Received: 28 October 2020; Accepted: 1 January 2021
References
1. Kittel, C. Physical theory of ferromagnetic domains. Rev. Mod. Phys. 21, 541–583 (1949).
2. Kalinin, S. V. & Bonnell, D. Domain polarity and temperature induced potential inversion on the B aTiO3 (100) surface. J. Appl.
Phys. 91, 3816 (2002).
3. Batra, I. P., Wurfel, P. & Silverman, B. D. Phase transition, stability, and depolarization field in ferroelectric thin films. Phys. Rev.
B. 8, 3257–3265 (1973).
4. Mehta, R. R., Silverman, B. D. & Jacobs, J. T. Depolarization fields in thin ferroelectric films. J. Appl. Phys. 44, 3379–3385 (1973).
5. Black, C. T., Farrell, C. & Licata, T. J. Suppression of ferroelectric polarization by an adjustable depolarization field. Appl. Phys.
Lett. 71, 2041–2043 (1997).
6. Zhao, D. et al. Depolarization of multidomain ferroelectric materials. Nat. Commun. 10, 2547-1–11 (2019).
7. Tian, J. et al. Depolarization-field-induced retention loss in ferroelectric diodes. Phys. Rev. Appl. 11, 024058-1–15 (2019).
8. Kim, D. J. et al. Polarization relaxation induced by a depolarization field in ultrathin ferroelectric B aTiO3 capacitors. Phys. Rev.
Lett. 95, 237602-1–4 (2005).
9. Jo, J. Y., Kim, Y. S., Noh, T. W., Yoon, J.-G. & Song, T. K. Coercive fields in ultrathin BaTiO3 capacitors. Appl. Phys. Lett. 89, 232909-
1–3 (2006).
10. Schroeder, U., Lomenzo, P. D., Toriumi, A. & Mikolajick, T. Impact of depolarization fields on the ferroelectric switching behavior
in doped H fO2. Ext. Abst. Fundament. Phys. Ferroelectr. Relat. Mater. 2020, 21–22 (2020).
11. Polanco, M. A. M. et al. Stabilization of highly polarized P bTiO3 nanoscale capacitors due to in-plane symmetry breaking at the
interface. Phys. Rev. B 85, 214107-1–7 (2012).
12. Watanabe, Y. Proper permittivity for depolarization field in perfectly insulating ferroelectric and examination of background
permittivity. Ferroelectrics 461, 38–43 (2014).
13. Watanabe, Y. Proper permittivity for depolarization field and its implication to universal instability of insulating ferroelectric: A
note. J. Phys. Soc. Jpn. 79, 034713-1–5 (2010) (Especially, Eqs. (4)–(10)).
14. Watanabe, Y., Okano, M. & Masuda, A. Surface conduction on insulating B aTiO3 crystal suggesting an intrinsic surface electron
layer. Phys. Rev. Lett. 86, 332–335 (2001).
15. Watanabe, Y. Theoretical stability of the polarization in a thin semiconducting ferroelectric. Phys. Rev. B 57, 789–804 (1998).
16. Jiang, B. et al. Barium titanate at the nanoscale: Controlled synthesis and dielectric and ferroelectric properties. Chem. Soc. Rev.
48, 1194–1228 (2019).
17. You, W.-X. & Su, P. Depolarization field in ferroelectric nonvolatile memory considering minor loop operation. IEEE Electron
Device Lett. 40, 1415–1418 (2019).
18. Watanabe, Y. Electrostatics liberating restrictions on ferroelectric by unification of polar discontinuity e−h+ layers and criteria of
intrinsicality. Ferroelectrics 556, 29–36 (2020).
19. Watanabe, Y. Ferroelectricity of stress-free and strained pure S rTiO3 revealed by ab initio calculations with hybrid and density
functionals. Phys. Rev. B 99, 064107-1–14 (2019).
20. Kresse, G. & Hafner, J. Ab initio molecular dynamics for liquid metals. Phys. Rev. B 47, 558R (1993).
21. Kresse, G. & Joubert, D. From ultrasoft pseudopotentials to the projector augmented-wave method. Phys. Rev. B 59, 1758 (1999).
22. Kresse, G. & Furthmüller, J. Efficiency of ab-initio total energy calculations for metals and semiconductors using a plane-wave
basis set. J. Comput. Mater. Sci. 6, 15–50 (1996).
23. Blöchel, P. E. Projector augmented-wave method. Phys. Rev. B 50, 17953–17979 (1994).
24. Monkhorst, H. J. & Pack, J. D. Special points for Brillouin-zone integrations. Phys. Rev. B 13, 5188–5192 (1976).
25. Perdew, J. P. et al. Restoring the density-gradient expansion for exchange in solids and surfaces. Phys. Rev. Lett. 100, 136406-1–4
(2008).
26. Resta, R. Macroscopic polarization in crystalline dielectrics: the geometric phase approach. Rev. Mod. Phys. 66, 899–915 (1994).
27. Perdew, J. P., Burke, K. & Ernzerhof, M. Generalized gradient approximation made simple. Phys. Rev. Lett. 77, 3865–3868 (1996).
28. Liechtenstein, A. I., Anisimov, V. I. & Zaanen, J. Density-functional theory and strong interactions: Orbital ordering in Mott-
Hubbard insulators. Phys. Rev. B 52, 5467R-5470R (1995).
29. Watanabe, Y. Breakdown of ion-polarization-correspondence and born effective charges: Algebraic formulas of accurate polariza-
tion under field. Phys. Rev. Mater. 4, 104405-1–11 (2020).
30. Heine, V. Theory of surface states. Phys. Rev. A 138, 1689–1696 (1965).
31. Li, Y. L., Cross, L. E. & Chen, L. Q. A phenomenological thermodynamic potential for BaTiO3 single crystals. J. Appl. Phys. 98,
06410114 (2005) (For examples of standard GLD theories).
32. Cross, L. E. & Pohanka, R. C. Ferroelectricity in bismuth oxide type layer structure compounds. Mater. Res. Bull. 6, 939–949 (1971).
33. Känzig, W. Ferroelectrics and antiferroelectrics. In Solid State Physics Vol. 4 (eds Seitz, E. & Turnbull, D.) 1–197 (Academic, New
York, 1957).
34. Haun, M. J., Furman, E., Jang, S. J., McKinstry, H. A. & Cross, L. E. Thermodynamic theory of P bTiO3. J. Appl. Phys. 62, 3331–3338
(1987).
35. Tagantsev, A. K. Landau expansion for ferroelectrics: Which variable to use?. Ferroelectrics 375, 19–27 (2008).
36. Boni, G. A. et al. Low value for the static background dielectric constant in epitaxial PZT thin films. Sci. Rep. 9, 14698 (2019).
37. Watanabe, Y. Calculation of strained B aTiO3 with different exchange correlation functionals examined with criterion by Ginz-
burg–Landau theory, uncovering expressions by crystallographic parameters. J. Chem. Phys. 148, 194702 (2018).
38. Garrity, K. F., Rabe, K. M. & Vanderbilt, D. Hyperferroelectrics: Proper ferroelectrics with persistent polarization. Phys. Rev. Lett.
112, 27601-1–5 (2014).
39. Liu, S. & Cohen, R. E. Stable charged antiparallel domain walls in hyperferroelectrics. J. Phys. Condens. Matter 29, 244003 (2017).
40. Krčmar, M. & Fu, C. L. Structural and electronic properties of B aTiO3 slabs: Mechanism for surface conduction. Phys. Rev. B 68,
115404-1–7 (2003).
41. Sai, N., Fennie, C. J. & Demkov, A. A. Absence of critical thickness in an ultrathin improper ferroelectric film. Phys. Rev. Lett. 102,
107601 (2009).
42. Ji, D. et al. Freestanding crystalline oxide perovskites down to the monolayer limit. Nature 570, 87–90 (2019).
43. Ievlev, A. V. et al. Chemical state evolution in ferroelectric films during tip-induced polarization and electroresistive switching.
Appl. Mater. Interfaces 8, 29588–29593 (2016).
44. Fong, D. D. et al. Stabilization of monodomain polarization in ultrathin P bTiO3films. Phys. Rev. Lett. 91, 127601-1–4 (2006).
Scientific Reports | (2021) 11:2155 | https://doi.org/10.1038/s41598-021-81237-0 10
Vol:.(1234567890)www.nature.com/scientificreports/
45. Deleuze, P.-M., Domenichini, B. & Dupont, C. Ferroelectric polarization switching induced from water adsorption in BaTiO3
ultrathin films. Phys. Rev. B 101, 075410 (2020).
46. Banieck, J. D. et al. Photoemission and quantum chemical study of S rTiO3 (001) surfaces and their interaction with C O2. Phys.
Rev. B 78, 195415-1–12 (2008).
47. De Souza, R. A., Metlenko, V., Park, D. & Weirich, T. E. Behavior of oxygen vacancies in single-crystal S rTiO3: Equilibrium dis-
tribution and diffusion kinetics. Phys. Rev. B 85, 174109-1–11 (2012) (For example).
48. Su, C.-P. et al. Impact of strain-field interference on the coexistence of electron and hole gases in SrTiO3/LaAlO3/SrTiO3. Phys.
Rev. Mater. 3, 075003-1–10 (2019) (For example).
49. Hacene, M. et al. Accelerating VASP electronic structure calculations using graphic processing units. J. Comput. Chem. 33, 2581–
2589 (2012).
50. Hutchinson, M. & Widom, M. VASP on a GPU: Application to exact-exchange calculations of the stability of elemental boron.
Comput. Phys. Commun. 7, 1422–1426 (2011).
51. Momma, K. & Izumi, F. VESTA 3 for three-dimensional visualization of crystal, volumetric and morphology data. J. Appl. Crystal-
logr. 44, 1272–1276 (2011).
Acknowledgements
Dr. P. Blöchel and Dr. M. Takashige for discussions, Dr. R. R. Mehta for his questions and discussions about
Ref.13, and the support JSPS KAKENHI no. JP19K21853 are acknowledged.
Author contributions
Y.W. did this work.
Competing interests
The author declares no competing interests.
Additional information
Correspondence and requests for materials should be addressed to Y.W.
Reprints and permissions information is available at www.nature.com/reprints.
Publisher’s note Springer Nature remains neutral with regard to jurisdictional claims in published maps and
institutional affiliations.
Open Access This article is licensed under a Creative Commons Attribution 4.0 International
License, which permits use, sharing, adaptation, distribution and reproduction in any medium or
format, as long as you give appropriate credit to the original author(s) and the source, provide a link to the
Creative Commons licence, and indicate if changes were made. The images or other third party material in this
article are included in the article’s Creative Commons licence, unless indicated otherwise in a credit line to the
material. If material is not included in the article’s Creative Commons licence and your intended use is not
permitted by statutory regulation or exceeds the permitted use, you will need to obtain permission directly from
the copyright holder. To view a copy of this licence, visit http://creativecommons.org/licenses/by/4.0/.
© The Author(s) 2021
Scientific Reports | (2021) 11:2155 | https://doi.org/10.1038/s41598-021-81237-0 11
Vol.:(0123456789)You can also read