Exchange Rate Shocks and Inflation Co-movement in the Euro Area
←
→
Page content transcription
If your browser does not render page correctly, please read the page content below
Exchange Rate Shocks and Inflation
            Co-movement in the Euro Area∗

Danilo Leiva-Leon,a Jaime Martı́nez-Martı́n,b and Eva Ortegaa
                                 a
                                  Banco de España
                            b
                                European Central Bank

             This paper decomposes the time-varying effect of exoge-
         nous exchange rate shocks on euro-area countries’ inflation
         into country-specific (idiosyncratic) and regionwide (common)
         components. To do so, we propose a flexible empirical frame-
         work based on dynamic factor models subject to drifting para-
         meters and exogenous information. We show that exogenous
         shocks are behind an important share of nominal EUR/USD
         fluctuations over the recent years. Our main results indicate
         that headline inflation in euro-area countries has become sig-
         nificantly more affected by exchange rate shocks since the early
         2010s. While in the case of headline inflation this increasing
         sensitivity is solely reliant on the idiosyncratic component, for
         energy inflation it is based on both idiosyncratic and common
         components. By contrast, exchange rate shocks do not seem to
         have a significant impact on the core component of headline
         inflation.
         JEL Codes: C32, E31, F31, F41.
1.       Introduction

Exchange rate fluctuations over a short period of time may be due
to a variety of reasons, which can be broadly grouped into three

     ∗
     We would like to thank our colleagues of the Expert Group on Exchange Rate
Pass-Through of the European System of Central Banks as well as seminar partic-
ipants at the Banco de España, the International Association for Applied Econo-
metrics 2019 Annual Conference, and the SAEe 2019 for their stimulating and
helpful comments. Also, we are thankful to Òscar Jordà and two anonymous refer-
ees for their helpful comments and suggestions. The views expressed in this paper
are those of the authors and do not represent the view of the Banco de España, the
European Central Bank, or the Eurosystem. Any errors are our own responsibil-
ity. Author e-mails: danilo.leiva@bde.es; jaime.martinez-martin@ecb.europa.eu;
eortega@bde.es.

                                        239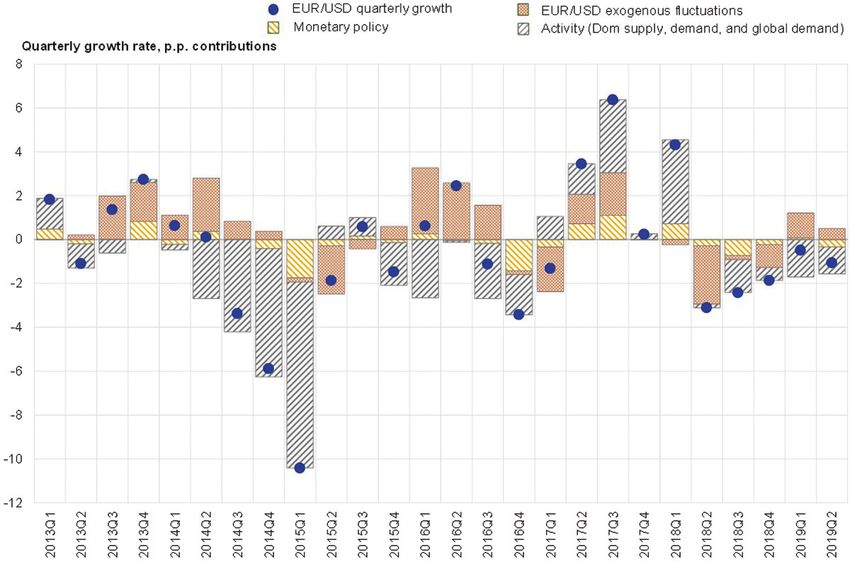
240          International Journal of Central Banking              March 2022

categories: (i) fresh developments relating to growth fundamentals
of each economy, on either the demand or supply side; (ii) perceived
changes in countries’ respective monetary policies, since they have
a bearing on the relative return of financial assets associated with
each economy; and (iii) risk premium shocks not directly linked to
economic or monetary fundamentals which can prompt strong and
swift movements in exchange rate dynamics that are hard to iden-
tify and predict (these are usually referred to as exogenous exchange
rate shocks).
    From a policymaker’s standpoint, assessing the effects that cur-
rency movements may have on price inflation is crucial for the design
of a monetary policy framework. A clearer understanding of the
transmission channels may improve not only the ability to predict
the impact but also the ability to better understand the effects of
central banks’ actions in this context. As a result, a prolific literature
has focused on analyzing the degree to which a country’s import,
producer, or consumer prices change in response to its exchange
rate fluctuations. This is commonly known as exchange rate pass-
through (hereafter, ERPT).1 The literature on ERPT ranges from
seminal theoretical studies (Dornbusch 1987; Krugman 1987; and
Corsetti, Dedola, and Leduc 2008), which showed that ERPT to
prices was incomplete due to imperfect competition and pricing-to-
market, to cross-country empirical evidence (Campa and Goldberg
2005, 2010), which focused on slow-moving structural determinants,
such as changes in the composition of imports. Recently, there have
been more efforts to identify the factors behind the changes in
ERPT over time from a micro data perspective on firm pricing
(Gopinath, Itskhoki, and Rigobon 2010; Berger and Vavra 2013;
Devereux, Tomlin, and Dong 2015; and Amiti, Itskhoki, and Konings
2016). These works highlight drivers such as the role of invoicing cur-
rency, whether the transactions take place between or within firms,
the frequency and dispersion of price adjustments, and the role of
competition in final product markets.
    A recent line of empirical research has provided evidence that
the size, the duration, and even the sign of the ERPT depend
on the origin of the shocks behind exchange rate fluctuations. For

   1
    More specifically, it is usually defined as the percentage change in prices in
response to a 1 percent change in the exchange rate.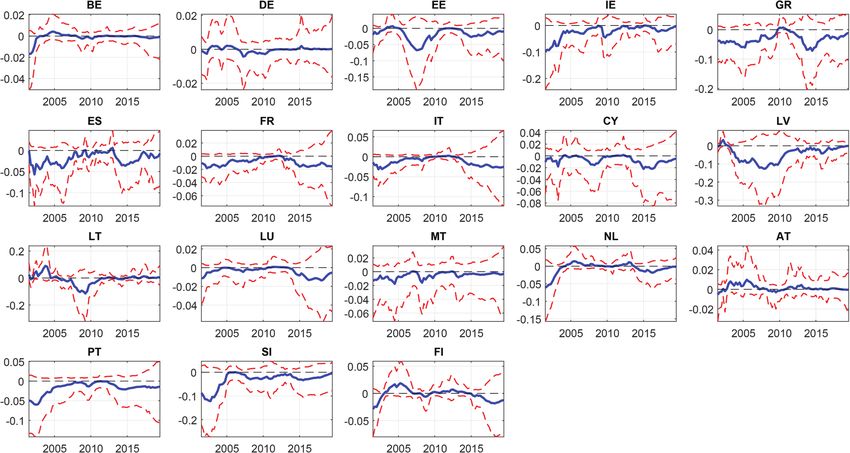
Vol. 18 No. 1     Exchange Rate Shocks and Inflation Co-movement              241

instance, Forbes, Hjortsoe, and Nenova (2015, 2018), following the
work of Shambaugh (2008), estimate a structural vector autoregres-
sion (SVAR) framework for the United Kingdom as a small open
economy. The authors highlight that it is essential to distinguish the
driving forces behind the exchange rate fluctuations (i.e., whether
they are due to domestic demand, global demand, domestic mon-
etary policy, global supply shocks, domestic productivity, etc.) in
order to explain how the ERPT has evolved. They also find that
domestic monetary policy shocks are those with a relatively higher
ERPT. A similar result was found for the euro area by Comunale
and Kunovac (2017), using the same methodology. Their estimates
point to a large but volatile ERPT to import prices and a very small
EPRT to consumer inflation, lower than in previous decades.2
    Theoretical models suggest a number of ways in which the
exchange rate–prices nexus is shock dependent. These channels are
corroborated by the related empirical literature. Yet, if the impact
on prices varies in the euro area due to the changing composition
of shocks driving the exchange rate movements, are they related to
country-specific and/or euro-area-wide forces? The above-mentioned
literature is silent on the cross-country heterogeneity inherent to a
set of economies sharing their currency and monetary policy. Our
proposed framework overcomes this drawback by jointly estimat-
ing the effect of euro-area (regionwide) exchange rate shocks on
the inflation rates associated with the different economies (country
specific).
    This paper builds on the literature on shock-dependent exchange
rate pass-through and elaborates further on the time variation and
cross-country differences in the response of different price compo-
nents to exchange rate changes in the euro area. Of all the sources
of exchange rate fluctuations, this paper focuses only on exogenous
exchange rate shocks (i.e., risk premium shocks not directly linked

   2
     Using reduced-form approaches (not shock dependent), a body of empirical
literature has put forward ERPT estimates for the euro area, showing evidence
that the ERPT to consumer prices is about a tenth of that to import prices.
Structural DSGE (dynamic stochastic general equilibrium) models, which con-
sider the different transmission of different structural shocks, tend to deliver a
higher and more gradual pass-through to consumer prices. For further details,
see Ortega and Osbat (2020) and references therein such as Hahn (2003), Jašová,
Moessner, and Takáts (2016), and Özyurt (2016).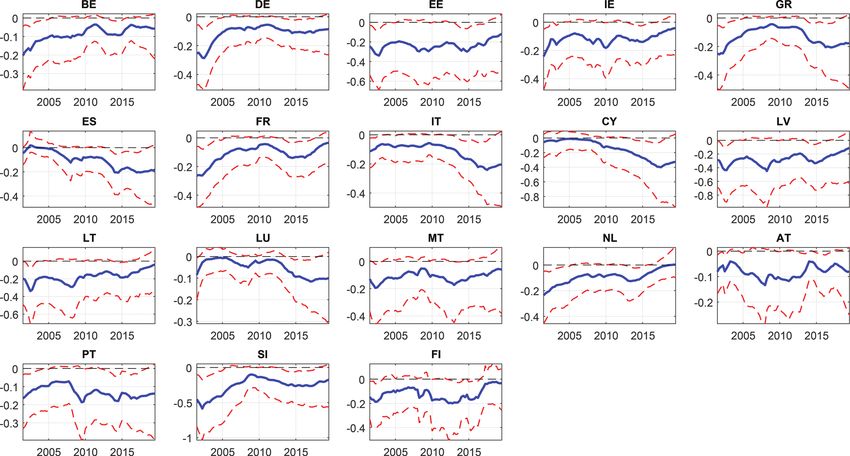
242 International Journal of Central Banking March 2022
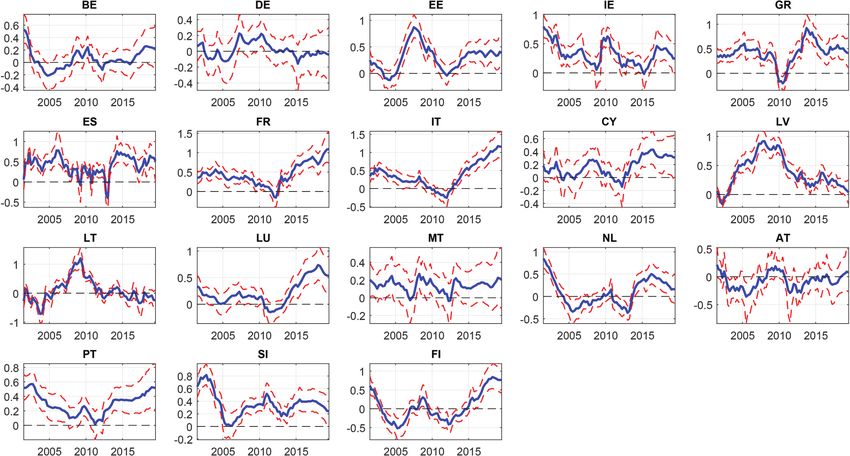
Figure 1. Historical Decomposition of
Nominal Exchange Rate USD/EUR
Note: Estimates based on the quarterly SVAR model of the USD/EUR exchange
rate described in Section 2, where shocks are identified via sign restrictions. Esti-
mates for 2019:Q2 are based on data available at the time of the cut-off date
(September 2019). Data for U.S. and euro-area GDP in 2019:Q2 are based on
flash estimates. The USD exchange rate movements refer to the quarterly rates
of changes of the respective quarters. The figure depicts the average contribution
of the 10,000 historical decompositions obtained from the saved iterations of the
estimation algorithm.
to economic or monetary fundamentals) for at least two reasons.
First, we seek to imitate insofar as possible the concept of ERPT
in a shock-dependent context: we isolate the transmission to prices
of “pure” exchange rate shocks from the joint reaction of prices and
exchange rates to other structural shocks such as demand, supply,
or monetary policy shocks. Second, we focus on exogenous exchange
rate shocks for an empirical reason. As shown in our empirical results
(see Figure 1), structural shocks other than exogenous exchange rate
shocks account for an important share of the change in the nomi-
nal EUR/USD exchange rate—for around 65 percent since 1995—to
be precise. However, exogenous exchange rate shocks have played
a bigger part in unanticipated nominal exchange rate movements,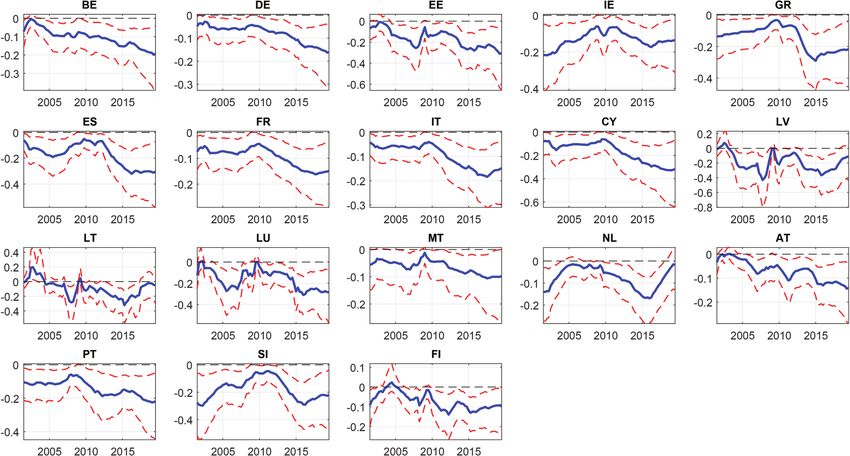
Vol. 18 No. 1     Exchange Rate Shocks and Inflation Co-movement              243

not only in recent years but also during turning-point periods.3 Our
findings indicate that they are behind more than 50 percent of nom-
inal EUR/USD exchange rate fluctuations in more than a third of
the quarters of the past six years.
    The contribution of this paper is twofold. First, we investigate
potential changes over time in the effect that exogenous exchange
rate shocks have on headline inflation in euro-area countries and on
its corresponding components. For ease of exposition, we can express
this goal in simple terms with the following equation:
                IN Fi,t = φi (L)IN Fi,t−1 + βi,t ER
                                                  t  + vi,t ,                (1)
where IN Fi,t is the inflation rate of country i at time t, the term
φi (L) helps control for past inflation dynamics, the exchange rate
shocks are measured by ER                                      4
                          t , and vi,t represents an error term. Note
that in Equation (1), our object of interest is the dynamics of βi,t ,
which measures the changing sensitivity of inflation to exchange rate
shocks.
    Second, we decompose the sensitivity of inflation to exchange
rate shocks across euro-area economies into two parts: one is exclu-
sively related to the inflation dynamics of country i and the other is
common to all euro-area countries. In other words, the latter can be
interpreted as the sensitivity of country i inflation to exchange rate
shocks that is formed jointly with other countries of the region. The
following equation illustrates this decomposition:
                          βi,t = IDIi,t × COMt ,                             (2)
where IDIi,t denotes the idiosyncratic, country-specific component
and COMt denotes the common, regionwide component. The infor-
mation contained in Equation (2) can be useful for policymakers to
understand the extent to which movements in inflation of a given
country, brought about by exchange rate shocks, can be attributed
to its exclusive and intrinsic economic performance or to the overall
performance of all monetary union partners.

    3
      Turning-point periods are defined as switching states of EUR/USD valuations
(i.e., transitions from appreciation to depreciation and vice versa) based on the
monthly nominal EUR/USD reference exchange rate provided by the European
Central Bank (ECB).
    4
      The lag operator is denoted by L.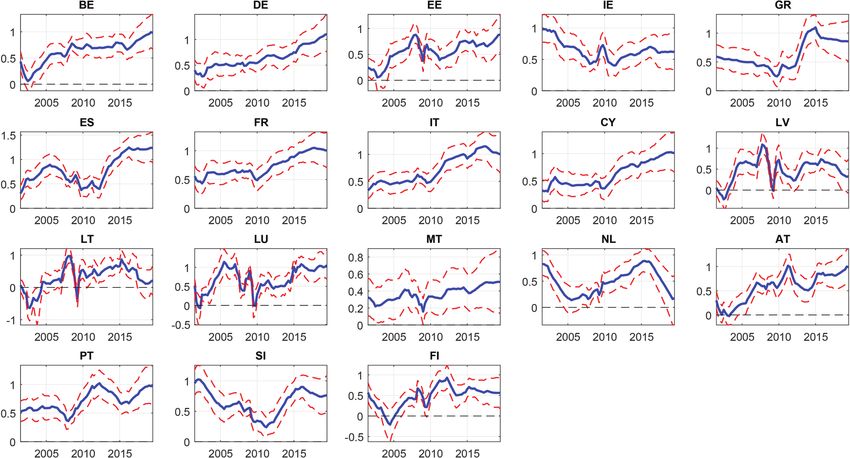
244          International Journal of Central Banking            March 2022

    To jointly assess both the time variation in the sensitivity of
inflation to exogenous exchange rate shocks and its decomposition
into country-specific and regionwide components, we adopt a uni-
fied multi-country perspective. In particular, we first identify such
exchange rate shocks using a structural VAR model for the aggregate
euro-area economy. To ensure that shocks have the expected effect
on the macroeconomy, according to theoretical models or stylized
facts, we base our identification scheme on sign restrictions, along
the lines of Shambaugh (2008), Forbes (2015, 2018), and Comu-
nale and Kunovac (2017). Next, we use the exchange rate shocks
as exogenous information in a dynamic factor model with drifting
coefficients for inflation in the euro-area economies.5 This empirical
framework allows us to make accurate comparisons of the results
across the different economies. In particular, it provides a full spec-
trum of the effect of exogenous exchange rate shocks on inflation (i)
across countries, (ii) by subcomponents, and (iii) over time.
    The main results show that the sensitivity of headline inflation
to exchange rate shocks has increased since the early 2010s. In other
words, an unexpected appreciation of the euro versus the dollar
leads to larger declines in inflation than before. Such an increase
is systemic and broad based, since most euro-area countries have
experienced it. When assessing the source of such recent increased
sensitivity of headline inflation to exchange rate shocks, it is found
that (i) the euro-area-wide component, which can be interpreted as
the effect of exchange rate shocks on aggregate euro-area inflation,
has remained relatively stable over time; by contrast (ii) the country-
specific component has displayed a substantial increase since the
early 2010s. This implies that the growing sensitivity of headline
inflation to exchange rate shocks is heavily reliant on the increas-
ing similarities between inflation rate dynamics associated with the
euro-area countries.

   5
     The euro-area monetary union comprises 19 EU member states: Belgium
(BE), Germany (DE), Estonia (EE), Ireland (IE), Greece (GR), Spain (ES),
France (FR), Italy (IT), Cyprus (CY), Latvia (LV), Lithuania (LT), Luxemburg
(LU), Malta (MT), the Netherlands (NL), Austria (AT), Portugal (PT), Slovenia
(SI), and Finland (FI). Results for Slovakia (SK) are not reported due to data
limitations.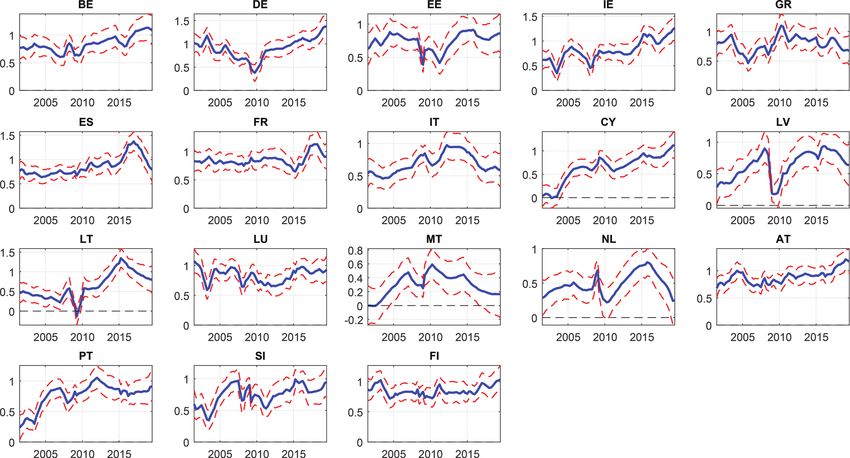
Vol. 18 No. 1    Exchange Rate Shocks and Inflation Co-movement          245

    By subcomponents—that is, energy, food, and core prices—the
results are heteregoneous. First, the sensitivity of the energy com-
ponent to exogenous exchange rate shocks has also increased signif-
icantly in recent years. Contrary to the case of headline inflation,
this result relies equally on the country-specific and common com-
ponents. Second, food inflation estimated sensitivity is similar to
that of headline inflation, albeit less statistically significant. Third,
core inflation sensitivity estimates behave somewhat different: core
inflation across countries does not seem to be meaningfully affected
by exogenous exchange rate shocks, along the lines of the empir-
ical literature findings (Ortega and Osbat 2020). Therefore, our
results suggest that the increase in the ERPT has been induced
by an increasing headline inflation co-movement, mainly driven by
its energy component.6
    The structure of the paper is as follows: Section 2 sets out
the empirical approach; Section 3 discusses the main findings, with
particular focus on the assessment of inflation co-movement across
countries; and Section 4 sets out the conclusions.

2.       Empirical Framework

In this section, we provide an empirical framework to investigate
the effects of exchange rate shocks on inflation in euro-area countries
across both geographic and time dimensions. Therefore, we are inter-
ested in a modeling approach able to meet four main criteria: (i) to
properly identify exchange rate shocks for the euro-area economy as
a whole, given the unified monetary system; (ii) to estimate how the
effect of those exchange rate shocks spreads across the different euro-
area countries; (iii) to provide information on the potential changes
over time in the sensitivity of each country to those shocks; and
(iv) to decompose the changing sensitivity into its country-specific
and regionwide components.
    We proceed in two steps. First, we use a structural VAR model to
identify purely exogenous exchange rate shocks. Second, according
to the exogenous exchange rate shocks identified in the first step,

     6
    At the same time, this component is highly influenced by shocks to global
factors, such as oil prices.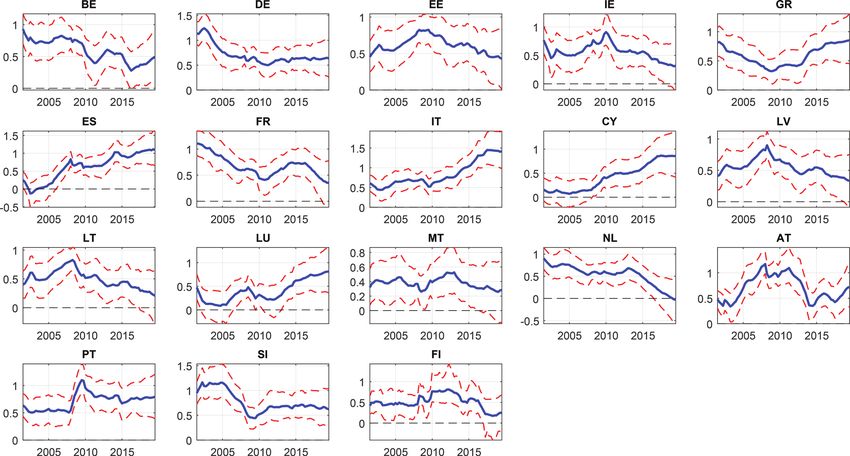
246          International Journal of Central Banking             March 2022

we investigate their time-varying effect on inflation across euro-area
countries using factor models.7

2.1   Structural VAR Model
We employ a structural vector autoregression model to investigate
the exchange rate sensitivity of euro-area inflation, considering how
different theory-based shocks may affect the exchange rate and
prices. More specifically, we are interested in assessing the effects
of five shocks on the euro-area economy: domestic supply, domestic
demand, global demand, relative monetary policy, and exogenous
exchange rate shocks. This is a similar variety of shocks as pre-
viously considered in related literature and should encompass all
shocks that could be relevant drivers of exchange rate fluctuations.
For instance, a sudden increase in domestic risk aversion would be
captured as an exogenous exchange rate shock. To the extent that
such unanticipated shocks may drive movements in the EUR/USD
exchange rate, they may also determine the magnitude and duration
of pass-through.
    However, a major concern in this context is to link economic the-
ory to identify the shocks of interest with appropriate restrictions
on variables’ impulse responses. The identification strategies histori-
cally used by the related literature in estimating ERPT—conditional
on underlying shocks—have a number of limitations and are only
able to identify a restricted set of shocks. More specifically, the sem-
inal work of Shambaugh (2008) uses long-run restrictions to identify
separately domestic supply, relative demand, nominal shocks, and
foreign price shocks. The interpretation of the latter three types of
shocks, however, is not straightforward and does not easily translate
into standard macroeconomic models, and the identification strat-
egy does not allow for disentangling shocks originating in different
regions.
    To address the identification challenge, we impose several short-
run sign restrictions which are motivated by open-economy DSGE

    7
      Similar methodological approaches have been used for exogenous changes in
oil prices (Kilian 2009) or for potential output distinguishing between demand
and supply shocks (Coibion, Gorodnichenko, and Ulate 2017).
Vol. 18 No. 1     Exchange Rate Shocks and Inflation Co-movement             247

models. In particular, these restrictions are consistent with the two-
country New Keynesian model described in de Walque et al. (2017,
2020), the Banque Nationale de Belgique model of the euro-area
economy, which entails the standard open-economy main character-
istics. This DSGE model integrates two closed-economy models—for
the euro area and the United States—through international trade in
goods and assets, and it is rather rich in terms of features: sticky
local-currency pricing, distribution sector, intermediate goods in
the production function, and a demand elasticity increasing with
the relative price. The shock transmission mechanisms of this stan-
dard open-economy model are described in more detail in the online
appendices for this paper (available at http://www.ijcb.org).
    Accordingly, to identify the main shocks driving the dynam-
ics of the euro exchange rate against the U.S. dollar, we esti-
mate an endogenous multivariate model that uses quarterly infor-
mation about the euro-area real GDP growth rate (GDP ), euro-
area HICP inflation (IN F ), relative short-term interest rates (IN T )
between the euro area and the United States, the EUR/USD nominal
exchange rate (F X), and the relative euro-area activity share with
respect to the United States (EA/U S). Therefore, let the vector col-
lecting of the variables be Yt = [GDPt , IN Ft , IN Tt , F Xt , EA/U St ];
the estimated model is a SVAR(p) model given by


                                   P
                      Yt = Φ0 +          Φp Yt−p + Bt ,                    (3)
                                   p=1

where t ∼ N (0, I) are the structural innovations. The reduced-form
innovations, defined as ut , are related to the structural innovations
through the impact multiplier matrix B, that is, ut = Bt .8
   To identify the structural shocks of interest following the macro-
economic relations explained above, we impose sign restrictions on
some of the entries of the impact multiplier matrix.9 These sign

   8
     In our empirical application, we let the number of lags of the endogenous
variables be p = 2. Robustness tests on different lags are reported in the online
appendices.
   9
     A similar approach is used in Leiva-Leon (2017) for the case of Spain and
Estrada et al. (2020) for emerging market economies.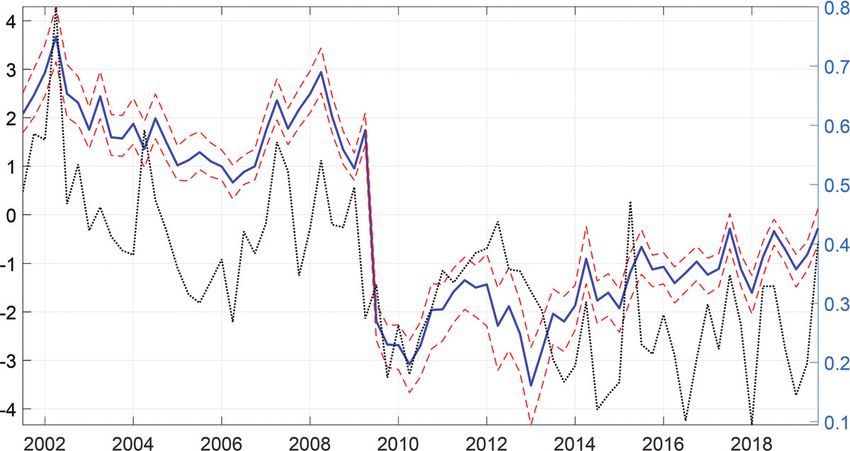
248            International Journal of Central Banking              March 2022

restrictions have been widely used in the literature, have been shown
to be consistent with theoretical models (see online appendices for
further reference), and are based on four sets of assumptions.
    First, we assume that a positive domestic supply shock,
Dom
 t
      Sup
          , is associated with an increase in domestic output and the
relative euro-area activity share and a decrease in inflation, interest
rates, and foreign exchange rates.10 By contrast, a positive domestic
demand shock, Dom t
                        Dem
                            , would be associated with higher output
and relative euro-area activity, higher HICP inflation, higher interest
rates, and euro appreciation. Second, we assume that an unexpected
tightening of the monetary policy stance, M   t
                                                 on P ol
                                                         , that increases
the short-term interest rate is associated with lower inflation, out-
put growth, and relative share of euro-area activity with respect
to the United States. Third, we impose that an unexpected euro
appreciation, tExo ER , which increases the EUR/USD exchange rate,
would lead to declines in inflation and the interest rate.11 Fourth, we
assume that a positive global demand shock, tGlo Dem , that reduces
the relative size of the euro-area economy compared with the world
economy (proxied by the United States) exerts upward pressure on
euro-area output and inflation, but would lead to a relatively looser
monetary policy in the euro area than in the United States, where
demand expansion would be larger after the positive global demand
shock.12 All these restrictions can be formalized as follows:
       ⎡             ⎤   ⎡                  ⎤ ⎡ Dom Sup                ⎤
            uGDP
              t              +   +    − ∗ +     t
       ⎢    uIN  F   ⎥ ⎢     −   +    − − + ⎥ ⎢ Dom Dem               ⎥
       ⎢      t      ⎥ ⎢                    ⎥⎢ t                       ⎥
       ⎢    utIN T   ⎥=⎢     −   +    + − − ⎥ ⎢ M on P ol              ⎥,      (4)
       ⎢             ⎥ ⎢                    ⎥ ⎢ t                     ⎥
       ⎣     uFt
                 X   ⎦ ⎣     −   +    ∗ + ∗ ⎦ ⎣ tExo ER               ⎦
            EA/U S
           ut                +   +    − ∗ −      tGlo Dem

  10
      A decrease in the FX rate is defined as a reduction in the EUR/USD exchange
rate, i.e., euro depreciation.
   11
      For the sake of robustness, an alternative identification scheme concerning an
unexpected appreciation of the nominal euro exchange rate (exogenous exchange
rate shock or risk premium shock) is further developed in the online appendices.
It provides broadly similar results.
   12
      An important related aspect is the link between oil prices and exchange rate
developments. In the online appendices, we further discuss this issue and provide
model-based evidence of little impact on the key results by means of an SVAR-X
approach.
Vol. 18 No. 1 Exchange Rate Shocks and Inflation Co-movement 249
where the “∗” in the impact multiplier matrix indicates that the
entries have been left unrestricted. This combination of sign restric-
tions is the minimum number of theory-based economically sensible
restrictions that allows us to identify the shocks of interest and at
the same time to ensure their orthogonality.13
We estimate the SVAR model, described in Equations (3)–(4),
using quarterly data for the euro area and the United States for
the period from 1995:Q1 to 2019:Q2 on the following six variables:
(i) the euro-area real gross domestic product (GDP) growth rate
from the European Commission (Eurostat); (ii) inflation based on
the Harmonised Index of Consumer Prices (HICP) for the euro area
from the European Commission (Eurostat); (iii) relative short-term
interest rates between the euro area and the United States, and for
the zero lower bound period, shadow rates based on quarterly aver-
ages of monthly estimates from Krippner (2013);14 (iv) quarterly
average of the monthly nominal EUR/USD reference exchange rate
provided by the European Central Bank (ECB);15 and (v) relative
euro-area activity calculated as the ratio of euro-area to U.S. GDP,
based on GDP data provided by the European Commission (Euro-
stat) and the U.S. Bureau of Economic Analysis (BEA). All variables
except the relative interest rate are transformed into quarterly log
differences.
Finally, the SVAR model is estimated using Bayesian methods. In
particular, an independent normal-inverse-Wishart prior is assumed
to simulate the posterior distribution of the parameters. Struc-
tural shocks are identified by following Arias, Rubio-Ramirez, and
Waggoner (2018), where sign restrictions are imposed on impulse
13
A wide range of estimation methodolgy robustness checks is discussed in
the online appendices. The estimates obtained are qualitatively similar to those
obtained with our benchmark specification in Equations (3)–(4).
14
Model results are, in any case, robust to different monetary policy measures,
such as relative official interest rates in the euro area and the United States and
shadow interest rates. Shadow rates are constructed using multifactor shadow
rate term structure models by Wu and Xia (2016).
15
Our SVAR model results are robust to an alternative estimation using the
nominal effective exchange rate of the euro against its main 38 trade partners—
NEER-38 countries—although some caveats arise, as the variables proxying
global demand and relative monetary policy are measured only in relation to
the United States, not to the full set of 38 countries used in the NEER definition.250 International Journal of Central Banking March 2022
response functions. Further details of the estimation procedure are
provided in the online appendices.
2.2 Factor Model with Exogenous Information
Dynamic factor models have been widely used to characterize the
degree of co-movement in the dynamics of prices from different lev-
els of disaggregation. Two examples are Del Negro and Otrok (2007),
who focus on house prices at the state level for the U.S. economy,
and Cicarelli and Mojon (2010), who present a global perspective
of synchronized inflation dynamics across industrialized countries.
Here, we use this tool to provide a comprehensive assessment of
exchange rate effects on inflation in the euro-area countries from a
unified perspective.
We use the exogenous exchange rate shocks extracted from the
structural VAR model described above to assess their effect on
inflation in the n euro-area countries. As suggested by Mumtaz
and Sunder-Plassmann (2013), the effects associated with exchange
rate fluctuations in advanced economies are subject to substan-
tial changes over time. Hence, as we are primarily interested in
assessing changes in the exchange rate sensitivity of inflation over
time, we rely on a multivariate framework subject to time-varying
coefficients.16
Taking the standardized inflation rate of country i defined as
πi,t = (IN Fi,t − μi,inf )/σi,inf , where μi,inf = mean(IN Fi,t ) and
σi,inf = std(IN Fi,t ), we propose the following time-varying para-
meter factor model with exogenous information, referred to as
TVP-DFX,
πi,t = γi,t ft + ui,t , (5)
ft = φt ft−1 + λt tExo ER + ωt , (6)
for i = 1, 2, . . . , n, and where ui,t ∼ N (0, σi2 ) and ωt ∼ N (0, 1).
Note that Equation (5) decomposes country-specific inflation, πi,t ,
into a common component, ft , and an idiosyncratic component,
16
A similar factor model with time-varying coefficients is also used in Duc-
tor and Leiva-Leon (2016) to unveil an increasing synchronization in global real
activity.Vol. 18 No. 1 Exchange Rate Shocks and Inflation Co-movement 251
ui,t , whereas Equation (6) assumes that the common factor follows
autoregressive dynamics and that it is also influenced by exogenous
information—in particular, by the exogenous exchange rate shocks
tExo ER .
The model parameters are assumed to evolve according to ran-
dom walks to account for potential instabilities over time,
γi,t = γi,t−1 + ϑi,t (7)
φt = φt−1 + ϑφ,t (8)
λt = λt−1 + ϑλ,t , (9)
where ϑi,t ∼ N (0, νi2 ), ϑλ,t ∼ N (0, νλ2 ), and ϑφ,t ∼ N (0, νφ2 ). Most
importantly, the time-varying degree of inflation co-movement across
countries is captured by γi,t , while changes in the persistence of the
latent factor are collected in φt , and the dynamic sensitivity of the
inflation factor is measured by λt .
Plugging Equation (6) into Equation (5) gives us the following
expression for country i inflation dynamics:
IN Fi,t = β̃i,0 + β̃i,1,t ft−1 + β̃i,2,t tExo ER + ṽi,t , (10)
where β̃i,0 = μii,inf , β̃i,1,t = σi,inf γi,t φt , β̃i,2,t = σi,inf γi,t λt , and
ṽi,t = σi,inf (γi,t ωt + ui,t ). Note that there is a direct correspondence
between Equation (10) and Equation (1)—in particular, between
the coefficients measuring the sensitivity of inflation to exchange
rate shocks in both equations, i.e., β̃2,i,t and βi,t , respectively.
The main advantage of the proposed TVP-DFX model is that
i
it allows the effect of exchange rate shocks on inflation, β̃2,t , to
be decomposed into two components: the country-specific compo-
nent, γi,t , and the euro-area-wide component, λt , which would cor-
respond to the terms IDIi,t and COMt , respectively, in Equation
(2). The term λt provides information about the changing effect that
exchange rate shocks have on euro-area inflation dynamics, proxied
by the factor ft . By contrast, the term γi,t provides information on
the changing propagation of those shocks across the different coun-
tries of the euro area. Equation (10) is first estimated on headline
HICP inflation across the euro-area economies. Section 3.2 discusses
the findings, as well as the estimation of Equation (10) on the three252 International Journal of Central Banking March 2022
components of HICP inflation (food, energy, and the core compo-
nent, i.e., total HICP excluding food and energy prices). Note that
an additional advantage of the proposed framework is that it can
be used to incorporate structural shocks obtained from any other
kind of model for validation purposes, i.e., semi-structural or DSGE
models. However, in the current application we only focus on the
shocks from the structural VAR model described in Section 2.1.
3. Sensitivity of Prices to Exchange Rate Shocks
3.1 An Aggregate Assessment
This section aims to help understand the link between movements
in the EUR/USD and euro-area consumer prices. We analyze what
types of shocks have driven the euro exchange rate fluctuations over
the period 1995:Q1–2019:Q2 by examining historical shock decom-
positions from the SVAR detailed in Section 2.17 To begin with,
Figure 1 presents the historical decomposition of shocks behind the
evolution of quarter-on-quarter EUR/USD exchange rate. It per-
mits a better understanding of the relative weight of different shocks
and its variation over time. An increase (reduction) is defined as an
increase (reduction) in the EUR/USD in exchange rate, i.e., euro
appreciation (depreciation) against the USD. Focusing on the most
recent period, the contributions of the potential driving factors iden-
tified in the SVAR are the following: (i) innovations to real activity
(either from domestic demand and supply or from the rest-of-the-
world demand); (ii) relative monetary policy shocks; and (iii) exoge-
nous exchange rate shocks not directly linked to fundamentals or
monetary policy. As discussed earlier, exogenous factors may proxy
risk premium shocks, which most notably reflect changes in the con-
fidence, sentiment, or perception (optimism or pessimism) among
traders operating on foreign exchange markets. They are usually
sudden, strong, and difficult to predict.
A quick glance at Figure 1 suggests that structural shocks other
than exogenous exchange rate shocks account for a large share of
the EUR/USD fluctuations—for around 65 percent over the sample
17
Estimates for 2019:Q2 are based on data available at the time of the cut-off
date (September 2019).Vol. 18 No. 1 Exchange Rate Shocks and Inflation Co-movement 253
period, to be precise. Therefore, treating all exchange rate changes
as exogenous shocks is unlikely to adequately capture the underlying
dynamics—in particular, if the mix of shocks driving the exchange
rate varies over time, as discussed in Section 1. However, exogenous
exchange rate shocks have played a bigger part in unanticipated
nominal exchange rate movements, not only in recent years but also
in turning-point periods, that is, transitions either from appreciation
to depreciation or from depreciation to appreciation. Our findings
indicate that they are behind more than 50 percent of the exchange
rate fluctuations in more than a third of the quarters of the past six
years, as shown in Figure 1.
For example, according to our structural analysis, the euro’s
marked appreciation between 2017:Q2 and 2018:Q1 could have been
driven by at least three forces. Ranked in order of importance, they
are as follows: First, its appreciation may have been due to a higher
relative growth of the euro area, which would have exerted an infla-
tionary pressure. Second, it may have been due to exogenous fac-
tors exerting a deflationary effect (through a reduction in import
prices). Third, it may have been because of the perception that the
ECB’s monetary policy was somewhat less relaxed at the end of
2017, relative to the Federal Reserve’s, the latter also exerting a
deflationary effect due to the relative monetary policy stance. These
arguments are consistent with existing previous literature such as
Cœuré (2017), which is an example of how shock-dependent esti-
mates of the exchange rate–prices nexus are affecting the monetary
policy debate. However, it has to be considered that these estimates
may be very sensitive to the particular model specification (sample
period, identification scheme, choice and measurement of variables),
as argued in Ortega and Osbat (2020).18
18
A full set of different model variants have also been estimated to test whether
our findings are sensitive to alternative identification strategies, different lag
orders and sign restriction periods, third-currency effects beyond the EUR/USD
bilateral relationship (i.e., considering the nominal effective exchange rate of the
euro), a version of our SVAR subject to time-varying parameters (TVP-SVAR),
and the role of oil prices through the lenses of a SVAR-X model. The robust-
ness results are summarized in the online appendices and show no remarkable
differences neither in the historical decomposition of exchange rate shocks nor in
specific, extracted shocks.254 International Journal of Central Banking March 2022
Figure 2. Euro-Area Headline Inflation Factor (ft )
Note: Blue solid (red dashed) line, aligned with the left axis, makes reference
to the median (16th and 84th percentile) of the posterior distribution estimates
obtained with the univariate model. Black dotted line, aligned with the right
axis, makes reference to the euro-area headline quarterly inflation expressed in
percentage points. (For figures in color, see the online version of the paper at
http://www.ijcb.org.)
3.2 The Role of Inflation Co-movement
After estimating the proposed dynamic factor model with drift-
ing coefficients and exogenous information, described in Equations
(5)–(9), we proceed to assess the effect of exchange rate shocks
on inflation (i) over time, (ii) across countries, and (iii) by price
component.
We begin by focusing on the case of headline inflation. The com-
mon factor extracted from headline inflation across the euro-area
countries is plotted in Figure 2. This is ft in Equation (5), esti-
mated using total HICP data for the euro-area countries. It shows
a strikingly similar pattern to actual headline inflation for the euro
area. Therefore, the estimated common factor ft can be interpreted
as a proxy for euro-area headline inflation dynamics.
Figure 3 plots the total estimated time-varying sensitivity of the
euro-area countries’ headline inflation to exchange rate shocks, that
is, β̃i,2,t in Equation (10). The estimates suggest that a persistent
increase in the effect of shocks on inflation occurred around 2010.
This is a general pattern for most countries, but it is especially acuteFigure 3. Sensitivity of Country-Specific Headline Inflation to Exchange
Rate Shocks Based on a Multivariate Model (β̃i,2,t )
Vol. 18 No. 1
Exchange Rate Shocks and Inflation Co-movement
Note: Blue solid (red dashed) line makes reference to the median (16th and 84th percentile) of the posterior distribution
estimates obtained with the multivariate model.
255256 International Journal of Central Banking March 2022
for the largest economies. In particular, France, Germany, and Italy
exhibited a sensitivity of around 0.1 before 2010, but which has
since continued to increase, up to 0.2. For Spain the increase is
even larger, up from 0.2 before 2010 to around 0.4 subsequently.
Some smaller economies, such as Portugal, Finland, or Malta, have
also experienced increasing sensitivity, but less persistently.19 These
results show traces that at the zero lower bound, and under credi-
ble forward guidance of the interest rates, the pass-through of the
exchange rate changes to prices is larger.20
As the estimated common factor is a good proxy for euro-area
headline inflation, the time-varying parameter λt in Equation (6)
can be interpreted as the changing effect of exchange rate shocks on
the aggregate euro-area inflation rate. Figure 4A plots the dynam-
ics of the regionwide component of the total sensitivity, λt , showing
that, in general, it has remained steady, the only exception being
the Great Recession period when exogenous exchange rate shocks
did not seem to have a significant effect on euro-area headline infla-
tion. In particular, a 1 percent exogenous appreciation of the euro
would be associated with a decline in euro-area HICP inflation of
around 0.15 percent on impact.21 By contrast, Figure 4B plots the
19
To assess the importance of relying on the shocks rather than simply on the
movements of exchange rate, we reestimate the proposed factor model, but replac-
ing the exogenous exchange rate shocks, in Equation (6), with a simpler measure
which consists on the quarterly change of the level of the exchange rate. The
results indicate that when conditioning on the movements of the exchange rate,
and not on its unexpected component, its time-varying pass-through to headline
inflation across countries (i) is very small in magnitude, (ii) is estimated with
large uncertainty, (iii) occasionally exhibits counterintuitive signs, and (iv) does
not increase of decrease over time, but instead shows only temporary changes.
These results are not shown for the sake of space, but they are available upon
request.
20
This result is consistent with the theoretical literature on the secular stag-
nation hypothesis and the idea that international trade relations become more
conflictual at the zero lower bound (ZLB)—in particular, in those economies
where a persistently low or negative natural rate of interest has led to a chron-
ically binding ZLB and the central bank no longer dampens the effects of this
kind of shocks. See Eggertsson, Mehrotra, and Summers (2016) and Eggertsson,
Mehrotra, and Robbins (2019).
21
The impact of monetary policy shocks on HICP inflation and its compo-
nents has also been analyzed under the same empirical strategy, although it is
beyond the scope of this paper. Empirical findings point to a decreasing path of
sensitivity of inflation to these shocks.Vol. 18 No. 1 Exchange Rate Shocks and Inflation Co-movement 257
Figure 4. Time-Varying Coefficients of
Model for Headline Inflation
Note: Blue solid (red dashed) line makes reference to the median (16th and 84th
percentile) of the posterior distribution estimates obtained with the univariate
model.
time-varying persistence of the common inflation factor, showing a
slightly declining pattern since 2008.
Increasing sensitivity across countries, along with relatively
stable sensitivity for the aggregate euro area, can be explained by
an increasing degree of co-movement in headline inflation across
euro-area countries. Figure 5 shows the estimated time-varying
loadings of the common component into each country’s inflation of
Equation (5), that is, the country-specific component of the total
sensitivity. Accordingly, the dynamics of γi,t measure the changing
contemporaneous relationship between country-specific inflation
measures and their common factor. As expected, the figure reflects
sustained increases over time in the synchronization of headline
inflation dynamics for most countries.
In other words, the fact that inflation rates across euro-area coun-
tries have exhibited an increasing degree of co-movement over time
implies that such countries are reacting in a more similar way to
shocks hitting the euro area as a whole. Notice that the effect of
exchange rate shocks on the common factor (which proxies the euro-
area headline inflation) has just slightly increased since the Great
Recession; see Figure 4A. However, this small increasing effect is
amplified for the countries due to the fact that now they are more
sensitive to these common shocks than in the past, as shown in the
factor loadings dynamics reported in Figure 5.22
22
The reasoning for these results relies on the evolving heterogeneity across
inflation rates of euro-area countries. In particular, total inflation in some258
Figure 5. Time-Varying Co-movement of Euro-Area Countries’ Headline Inflation (γi,t )
International Journal of Central Banking
Note: Blue solid (red dashed) line makes reference to the median (16th and 84th percentile) of the posterior distribution
estimates obtained with the univariate model.
March 2022Vol. 18 No. 1 Exchange Rate Shocks and Inflation Co-movement 259
Note that if country-specific forces start to strongly move in the
same direction, eventually those forces would lose their idiosyncrasy
and become a euro-area-wide force. However, the distinction between
those two forces is not always straightforward to define in our context
and, consequently, to measure. Our framework provides an attempt
to perform this measurement from a reduced-form, and unified, per-
spective. Undoubtedly, a wide range of structural aspects come into
play in explaining these differences; however, the analysis of these
aspects goes beyond the scope of this paper. An illustrative example
is the case of the Baltic economies (Estonia, Latvia, and Lithuania)
during 2007 and 2010, when their inflation rates exhibited a tempo-
rary, but substantial, disengagement from the inflation rates of their
union partners. This illustrates that while there were euro-area forces
acting like an “attractor,” there were also strong country-specific
forces induced by multiple structural changes, associated with high
levels of trade openness and liberal economic policies taking place
around that time (see Benkovskis et al. 2009).
3.3 Breakdown by Inflation Subcomponents
In order to provide a comprehensive assessment of the exchange rate
pass-through to inflation, it is also crucial to understand the impact
that exchange rate shocks may have on the subcomponents of head-
line inflation. Therefore, the TVP-DFX framework is also used to
independently model the subcomponents of headline inflation—core,
food, and energy components—across euro-area countries.
We start by analyzing the core component. Figure 6 plots the
common core inflation factor. Although the factor and euro-area core
inflation follow a similar pattern, their similarity is not as marked as
in the case of headline inflation. This points to a potentially lower
degree of co-movement in the core component of inflation. Moreover,
Figure 7 shows that the effect of exchange rate shocks on core infla-
tion across countries is both negligible and very uncertain. This is
individual countries can become more sensitive to exchange rate shocks. How-
ever, that total inflation can be decomposed into two parts, a common and an
idiosyncratic one, which are independent. Therefore, the common part of the
inflation rate of those countries (which is based on all, and not only on some,
countries) does not necessarily have to also become more sensitive to exchange
rate shocks.260 International Journal of Central Banking March 2022
Figure 6. Euro-Area Core Inflation Factor (ft )
Note: Blue solid (red dashed) line, aligned with the left axis, makes reference
to the median (16th and 84th percentile) of the posterior distribution estimates
obtained with the univariate model. Black dotted line, aligned with the right axis,
makes reference to the euro-area core quarterly inflation expressed in percentage
points.
also the case when assessing the effect of the shocks on aggregate
euro-area core inflation, proxied by the extracted common factor
(see Figure 8A). Also, Figure 8B shows that the persistence of core
inflation has remained steady. As expected, the pattern of core infla-
tion co-movement across countries is more heterogeneous than in
the case of headline inflation, which is inferred from the estimated
time-varying factor loadings shown in Figure 9. Although some coun-
tries, such as Italy or France, have displayed increasing degree of
co-movement, most countries have shown a relatively stable or even
decreasing pattern, as in the case of Latvia.
Next, with regard to food and energy subcomponents of inflation,
Figures 10 and 11 show their estimated inflation factors, along with
the corresponding euro-area aggregate inflation. Similar to the case
of headline inflation, the path is one of striking accord. The increase
in the effect of exchange rate shocks on inflation, occurred since 2010,
has been significant for food prices (see Figure 12). However, it has
been rather weak and more uncertain for energy inflation (see Figure
13). The degree and development of co-movement experienced by
food and energy inflation rates have been relatively similar, as shownFigure 7. Sensitivity of Country-Specific Core Inflation to Exchange Rate
Shocks Based on a Multivariate Model (β̃i,2,t )
Vol. 18 No. 1
Exchange Rate Shocks and Inflation Co-movement
Note: Blue solid (red dashed) line makes reference to the median (16th and 84th percentile) of the posterior distribution
estimates obtained with the univariate model.
261262 International Journal of Central Banking March 2022
Figure 8. Time-Varying Coefficients
of Model for Core Inflation
Note: Blue solid (red dashed) line makes reference to the median (16th and 84th
percentile) of the posterior distribution estimates obtained with the univariate
model.
in Figures 14 and 15. Therefore, the difference between the sensitiv-
ity of food and energy inflation relies on the impact that exchange
rate shocks have on the corresponding euro-area aggregates, that is,
the regionwide component.23
Based on the findings obtained with the multivariate framework
in Equations (5)–(9), it is important to emphasize that both country-
specific and regionwide channels of the ERPT are relevant, and their
relative importance largely depends on the type of price compo-
nent. Also note that an important feature of the proposed multi-
variate framework is that it is able to both estimate and decompose
the sensitivity of inflation to exchange rate shocks. Such a decom-
position could be extremely useful for policymakers. It provides a
timely assessment of movements in inflation in a given country—
brought about by exchange rate shocks—disentangling whether they
are mainly driven by the country’s exclusive and intrinsic economic
performance, by the overall performance of all monetary union part-
ners, or by a combination of both.24
23
Thus, the effect of exogenous exchange rate shocks on euro-area food inflation
has not changed substantially over time, but the sensitivity of aggregate energy
inflation to unexpected exchange rate movements has increased considerably since
2009, as shown in Figures 16A and 17A, respectively.
24
This type of decomposition is in line with that proposed by Ozdagli and
Weber (2017) based on spatial autoregressions. In particular, the authors focus
on decomposing the total effect of monetary policy shocks on a given asset priceFigure 9. Time-Varying Co-movement of Euro-Area Countries’ Core Inflation (γi,t )
Vol. 18 No. 1
Exchange Rate Shocks and Inflation Co-movement
Note: Blue solid (red dashed) line makes reference to the median (16th and 84th percentile) of the posterior distribution
estimates obtained with the univariate model.
263264 International Journal of Central Banking March 2022 Figure 10. Euro-Area Food-Related Inflation Factor (ft ) Note: Blue solid (red dashed) line, aligned with the left axis, makes reference to the median (16th and 84th percentile) of the posterior distribution estimates obtained with the univariate model. Black dotted line, aligned with the right axis, makes reference to the euro-area food-related quarterly inflation expressed in percentage points. The entire set of empirical results are summarized in Table 1. They suggest that the gradual increase of the EPRT to headline inflation over time can be mainly attributed to its energy compo- nent. Across euro-area countries, the energy component is highly influenced by global factors such as oil and other commodity prices. Hence, the increasing influence of global factors in recent years could explain the increasing interlinkages between the energy inflation across euro-area economies, yielding a higher sensitivity of headline inflation to exogenous exchange rate shocks. 3.4 Robustness In order to verify that the ERPT dynamics across countries esti- mated using the proposed multivariate framework do not represent an artifact solely driven by the degree of co-movement, measured by the time-varying factor loadings, we perform a robustness exercise into (i) a direct effect, which would be the equivalent of our country-specific com- ponent; and (ii) an indirect effect, which takes into account the joint interaction of that given asset with the other assets in the economy, i.e., the network effect, which could be interpreted as our regionwide component.
Vol. 18 No. 1     Exchange Rate Shocks and Inflation Co-movement                265

Figure 11. Euro-Area Energy-Related Inflation Factor (ft )

Note: Blue solid (red dashed) line, aligned with the left axis, makes reference
to the median (16th and 84th percentile) of the posterior distribution estimates
obtained with the univariate model. Black dotted line, aligned with the right axis,
makes reference to the euro-area energy-related quarterly inflation expressed in
percentage points.

that omits any information on inflation co-movement in the euro
area. In particular, we estimate the effect of exchange rate shocks
on inflation for each country, independently, based on the following
univariate regression model subject to parameter time variation:

                   πi,t = φ̂i,t (L)πi,t−1 + β̂i,t ER
                                                   t  + v̂i,t ,              (11)

for i = 1, 2, . . . , n, and where the element of interest is given by the
dynamics of the ERPT coefficient β̂i,t .25
    The estimated time-varying ERPT across countries associated
with headline inflation is plotted in Figure B.4 of Online Appen-
dix B to save space. The findings indicate that the ERPT obtained
from the univariate models closely tracks the dynamics of the ERPT

  25
     Each univariate time-varying parameter regression is estimated indepen-
dently with Bayesian methods, assuming L = 1 for consistency with the multi-
variate approach. The estimation algorithm follows the corresponding simplified
version of the one described in Section A.1 of the online appendices, and follows
the same number of Gibbs sampling iterations and corresponding priors.
Figure 12. Sensitivity of Country-Specific Food-Related Inflation to
266
Exchange Rate Shocks Based on a Multivariate Model (β̃i,2,t )
International Journal of Central Banking
Note: Blue solid (red dashed) line makes reference to the median (16th and 84th percentile) of the posterior distribution
March 2022
estimates obtained with the univariate model.Figure 13. Sensitivity of Country-Specific Energy-Related Inflation to
Exchange Rate Shocks Based on a Multivariate Model (β̃i,2,t )
Vol. 18 No. 1
Exchange Rate Shocks and Inflation Co-movement
Note: Blue solid (red dashed) line makes reference to the median (16th and 84th percentile) of the posterior distribution
estimates obtained with the univariate model.
267Figure 14. Time-Varying Co-movement of Euro-Area
268
Countries’ Food-Related Inflation (γi,t )
International Journal of Central Banking
Note: Blue solid (red dashed) line makes reference to the median (16th and 84th percentile) of the posterior distribution
estimates obtained with the univariate model.
March 2022Figure 15. Time-Varying Co-movement of Euro-Area
Countries’ Energy-Related Inflation (γi,t )
Vol. 18 No. 1
Exchange Rate Shocks and Inflation Co-movement
Note: Blue solid (red dashed) line makes reference to the median (16th and 84th percentile) of the posterior distribution
estimates obtained with the univariate model.
269270 International Journal of Central Banking March 2022
Figure 16. Time-Varying Coefficients of
Model for Food-Related Inflation
Note: Blue solid (red dashed) line makes reference to the median (16th and 84th
percentile) of the posterior distribution estimates obtained with the univariate
model.
Figure 17. Time-Varying Coefficients of Model for
Energy-Related Inflation
Note: Blue solid (red dashed) line makes reference to the median (16th and 84th
percentile) of the posterior distribution estimates obtained with the univariate
model.
Table 1. Summary of Exchange Rate
Pass-Through to Inflation
Headline Core Food Energy
√ √
Total Pass-Through √ — — √
Country-Specific Component — — √
Regionwide Component — — —
Note: The table summarizes the main results from the empirical analysis. An entry
√
with “ ” indicates that there has been a significant increase in the total exchange
rate pass-through, or its components, to the corresponding type of inflation. An entry
with “—” indicates that there has not been a significant increase in the total exchange
rate pass-through, or its components, to the corresponding type of inflation.Vol. 18 No. 1 Exchange Rate Shocks and Inflation Co-movement 271
obtained from the proposed multivariate approach. This is the case
for almost all the euro-area countries, with the only exceptions being
Malta and Finland. In the case of core inflation, although the esti-
mates obtained from the two approaches do not always look similar,
the ERPT estimates from the univariate models point to the same
message as that provided by the multivariate model, which is that
the sensitivity of core inflation to exchange rate shocks tends to be of
a smaller magnitude and, more importantly, the estimates tend to be
more uncertain (Figure B.5).26 Lastly, regarding the food and energy
subcomponents of headline inflation, the estimates from univariate
models also follow a similar path to the estimates from the multi-
variate model, as shown in Figures B.6 and B.7, respectively. These
findings evidence that while independent univariate regressions can
only measure the degree of sensitivity of euro-area countries’ infla-
tion to exogenous exchange rate shocks, the proposed factor model is
able to perform the same task, while also providing a decomposition
of such sensitivity into country-specific and regionwide effects.
4. Concluding Remarks
This paper proposes an innovative approach that should improve
our ability to assess the effect of exchange rate fluctuations on
prices across countries—especially from a time-varying and cross-
country unified perspective—and by taking into account the source
of exchange rate changes.
To this end, we decompose into a country-specific and regionwide
component the time-varying effect that unexpected movements in
the EUR/USD nominal exchange rate have on different measures of
inflation in the euro-area countries. Of all the sources of exchange
rate fluctuations, this paper focuses only on exogenous exchange rate
shocks. This is partly because we seek to imitate insofar as possi-
ble the concept of exchange rate pass-through in a shock-dependent
context: we isolate the transmission to prices of “pure” exchange
26
When adding information on lagged shocks as additional explanatory vari-
ables in Equation (11), we find that the associated time-varying coefficients are
not statistically significant. This is the case for both headline and core inflation
rates. These results are not shown for the sake of space, but are available upon
request.272 International Journal of Central Banking March 2022
rate shocks from the joint reaction of prices and exchange rates to
other structural shocks such as demand, supply, or monetary policy
shocks.
We propose an econometric framework that relies (i) on an SVAR
model to identify purely exogenous exchange rate shocks; and (ii) on
a dynamic factor model subject to drifting coefficients and exoge-
nous information to identify the pass-through to inflation of such
exogenous exchange rate shocks. The estimates suggest that exoge-
nous shocks to the EUR/USD are paramount. They are behind more
than 50 percent of the nominal EUR/USD exchange rate fluctuations
in more than a third of the quarters of the past six years, especially
in turning-point periods.
Our main findings indicate that headline inflation, and in partic-
ular its energy component, has become significantly more affected
by these exogenous exchange rate shocks since the early 2010s, espe-
cially in the largest economies of the region. While in the case of
headline inflation this increasing sensitivity is solely reliant on a
sustained surge in the degree of co-movement, in the case of energy
inflation it is also based on a higher regionwide effect of the shocks.
The effect of exogenous exchange rate shocks in food inflation is
similar to, but much lower than, the impact on headline inflation.
By contrast, purely exogenous shocks do not seem to have a signif-
icant effect on the core component of headline inflation, which also
displays a lower degree of co-movement across euro-area countries.
The information obtained with this type of decomposition can
be useful for policymakers to understand the extent to which move-
ments in inflation of a given country, brought about by exchange
rate shocks, can be attributed to its exclusive and intrinsic eco-
nomic performance or to the overall performance of all monetary
union partners. In particular, the documented sustained surge in the
degree of inflation co-movement would represent a favorable feature
for the conduct of monetary policy.
The framework described here is not intended or able to cap-
ture structural differences across countries that are key to explain-
ing different impacts of exchange rate movements, such as the role
of invoicing currency, whether the transactions take place between
or within firms, the frequency and dispersion of price adjustments,
integration in global value chains, or the role of competition in
final product markets, but it still adds an important new dimensionYou can also read