Expanding the time dimension of hyperspectral infrared sounding observations: Designing the NUCAPS-Forecast system
←
→
Page content transcription
If your browser does not render page correctly, please read the page content below
Expanding the time dimension of hyperspectral
       infrared sounding observations:
   Designing the NUCAPS-Forecast system
      Emily Berndt1, Brian Kahn,2 Jonathan L. Case1,3, Peter M. Kalmus 2,
                    Mark T. Richardson 2, Kevin K. Fuell 1,4

          1NASA MSFC Short-term Prediction Research and Transition Center
                             2Jet Propulsion Laboratory

                                     3ENSCO, Inc.

          4Earth System Science Center, University of Alabama in Huntsville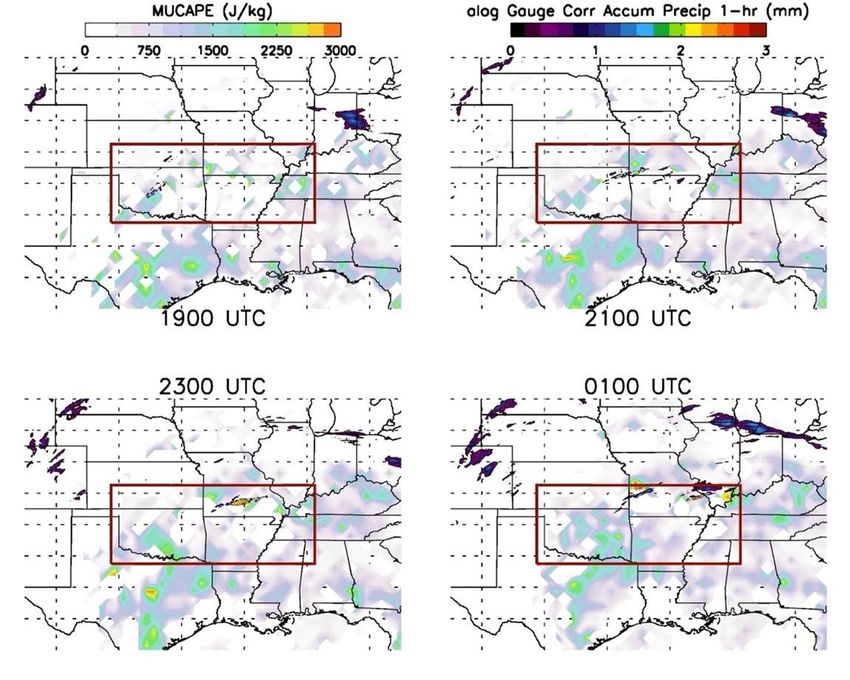
Motivation
• Low Earth Orbit (LEO) hyper-spectral infrared (IR) sounders only measure the atmosphere when
satellites pass overhead, with multi-hour data gaps between overpasses.
• This project developed a novel methodology to fill the time gaps by moving retrieved air parcels
leveraging trajectory modeling and numerical weather prediction (NWP) winds.
• This presentation describes the method, improved convection predictions, and ongoing work.
Timely delivery of data products
Increasing observations A roadmap for the future
• Modify a science system for
• What is the value of increasing operations • Inform the potential
temporal resolution and forecasting value of a
spatial coverage • The cross-benefit of science geostationary sounder
and applications
Science to Applications
• Kalmus et al. (2019) developed an approach to expand
  the time dimension of LEO IR sounding retrievals
  through use of the Hybrid Single-Particle Lagrangian
  Integrated Trajectory model (HYSPLIT; Stein et al. 2015)

• The method was developed with NASA's Atmospheric
  Infrared Sounder (AIRS) version 6 retrievals to create
  proximity soundings near severe weather reports after
  the 130 pm Aqua overpass

• The retrospective trajectory model approach is driven
  by Numerical Weather Prediction wind fields that treat
  individual sounding layers as distinct air parcels,
  conserved along moist or dry adiabats

• This retrospective approach was adapted to a real-time
  forward trajectory approach utilizing low-latency                  NUCAPS Forecast
                                                             Data fusion and trajectory modeling applied to
  NASA/NOAA JPSS Series CrIS/ATMS sounding retrievals         extend the time-dimension of observations
  processed through the NOAA Unique Combined
  Atmospheric Processing System (NUCAPS) algorithm.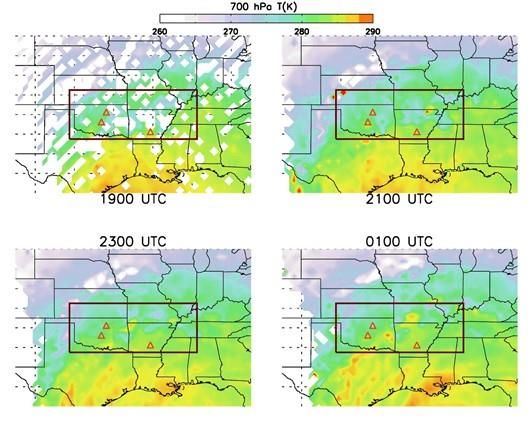
NUCAPS Products Life Cycle
•   Since 2015, collaborators in the Joint Polar Satellite System (JPSS) Sounding Initiative have introduced
    Hyperspectral Infrared Sounders (S-NPP, NOAA-20, MetOp-A/B) to NOAA NWS forecasters through the
    NOAA Hazardous Weather Testbed Spring Experiment

•   Operations-to-research feedback has led to further development of products and capabilities to tailor
    sounding products to meet the needs of the operational environment

              Modified                Low Latency                 Enhanced L2                 NUCAPS
              NUCAPS                     Data                       Products                  Forecast
                                                                 Gridded NUCAPS allows
              Boundary layer           Providing Soundings                                     Data fusion and
                                                                   for quick analysis of
            modification gives          through CSPP direct                                 trajectory modeling
                                                                  spatial gradients and
             forecasters more        broadcast has increased                               applied to extend the
                                                                  expands the range of
          confidence in the lower     the data availability to                               time-dimension of
                                                                    available derived
          portion of the retrieval     less than 60 minutes                                     observations
                                                                         products

•   A consistent message from forecasters is the need for more satellite soundings delivered with low latency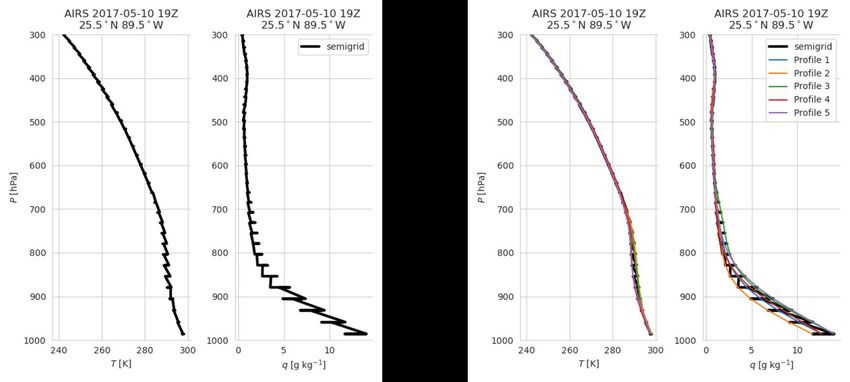
NUCAPS-Forecast
• The experimental product, NUCAPS-Forecast, was run in real-time in spring 2019 and 2021 for testing
  and feedback at the NOAA Hazardous Weather Testbed (Esmaili et al. 2020).

• Operations-to-Research feedback from National Weather Service forecasters during the 2019 and
  2021 NOAA Hazardous Weather Testbed Spring Experiment has led to improving the product and
  processing system to address product limitations and improve its applicability for pre-convective
  forecasting.

• NUCAPS-Forecast will be expanded based on Gridded NUCAPS (Berndt et al. 2020) to plot additional
  fields such as lapse rates, precipitable water, temperature, and relative humidity to expand the base
  products beyond stability indices.

                                                    Steps to Process NUCAPS-Forecast Version 1
      The 0.25-degree GFS forecast data are downloaded as HYSPLIT-formatted files from the Air Resources Laboratory and NUCAPS L2 Environmental Data Records
                are obtained from direct broadcast sites and accessed through the Space Science and Engineering at the University of Wisconsin Madison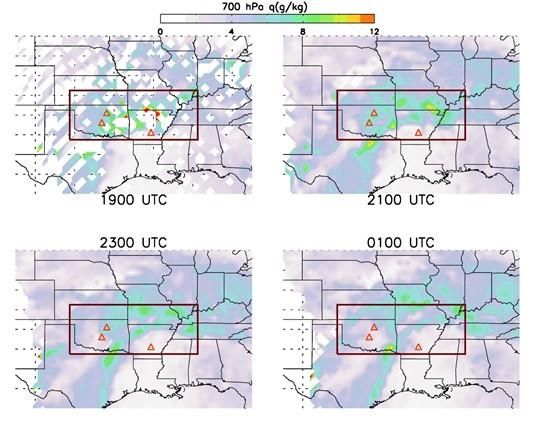
Key Improvements to NUCAPS-Forecast
• NUCAPS-Forecast is undergoing development to improve product utility and usability in key areas to address
  end user feedback
   • reducing data gaps
   • vertically gridding scattered parcels
   • improving the LCL calculation and application of dry and moist adiabatic lapse rates
   • correcting unrealistic CAPE values
   • improving the quality of vertical profiles
   • adding a map of parcel counts to give users confidence in the product

     NUCAPS-Forecast                                                                     NUCAPS-Forecast
        Version 1                                                                           Version 2
Key Improvements to NUCAPS-Forecast
• NUCAPS-Forecast is undergoing development to improve product utility and usability in key areas to address
  end user feedback
   • reducing data gaps
   • vertically gridding scattered parcels
   • improving the LCL calculation and application of dry and moist adiabatic lapse rates
   • correcting unrealistic CAPE values
   • improving the quality of vertical profiles
   • adding a map of parcel counts to give users confidence in the product

                                          NUCAPS-Forecast
                                         NUCAPS-Forecast
                                             Version 2
                                            Version 1
Key Improvements to NUCAPS-Forecast • NUCAPS-Forecast is undergoing development to improve product utility and usability in key areas to address end user feedback • reducing data gaps • vertically gridding scattered parcels • improving the LCL calculation and application of dry and moist adiabatic lapse rates • correcting unrealistic CAPE values • improving the quality of vertical profiles • adding a map of parcel counts to give users confidence in the product
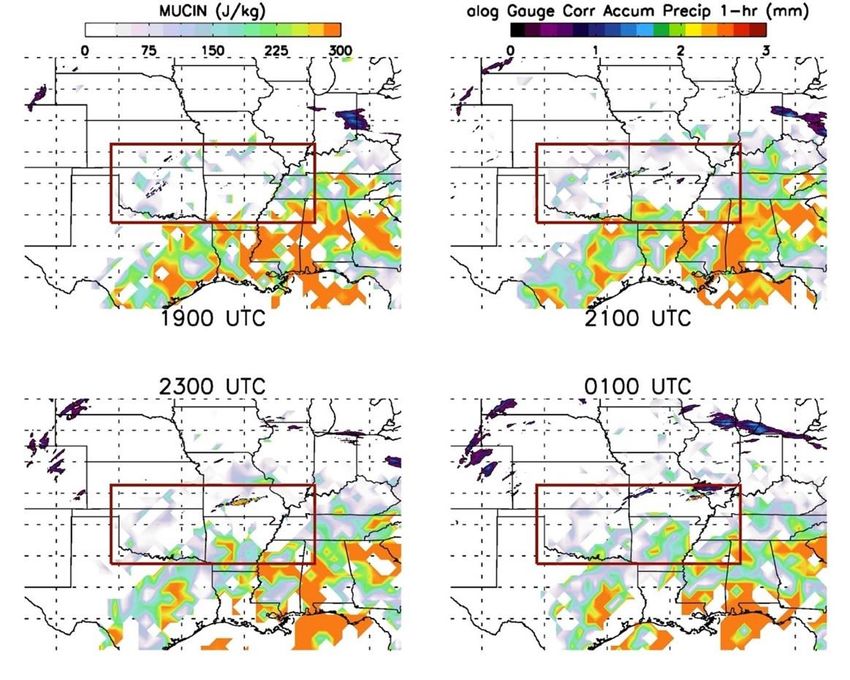
NUCAPS-Forecast Version 2 Examples
• Storms produced high wind, hail, and tornadoes
  in the southern Midwest on 27-28 March 2020

• Example NUCAPS-Forecast maps show the ability
  of NUCAPS-Forecast to capture the environmental
  conditions leading to convection

• Thermodynamic fields, 700 hPa temperature and
  specific humidity, capture gradients consistent
  with :
    • a stationary front extending from southeast Colorado,
      through northern Oklahoma, and central Missouri
    • a dry line oriented north-south over west Texas
NUCAPS-Forecast Version 2 Examples • Stability indices, Most Unstable CAPE and CIN, derived from NUCAPS-Forecast are compared with MRMS Gauge Corrected Accumulated Precipitation. • Areas of heavy precipitation occur in regions of high horizontal gradients in CAPE • Much larger values of CIN found where no rainfall occurred • The magnitudes, spatial gradients, and temporal changes in NUCAPS-Forecast CAPE and CIN are qualitatively consistent with the time and location of convective rainfall. • Kahn et al. (2022) investigates 24 case studies to determine the ability of NUCAPS-Forecast CAPE and CIN to indicate the likelihood of convection.
Summary
     • Application of trajectory modeling to LEO IR soundings for the purpose of expanding the time
       resolution and spatial coverage of observations derived from polar-orbiting satellites adds value
       to assessing the pre-convective environment.

     • Expanding observations out 6 hours in time provides hourly observations that can serve as a proxy
       to determine the benefit of a future sounder in geostationary orbit onboard GeoXO.

     • Product improvements and additional fields will be tested and assessed with NWS forecasters at
       the 2023 NOAA HWT Spring Experiment

     • Example NUCAPS-Forecast plots demonstrate the product's ability to represent characteristics of
       the pre-convective environment such as temperature and moisture gradients and areas of CAPE
       that correlate with heavy precipitation.

     • Kahn et al. (2022) expands further on the ability of NUCAPS-Forecast to indicate the likelihood of
       convective initiation by comparing CAPE and CIN to MRMS precipitation for 24 case studies.

This presentation represents work funded by the NOAA Joint Polar Satellite System Proving Ground/Risk Reduction Program This work was also supported by the NASA
        Research and Analysis Program as part of the Short-Term Prediction Research and Transition Center (SPoRT) project at the Marshall Space Flight Center
References Berndt, E. B., N. Smith, J. Burks, K. White, R. Esmaili, A. Kuciauskas, et al., 2020: Gridded Satellite Sounding Retrievals in Operational Weather Forecasting: Product Description and Emerging Applications. Remote Sensing, 12, 3311, https://doi.org/10.3390/rs12203311 Esmaili, R.B., N. Smith, E. B. Berndt, J. F. Dostalek, B. H. Kahn, K. White, and C. D. Barnet, W. Sjoberg, and M. Goldberg, 2020: Adapting Satellite Soundings for Operational Forecasting within the Hazardous Weather Testbed. Remote Sens., 12, 886. https://doi.org/10.3390/rs12050886 Kahn, B. H, E. B. Berndt, J. L. Case, P. M. Kalmus, M. T. Richardson, 2022: A nowcasting approach for low Earth orbit hyperspectral infrared soundings within the convective environment. Wea. Forecasting, in review. Kalmus, P., B. H. Kahn, S. W. Freeman, and S. C. van den Heever, 2019: Trajectory-Enhanced AIRS Observations of Environmental Factors Driving Severe Convective Storms. Mon. Wea. Rev., 147, 1633–1653, https://doi.org/10.1175/MWR-D-18-0055.1
You can also read