Exploring the causes and repair measures of early cracks in prefabricated bridges
←
→
Page content transcription
If your browser does not render page correctly, please read the page content below

IOP Conference Series: Earth and Environmental Science

PAPER • OPEN ACCESS

Exploring the causes and repair measures of early cracks in
prefabricated bridges
To cite this article: Han Suqin 2021 IOP Conf. Ser.: Earth Environ. Sci. 825 012032

View the article online for updates and enhancements.

                               This content was downloaded from IP address 46.4.80.155 on 26/09/2021 at 18:41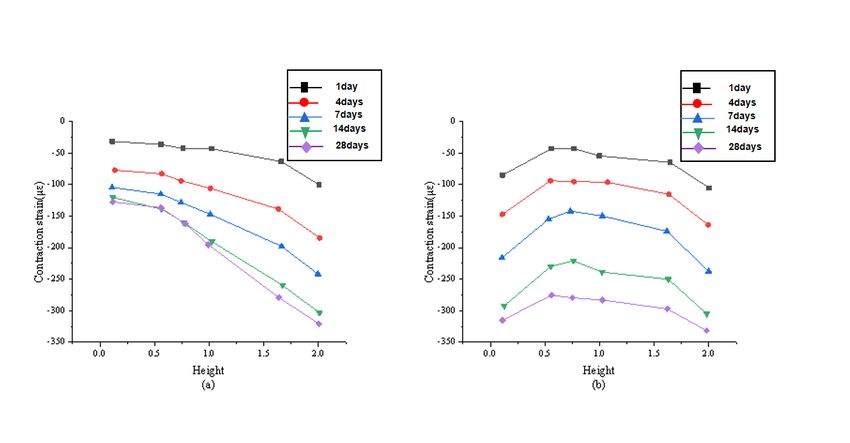
ESEPCE 2021                                                                                                    IOP Publishing
IOP Conf. Series: Earth and Environmental Science 825 (2021) 012032                        doi:10.1088/1755-1315/825/1/012032

Exploring the causes and repair measures of early cracks in
prefabricated bridges

                     Han Suqin1, *
                     1
                      Shandong transport vocational college, Taian, Shandong, 271000, China
                     *webmaster@sdu.edu.cn

                     Abstract: The study aims to explore the causes of early cracks in prefabricated bridges and
                     propose repair measures. The stude designs a test first. Analysis of the mix proportion and
                     uneven shrinkage of concrete shows that, in concrete, the ratio of air content to water-binder is
                     a quadratic parabola, the fly ash and water binder ratio have a linear relationship, and slurry
                     collection ratio and the water-binder ratio is inversely proportional. The test results suggest that
                     the cracks of bridges are caused by the decrease of relative humidity in concrete. Afterward,
                     some corresponding repair measures are put forward to safeguard the prefabricated bridges.

1. Introduction
In the deck construction of the prefabricated bridges, there are many schemes for the concrete
construction of the deck, which can be roughly divided into two types: Cast-in-place and Prefabricated.
The main construction steps of cast-in-place are: first, the protective formwork is erected at the
construction site and then inset reinforcement to fix it; finally, the concrete is poured, and the concrete
will be maintained and removed from the forms[1,2]. Although the overall effect of this construction is
good, it is slightly tedious and it takes a long time. If there is an emergency construction request, it is
inevitable to delay the project delivery[3]. Relatively speaking, using prefabricated concrete to cover
the bridge deck avoids some defects of cast-in-place to a large extent, but there are also shortcomings.
As the overall structure of the prefabricated bridge is composed of scattered segments, its mechanical
performance is relatively weaker compared with the cast-in-place bridge, so it is not suitable to use in
some earthquake-prone areas such as Sichuan, Guizhou and Yunnan in the construction process [4,5].
    Wang Xuzhong(2021) The application advantages of prestress technology in the field of municipal
highway bridge construction gradually appear. The application of this technology is conducive to
improving the strength of the bridge structure, it takes into account the relationship between the whole
bridge and the detail components, and ensures the bridge a high traffic service level [6]. Teng et al.
(2021) compared the crack detection performance (precision and calculation amount) under 11 feature
extraction methods, which provided a basis for the rapid and accurate detection of cracks in concrete
structures[7]. Balzano et al. (2019) proposed a new healing system using pre-tensioned mixed tendons
to seal the cementation content of cracks[8].
    This paper mainly studies the prefabricated bridge, analyzes the early concrete cracks of
prefabricated bridge, and understands the cracking time of concrete, the main form and characteristics
by means of rural research. Based on this, through designed experiment, the paper discusses the reason
of the early concrete cracks of prefabricated bridge caused by the mix parameters such as water-binder
ratio, fly ash, gas content and aggregate-to-cement ratio, and also discusses the corresponding repair
measures. The innovation of this study is to comprehensively consider the water binder ratio, fly ash

              Content from this work may be used under the terms of the Creative Commons Attribution 3.0 licence. Any further distribution
              of this work must maintain attribution to the author(s) and the title of the work, journal citation and DOI.
Published under licence by IOP Publishing Ltd                          1
ESEPCE 2021 IOP Publishing
IOP Conf. Series: Earth and Environmental Science 825 (2021) 012032 doi:10.1088/1755-1315/825/1/012032
replacement rate, air content, slurry ratio and other factors.It is hoped that the research of this paper
can help solve the problems of early cracks in bridge construction and improve the safety of bridge in
the future.
2. Research on crack of prefabricated bridge
2.1 Contraction test of prefabricated bridge
The concrete contraction test of the prefabricated bridge took 28 days from casting to completion.
Since the concrete can not be demoulded due to its low strength at the initial setting stage, the
generation of early cracks on bridge deck will be greatly influenced by the fixed model in the initial
setting stage [9]. Considered this factor and in order to effectively reduce influence of the mold
constraints, we use flexible bellows. A major advantage of this kind of pipe is that its axial
deformation ability is better than that of the radial direction. Fig. 1 is a schematic diagram of concrete
crack deformation based on the bellows. When the radial deformation of the bellows is not taken into
account, the length deformation of the bellows can be used to replace the volume deformation, as
shown in Equation (1). Variables in the equation are shown in Figure 1 [10,11]. So in the early stage of
concrete setting, the length deformation can be used to replace the volume deformation. The bellow
used in the test is 100mm and length is 400mm, the deformation crack of concrete is detected by dial
indicator[12].
VABCD − VA1B1CD L1 − L2
V= = = L
VABCD L1 (1)
A B
A1 B2
C D
L1
L2
Fig. 1 Deformation diagram of concrete of prefabricated bridge
In the actual bridge construction process, the bridge deck must be maintained for three days after
the concrete is poured, and the formwork can only be removed after three days. In this experiment, the
actual environment should be fully simulated and as close to the actual construction site as possible.
Therefore, the initial setting time of concrete in the experiment was set as 3 days. After 3 days, the
bellow mold was removed and the concrete deformation was detected at the same time, and the
detection interval of contraction deformation was 2 hours[13]. In order to eliminate interference of the
friction resistance of bellow and the platform for the research results, the test platform was 5°upward,
then the test platform was analyzed and made force balance with the friction resistance. What’s more,
there are three parallel specimens in each group, to improve the accuracy of test results [14]. The test
will last 30 days in total. The temperature of this test is 25℃, the error is less than 1℃, and the
relative humidity is 60%, the error is less than 2%.
According to the guidance of relevant literature, the deformation of the bridge deck concrete in this
test is not only affected by the mold, but also by temperature. Therefore, to improve the accuracy of
the research results, the temperature factor should also be taken into account. Formula (2) is the
2ESEPCE 2021 IOP Publishing
IOP Conf. Series: Earth and Environmental Science 825 (2021) 012032 doi:10.1088/1755-1315/825/1/012032
formula that deformation caused by temperature change (εT).
T
T (t) = dT
T0
(2)
In Formula 2: εT represents the temperature deformation of concrete, α represents the thermal
expansion coefficient(CTE) of concrete, T is the real-time temperature of concrete at time t, and T0
represents the temperature of concrete when it is poured on bridge deck [15]. According to relevant
literature, the thermal expansion coefficient is not a fixed value, which changes with the time influence,
and can be calculated according to Equation (3).
0.3teq
= 132exp(− )+7
d (3)
t 1 U U aT
teq = exp at − dt
0
R 293 273 + T (4)
U a = (42830 − 43T) exp((−0.00017 T) t)
(5)
In above formula, teq represents the equivalent age of concrete, it is influenced by the temperature,
and Equation (4) shows the influence result; T represents the most appropriate temperature for bridge
deck cure. R represents the gas constant in concrete, and it is 8.314J/(mol·K) in standard situation. Uat
represents the activation energy generated by hydration reaction of cement at a certain temperature.
UaT represents the activation energy generated by the reaction at T temperature [16]. Ua represents the
function of time and temperature in this experiment, which can be approximately expressed by
Equation (5). Formula (6) is the water-binder ratio; Formula (7) is fly ash substitution rate; Formula (8)
is the gas content; Formula (9) is the aggregate-to-cement ratio.
y = 1100e−3.2(w/cm) (6)
y = 0.8(FA) + 1 (7)
y = −0.04(AC) + 0.35(AC) − 0.66
2
(8)
−1.12
y = 3.56 J (9)
w/cm: water-binder ratio; FA: fly ash substitution rate; AC: gas content; J: aggregate-to-cement
ratio.
On the basis of the original experiment, there are two more influence coefficients: gas content and
aggregate-to-cement ratio. Now the experiment can fully reflect the influence of age, water-binder
ratio, fly ash substitution rate, gas content and aggregate-to-cement ratio on the bridge deck concrete,
then the causes of early cracks in prefabricated bridge can be obtained[17]. The influence of above
mentioned factors on concrete contraction and deformation can be calculated by
Equations(11)~Equations(15).
AS (t) = (1 + ) 28 (w/ cm) (t) (10)
28 (w/ cm) = 1100 exp[−3.2(w/ cm)] (11)
(t) = 1 − exp(qt p ) (12)
= a(AC) 2 + b(AC) + c (13)
= 1 − k (FA) (14)
= n(J) m
(15)
εAS (t) is the contraction strain of concrete at the time of t, ε28(W /cm) is the contraction strain of
concrete in day 28, as shown in Equation (11), W /cm represents the ratio of concrete water to
cementing materials; β(t) represents the change index between the concrete of the bridge deck and the
3ESEPCE 2021 IOP Publishing
IOP Conf. Series: Earth and Environmental Science 825 (2021) 012032 doi:10.1088/1755-1315/825/1/012032
time when the contraction strain occurs; γ is the influence coefficient of gas content on concrete
contraction strain; AC represents the gas content, and a, b and c represent constants respectively, they
all are related to the type of cementitious materials and air entraining agent; α is the influence
coefficient of cement type and fly ash, FA is the replacement rate of fly ash in bridge; q and p are
constants, related to cement and fly ash; η is the influence coefficient related to the
aggregate-to-cement ratio, m and n are the constants of bridge aggregate and cementitious material; t
is the age of concrete.
2.2 Uneven contraction of concrete in prefabricated bridges
In practical engineering, the concrete is affected by the constraint of environmental conditions, which
causes the uneven contraction and deformation of the concrete components on the same section and
such uneven contraction deformation is often ignored by people [18]. In bridge, for example, for box
girder, the large geometric size of the components and the different sizes in different positions may
cause the contraction deformation of box girder in different places. Rate is not consistent with the
influence of external environment, which will also cause the uneven contraction deformation of the
whole box girder. During the contraction process, the small size of laboratory test specimens can be
assumed to be uniform contraction. Strictly speaking, the early dry contraction of concrete
components starts from the surface and develops from outside to inside, so the bridge concrete has
uneven deformation [19]. Therefore, based on the expression of uniform contraction of concrete, it is
more practical significant to test the uneven contraction of concrete components and analyze the
contraction distribution to control early contraction cracks. This research will study the concrete
contraction under different environments, mainly divided into single drying and integral drying, and
discuss the influence of curing conditions on uneven contraction.
In order to fully reflect the uneven concrete contraction in the early and middle stage of
prefabricated bridges, the platform structure size and the production of the test component should be
considered in the test summary, the design size of the test component is 1m long, 0.5m wide and
0.2mm high. The tests were carried out after 5 hours when the initial setting of the concrete. The
indoor environmental conditions were temperature 22.3℃~25.2℃ and relative humidity
59.5%~65.1%RH. The contraction under single drying and integral drying were both considered and
compared the contraction results under single drying[20]. The unilateral constraint used in this paper are
the most common in the process of bridge construction.
3. Analysis and optimization
3.1 Analysis of concrete mix design of prefabricated bridge
Fig. 2 shows the contraction change of prefabricated bridge within 30 days after initial setting.
FA20-550
FA20-500
FA20-480
0 FA20
FA20-400
-100
Contraction strain(με)
-200
-300
-400
-500
0 5 10 15 20 25 30
Time/d
Fig. 2 The contraction change of prefabricated bridge within 30 days after initial setting.
Based on the analysis of the changes in Fig.2, the influences of such parameters as age,
water-binder ratio, gas content, fly ash substitution rate and aggregate-to-cement ratio on the early
4ESEPCE 2021 IOP Publishing
IOP Conf. Series: Earth and Environmental Science 825 (2021) 012032 doi:10.1088/1755-1315/825/1/012032
contraction was obtained, and the corresponding regression curves was drawn as below Fig. 4.
500
0.14
400 0.12
Contraction strain(με)
0.10
300
0.08
γ
200 0.06
0.04
100
0.02
0 0.00
0.30 0.35 0.40 0.45 4.0 4.5 5.0 5.5 6.0 6.5 7.0
Water binder ratio Air content
(b)
(a)
1.0
1.4
0.8 1.2
1.0
0.6
α
0.8
η
0.4 0.6
0.4
0.2
0.2
0.0 0.0
0 10 20 30 40 50 60 2.2 2.4 2.6 2.8 3.0 3.2 3.4 3.6 3.8
Replacement rate of fly ash (%) Collection ratio
(c) (d)
Fig. 3 Bar of concrete parameters effect on contraction
(a: Regression coefficient of water-binder ratio; B: The influence of gas content; C: The influence
of fly ash substitution rate; D: Influence of aggregate-to-cement ratio)
Based on above graph changes and numerical regression, it can be concluded that the relation
between gas content and water-binder ratio presents a quadratic parabola change, the fly ash is
correlated linearly with water-binder ratio; the aggregate-to-cement ratio is inversely proportion to the
water-binder ratio. It is also found that the concrete initial setting time of the prefabricated bridge
occurs after the contraction strain, and the contraction deformation occurs in the next three days, and
the dry contraction occurs in the next three days. These changes are basically consistent with the
curing time of the bridge concrete in the actual engineering.
3.2 Analysis of uneven contraction in prefabricated bridge
In the study of early contraction deformation of prefabricated bridge in a dry environment, when the
casting temperature is 19℃, the internal temperature of concrete becomes higher and higher over time
due to the influence of hydration reaction. When the concrete was poured for one day, the internal
temperature reached its maximum of 33.5 °C, the centra temperature of the concrete was 38 °C, and
the bottom temperature was 36 °C. After the hydration reaction, the cement will gradually let heat out,
so that the internal temperature of the concrete gradually decreases. After about 4 days, the internal,
bottom and center temperatures of the concrete are basically consistent with the external environment,
as shown in Fig. 4.
5ESEPCE 2021 IOP Publishing
IOP Conf. Series: Earth and Environmental Science 825 (2021) 012032 doi:10.1088/1755-1315/825/1/012032
Core
40 Core 100
Bottom
Bottom
35 Surface wend
Surface 95
30
Relative humidity
90
Temperature
25
85
20
80
15
75
10
5 70
0 65
0 1 2 3 4 5 6 0 5 10 15 20 25 30 35
Time/d Time/d
(a) (b)
Fig. 4 Changes of Temperature and Humidity of bridge concrete
(a: Early temperature rise of single-sided prefabricated bridge concrete; b: Variation in humidity of
single-sided prefabricated bridge concrete)
According to Fig.4, it can be found that: uneven contraction strain and cracks are happened because
after first contact with the external environment, the surface humidity is in dissipating. After the
moisture-transfer ability of concrete declines, it will cause bridge inside contraction eventually lead to
the generation of cracks, so the higher of the bridge is, the weaker moisture-transfer ability it has.Fig.
5 is the contraction strain in dry environment.
Fig. 5 Contraction strain of deck concrete under different conditions
(a: Contraction strain of bridge concrete under single dry; B: Contraction strain of bridge concrete
under integral drying)
When the environment is dry, the concrete surface will exchange temperature and humidity with
the outside world. From Fig.5, it is obvious that there is no big contraction strain between the upper
surface and the bottom surface of the deck concrete, which is between 9με and 19με. The reason for
the contraction difference is that the deck is close to the bottom, so the humidity exchange is not as
fast as that of the upper surface. Therefore, the minimum contraction strain occurs at the height of
about 0.08m, but does not occur at the most central position. The maximum contraction difference of
the concrete in dry conditions occurred seven days later after casting, which was nearly 35% less than
that of the single-sided concrete in the same period. The contraction difference of the concrete itself is
6ESEPCE 2021 IOP Publishing
IOP Conf. Series: Earth and Environmental Science 825 (2021) 012032 doi:10.1088/1755-1315/825/1/012032
also decreasing, so in order to better control the early crack on bridge deck, the single-side drying
method can be used to reduce the contraction difference of the concrete.
4. Discussion
This study carried out experiments focus on the causes of cracks in early stage of prefabricated bridge
(concrete mixture and uneven contraction), and propose suggestions to avoid the cracks rising in early
stage of prefabricated bridge and guaranteed the safety of the prefabricated bridge: A. Improve the
road and bridge design. Before design, to ensure the design rationality, a professional team can be sent
to inspect the nearby environment according to the design requirements. B. Optimize the bridge
construction process by cooling raw materials. When processing the bridge steel, a professional team
must be on site and monitor the process. The process should be carried out strictly following the
drawings. Perfect protection plan and surface protection should be carried out according to the actual
casting requirements, and concrete temperature and humidity should be strictly controlled. C.
Reasonable load control. The designers must investigate on-site before design. After making a
comprehensive evaluation of the surrounding terrain and climate, the plan is determined to make the
layout and load of the bridge meet the requirements.
5. Conclusion
In this paper, the object of the research is concrete of prefabricated bridge, based on the concrete
mixture and uneven contraction experiment, the causes of early cracks are obtained. The results show
that the relation between gas content and water-binder ratio is a quadratic parabola, fly ash and
water-binder ratio have a linear relation, and the relation between slurry ratio and water-binder ratio is
inversely proportional. It is also found that decrease of relative humidity in concrete is the direct factor
that causes early contraction. The early contraction crack of concrete can be controlled by integral
drying and single drying method. The safety of the bridge can also be guaranteed by improving the
construction design of the road and bridge, reasonably optimizing the construction process of the road
and bridge and reasonably controlling the load of the bridge. However, this study also has shortage,
because the occurrence of early crack in bridge concrete is directly related to the average thickness of
mortar. The thickness of mortar can not be determined in the design of concrete mix,so it should be
further studied in the same type of research in the future.
About the author
Han Suqin (1979-),female,from Qingzhou, Shandong Province, lecturer, doctor, research direction:
Road and bridge engineering technology.
References:
[1]Yu Z.W, Shen Y.G, Shen C.K. A Real-time Detection Approach for Bridge Cracking Based on
Yolov4-FPM. Automation in Construction, 20121,122: 103514
[2]Li L, Zhao X.X, Du K, et al. Recognition and evaluation of bridge cracks with modified active
contour model and greedy search-based support Vector machine. Automation in
Construction,2017,78:51-61
[3] Liu Fuwei. Research on Difficulties and Technologies in Road, Bridge and Tunnel Construction
Equipment. Equipment Management and Maintenance, 211, 6:117-119.
[4]Gherardi F, Otero J, Blakeley R, et al. Application of Nanolimes for the Consolidation of Limestone
from the Medieval Bishop's Palace, Lincoln, UK. Studies in Conservation,20,65. 90-97.
[5]Zhao S.Q, Li G.F. Analysis on the Causes of Cracks in Curved Box Girder Bridges with Small
Radius. IOP Conference Series: Earth and Environmental Science,2020,510(5). 052069
[6] Wang Xuzhong. Prestress treatment technology in highway bridge construction. Smart City,
211,7(06): 25-26.
[7]Teng S, Liu Z.C, Chen G.F, et al. Concrete Crack Detection Based on Well-Known Feature
Extractor Model and the YOLO_v2 Network. Applied Sciences, 2021, 11 (2) : 813-813
7ESEPCE 2021 IOP Publishing
IOP Conf. Series: Earth and Environmental Science 825 (2021) 012032 doi:10.1088/1755-1315/825/1/012032
[8]Balzano B, Sweeney J, Thompson G, et al. Enhanced concrete crack closure with hybrid shape
memory polymer tendons. Engineering Structures, 2021, 226 (2019) : 111330.
[9]Kim Y J, Solanki M. Post-Peak crack control of concrete with BFRP grids. Construction and
Building Materials, 2021, 282 (2) : 122716.
[10] Yuan Ming, Cheng Xiaodong, Huang Lian, Yan Donghuang, Liu Yun. Fractal and Wavelet Packet
Synthetic Analysis of Acoustic Emission Signals in Concrete Bridge Crack Propagation
Process. Journal of Chang 'an University, 201,41(02): 34-45.
[11] Hu Jie. Causes of Cracks in Road and Bridge Construction and Prevention Countermeasures.
Smart City, 201,7(06): 152-153.
[12]Xu J, Peng C, Wang G, et al. A multi-phase scale simulation of electrochemical chloride extraction
in crack-self-healing concrete. Structural Concrete, 2021, 5:1-17.
[13]Zhang G R, Wang X D, Han J K, et al. Relationship Study and Primary Application between Gas
Permeability and Crack State on Bridge Joint Concrete. Materials Science Forum, 2021,
1018: 153-161.
[14] Zhang Zhiqiang. Research on control key points and technical countermeasures in road and
bridge engineering construction. Green Building Materials,2021(03): 96-97.
[15]Fan Y, Du H, Wei H. Characteristics of Soybean Urease Mineralized Calcium Carbonate and
Repair of Concrete Surface Damage. Journal of the Wuhan University of Technology-Mater.
Sci. Ed. 2021, 36(1): 70-76.
[16]Chen X, Li J, Huang S, et al. An Automatic Concrete Crack-Detection Method Fusing Point
Clouds and Images Based on Improved Otsu's Algorithm. Sensors, 2021, 21(5): 1581.
[17]Tian F R, Zhao Y, Che X.Q. Concrete Crack Identification and Image Mosaic Based on Image
Processing. Applied Sciences, 2019, 9(22): 4826.
[18] Duan Shengtao. Analysis of difficulties and countermeasures in road, bridge and tunnel
construction. R, 2021, 9:31-32.
[19]Wu C, Sun K, Xu Y, et al. Concrete crack detection method based on optical fiber sensing network
and micro bending principle. Safety Science, 2019, 117(8): 299-304.
[20]Byunghyun K, Image‐based concrete crack assessment using a mask and region‐based
convolutional neural network. Structural Control and Health Monitoring, 2019, 26(8):
E2381.1-E2381.15.
8You can also read