Extraction of Positional Player Data from Broadcast Soccer Videos
←
→
Page content transcription
If your browser does not render page correctly, please read the page content below
Extraction of Positional Player Data from Broadcast Soccer Videos

                                                                  Jonas Theiner1           Wolfgang Gritz1              Eric Müller-Budack2

                                                                     Robert Rein3           Daniel Memmert3                 Ralph Ewerth1,2
                                                            1
                                                              L3S Research Center, Leibniz University Hannover, Hannover, Germany
arXiv:2110.11107v1 [cs.CV] 21 Oct 2021

                                                    2
                                                        TIB – Leibniz Information Centre for Science and Technology, Hannover, Germany
                                                         3
                                                           Institute of Exercise and Sport Informatics, German Sport University Cologne
                                                                {theiner, ewerth}@l3s.de                  {r.rein, d.memmert}@dshs-koeln.de

                                                                  Abstract                                    also determined by physiological factors [10] such as run-
                                                                                                              ning distance [8]. For this reason, it has been suggested to
                                             Computer-aided support and analysis are becoming in-             link such information to tactical parameters [3].
                                         creasingly important in the modern world of sports. The                  To carry out such analyses, the player positions on the
                                         scouting of potential prospective players, performance as            field are required. Current tracking technologies allow the
                                         well as match analysis, and the monitoring of training pro-          recording of several million data points representing player
                                         grams rely more and more on data-driven technologies to              and ball positions during a match by using additional hard-
                                         ensure success. Therefore, many approaches require large             ware, e.g., multiple static cameras or sensors on players.
                                         amounts of data, which are, however, not easy to obtain              However, they are difficult to obtain, for instance, due to li-
                                         in general. In this paper, we propose a pipeline for the             censing, financial restrictions, or competitive concerns, i.e.,
                                         fully-automated extraction of positional data from broad-            a club normally does not want or disclose its own team’s
                                         cast video recordings of soccer matches. In contrast to pre-         data. In contrast, broadcast video recordings of soccer
                                         vious work, the system integrates all necessary sub-tasks            matches can be accessed more easily. In this paper, we in-
                                         like sports field registration, player detection, or team as-        troduce a modular pipeline to extract the two-dimensional
                                         signment that are crucial for player position estimation.            positions of the visible players from ordinary broadcast
                                         The quality of the modules and the entire system is inter-           recordings. As illustrated in Figure 1, the system involves
                                         dependent. A comprehensive experimental evaluation is                sports field registration, shot boundary detection, shot type
                                         presented for the individual modules as well as the entire           classification, player detection, and team assignment.
                                         pipeline to identify the influence of errors to subsequent
                                         modules and the overall result. In this context, we pro-                 Application Novelty: While commercial approaches
                                         pose novel evaluation metrics to compare the output with             like [51, 52, 56] primarily use multiple static cameras for
                                         ground-truth positional data.                                        position data generation from video data, the TV feed is
                                                                                                              concretely used by SkillCorner [49] and Track160 [57].
                                                                                                              However, only the final output of such systems is accessi-
                                         1. Introduction                                                      ble [49, 57]. To the best of our knowledge, neither their
                                                                                                              quality, nor used architectures or even information about
                                             Match analysis in soccer is very complex and many dif-           training data and applicability to own data is publicly re-
                                         ferent factors can affect the outcome of a match. The ques-          ported. While individual sub-tasks were tackled in research,
                                         tion is which so-called key performance parameters allow             its combination for the joint real-world task of player posi-
                                         for the characterization of successful teams [27, 34, 40, 44].       tion estimation has not been studied yet (also not beyond
                                         While team behavior can be differentiated into a hierarchi-          soccer). Even individual sub-modules have not been suf-
                                         cal scheme consisting of individual, group, and team tac-            ficiently evaluated in terms of applicability to real-world
                                         tics, different metrics are necessary to capture behavior at         data. For the essential step of sports field registration, recent
                                         each level [13, 40]. Researchers have recognized that game           approaches [37, 46] are evaluated only on a single small-
                                         plays should be segmented into different phases since tac-           scale dataset [16]. Potential for generalization were men-
                                         tics vary greatly [31] across them. Performance in soccer is         tioned [5, 37] with the use of many cost-intensive annota-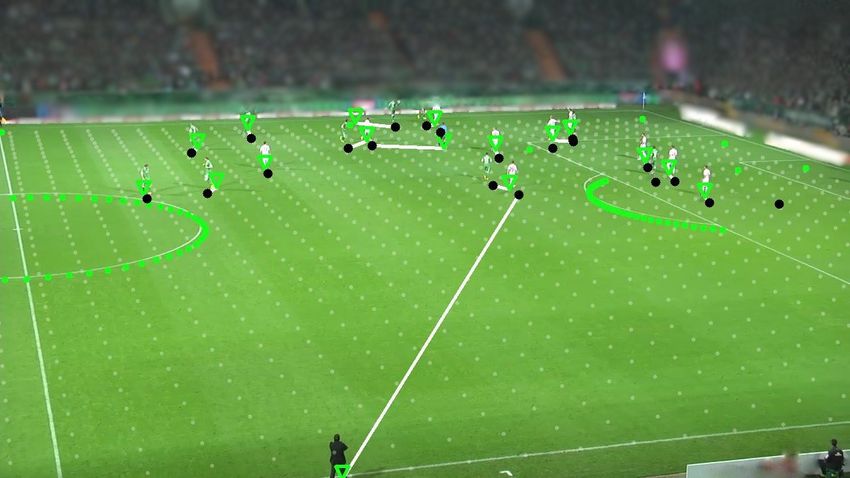
Module
 Input for                Shot Boundary Detection          Field Mask Estimation                   Player Detection              Team Assignment

      Broadcast Video     Shot Type Classification

                                                          Sports Field Registration                              Position Calculation

Figure 1. Proposed pipeline to extract positional data with team assignment from broadcast videos: The video is pre-processed to segment
the field and detect shot boundaries. The camera type is estimated to extract shots from the main camera. Subsequently, the sports field is
registrated and the extracted homography matrix is used to transform the sport field and player detections in order to obtain two-dimensional
coordinates for each player. Team assignment is performed by clustering the player’s bounding boxes.

tions from various data sources. Furthermore, the influence                           rect. Homayounfar et al. [16] propose a solution that relies
of errors in individual modules and their connections has                             on field segmentation and Markov random fields. Sharma
not been explored. To tackle this demanding real-world task                           et al. [47] and Chen and Little [4] propose the nearest neigh-
is of interest for the computer vision community as well for                          bor search from a synthetic dataset of pairs of edge images
sports science, and has direct applications.                                          and camera images for fully-automated registration. Jiang
    Contributions: In contrast to commercial systems and                              et al. [19] present a two-step deep learning approach that
related work, we provide the first transparent baseline                               initially estimates a homography and minimizes the error
for player position estimation with interchangeable mod-                              using another deep network instead of the Lucas-Kanade
ules, that relies on state-of-the-art techniques and freely                           algorithm [1]. Citraro et al. [6] suggest an approach that
available data, while evaluating each module. We demon-                               also takes into account the position of players and is trained
strate the generalizability on multiple datasets where the ap-                        on a separate dataset for uncalibrated cameras. Sha et al.
plied models were not originally trained on. The proposed                             [46] propose an end-to-end approach for area-based field
pipeline is also applicable to the so-called ”tactic-cam” that                        segmentation, camera pose estimation, and online homog-
is located next to the main camera. It usually covers the                             raphy refinement that allows end-to-end training and effi-
entire soccer field (without any cuts) and is consequently                            cient inference. Nie et al. [37] tackle the challenge when no
of interest for video analysts. To evaluate the global task,                          prior knowledge about the camera is available and propose
estimated positions are compared to ground-truth positional                           a multi-task network to simultaneously detect a grid of key
data. This comparison is not trivial due to non-visible play-                         points and dense field features to estimate and refine a ho-
ers in the video and the influence of errors of individual                            mography matrix end-to-end. This approach seems suitable
modules. Therefore, we propose novel evaluation metrics                               since also temporal consistency is verified for successive
and identify the impact of errors on the final system output.                         frames. However, a very large number of training samples
    The remainder of the paper is organized as follows. Sec-                          is required to achieve the desired accuracy and generaliz-
tion 2 gives a brief overview of related work.The pipeline                            ability, but training data are not publicly available except
itself is introduced in Section 3. In Section 4, the different                        for the WorldCup2014 dataset (WC14 [16]).
system components and the accuracy of the extracted posi-                                 Shot boundary detection (e.g., [14, 26, 53, 58]) and
tional data are evaluated. Finally, Section 5 discusses the                           shot type classification (e.g., [45, 54]) are necessary pre-
results and describes possible areas of future research.                              processing steps for many tasks of video analysis. It en-
                                                                                      ables the distinction between different camera shot types.
2. Related Work                                                                       Related work in the context of soccer distinguishes between
    Since the global task of player position estimation has                           three [48], four [35] or five [59] different camera shot types.
not yet been addressed, we briefly review related work for                            For the extraction of positional data, the main camera (with
all individual sub-tasks in this section.                                             the largest distance) offers the most useful information, be-
    Great progress has been made in recent years for                                  cause it normally covers a larger part of the field depicting
sports field registration with monocular non-static cam-                              several players.
eras. Cuevas et al. [7] trained a probabilistic decision tree                             There are several approaches for the detection of play-
to classify specific line segments as an intermediate step                            ers in sports analysis [21, 28, 43, 60]. Although general-
for homography estimation and integrated a self-verification                          purpose approaches for object detection [25, 42] are also
step to judge whether a predicted homography matrix is cor-                           able to detect persons, sports offer specific challenges. For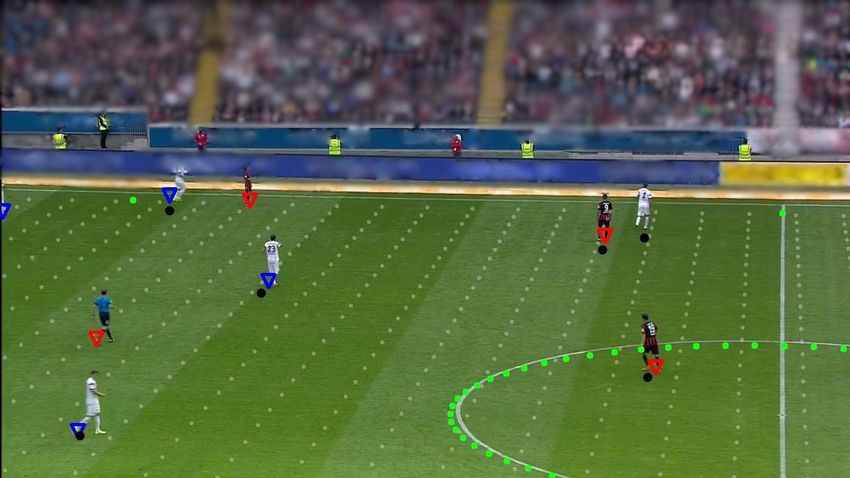
example, the players are usually small, they differ in scale       causing large errors and consequently inconsistencies in the
due to the distance from the camera, they can occlude              predicted homography matrices. For this reason, we calcu-
one another, and there is blur caused by camera move-              late the average LH of the homography changes for each
ment. Nevertheless, specialized approaches [21, 60] com-           shot. The homography change for two successive frames t
pare themselves to general-purpose detectors such as the           is defined as LH (Ht , Ht+1 ) = kHt − Ht+1 k2 where each
Single Shot Detector (SSD) [25] or Faster R-CNN [42]. Ko-          entry in H is (min-max) normalized for each shot. Finally,
morowski et al. [21] have recently introduced a computa-           we classify each shot as the main camera shot if the condi-
tionally much more efficient method with results similar to        tion LH ≤ τ is fulfilled.
a fine-tuned Faster R-CNN. In team sports, the jerseys of
the teams are designed so that they can be easily recognized       3.2. Sports Field Registration
by their color. Thus, for team assignment of the (detected)            The task of sports field registration aims at determining
players, color information can be used as a discriminant fea-      a homography matrix H for the transformation of an im-
ture. Hand-crafted (color) features ([9, 30, 55]) or features      age from the (main) camera into two-dimensional sports
from convolutional neural networks (CNNs) ([18, 22, 29])           field coordinates. Formally, the matrix H defines a two-
are exploited and clustered by these approaches for team           dimensional projective transformation and is defined by a
assignment. An approach for player detection and team dis-         3 × 3 matrix with eight degrees of freedom. We use Chen
crimination [18] addresses the problem of occlusions and           and Little’s approach [4] as the basis for sports field reg-
errors in object detection [32].                                   istration. The camera calibration is defined as the nearest
                                                                   neighbor search in a synthetic dataset of edge map camera
3. Player Position Estimation in Soccer Videos                     pairs. We choose this approach for multiple reasons: (1) It
   A frequent problem in the field of automatic sports anal-       obtains almost state-of-the-art performance on the only test
ysis is the lack of publicly available datasets. Currently,        set for soccer [16], (2) it does not rely on manual annota-
there is no public dataset that provides positional data for       tions to obtain training data [5, 19, 37], and (3) is adaptable
given broadcast soccer videos. Besides, related work solely        to other environments (e.g., stadiums and camera parame-
considered sub-problems of the overall task of player posi-        ters) by changing only a few hyper-parameters, as shown in
tion estimation. This section describes a pipeline as well as      our experiments (Section 4.4).
the choice and modifications of individual components that             Chen and Little [4] adopt a pix2pix [17] model for
solve all required sub-tasks for player position estimation        field segmentation and the subsequent detection of the field
to predict the two-dimensional player positions on the field       markings. The edge images generated in this way are com-
given an input (broadcast) video (Figure 1).                       pared with a dataset of synthetic edge images for which the
   After all relevant (main camera) shots are identi-              camera parameters are known (x, y, z position, focal length,
fied (Section 3.1), the step of sports field registration is es-   pan, tilt). This comparison is based on a Siamese CNN [15],
sential to extract position data (Section 3.2). A homogra-         which takes two edge images as input. Feature vectors are
phy matrix is determined and used to transform the posi-           used to construct the reference database. The nearest neigh-
tions of the players from the image plane into world coordi-       bor search on the feature vectors is then applied by comput-
nates (Section 3.3).                                               ing the L2 distance over all pairs. The camera parameters
                                                                   of the nearest neighbor in the synthetic dataset are used to
3.1. Shot Boundary and Shot Type Detection                         determine an initial homography matrix. This initial esti-
   We aim at estimating player positions in frames recorded        mation is refined using the Lucas-Kanade algorithm [1].
by the main camera since it is most frequently used and
                                                                   3.3. Player Detection and Position Estimation
shows the area of the game that is relevant for tactical
analysis, as shown in Figure 1. We first extract shots                Sports analysis offers some specific challenges for the
from the television (TV) broadcast using the widely ap-            task of object detection and tracking, e.g., the objects (like
plied TransNet [26, 50] for shot boundary detection. Since         players) are often small because they are far away from
our objective is to gather only valuable positional data, we       the camera. Camera motion causes blur in the players’ sil-
subsequently apply shot type classification to identify shots      houettes. But the movement with unpredictable changes of
captured by the main camera. We exploit the homography             players’ direction and pace poses problems also for well-
matrices estimated by the sports field registration approach       tested approaches. Therefore, some approaches address
presented in Section 3.2. We found that the homography             these problems in the architectural design [21, 28]. Zhou
matrices do not change fundamentally in successive frames          et al. [61] solves object detection and tracking based on
captured by the main camera. On the other hand, all other          the object center and should therefore be less susceptible
cameras that, for example, capture player close-ups or ac-         to movements of the players. In Section 4.2, a comparison
tions depict no or only small fractions of the sports field        of three approaches is performed.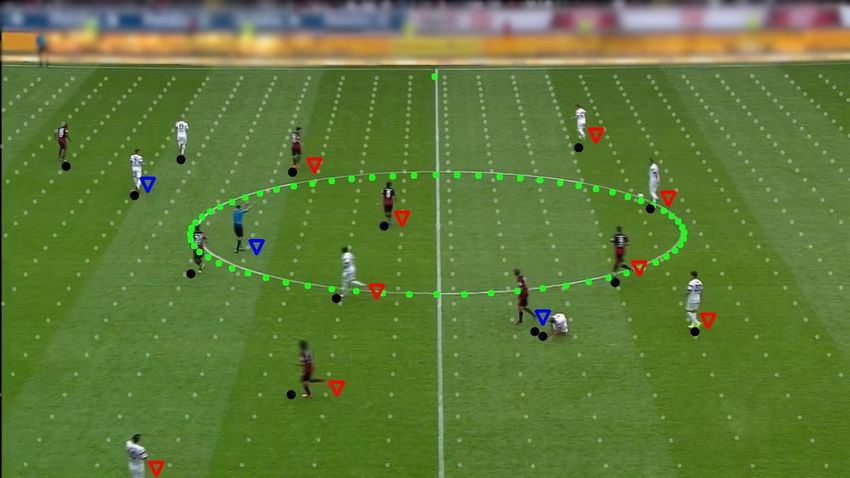
To determine the actual position of each player on the        field players are most frequently detected and that this is
field, we can utilize the predicted homography matrix H,          roughly balanced between both teams. Furthermore, due to
which maps pixel coordinates to sports field coordinates.         the previous segmentation of the playing field, only a few
We define the image position p̃ ∈ R2 of players as the            detections are expected which are not field players. DB-
center of the bottom of the detected bounding box, which          Scan requires two parameters: , which is the maximum
usually corresponds to the feet of the player. The predicted      normalized (color) L2 distance between two detections to
position p̂ ∈ R2 of the player on the field is then calculated    be assigned to the same cluster, and ncls ∈ [0, 0.5], which
with the inverse homography matrix and the detected image         specifies how many of all detections must belong together
positions of the players: p̂ = H −1 p̃.                           to form a cluster (maximum of 0.5 due to two main clus-
    Self-Verification (sv): The predicted positions can be        ters). Since the optimal value for  will be different for each
used to verify the homography matrix extracted by the             match, a grid search for randomly selected frames of each
sports field registration. Assuming that most player po-          sequence of the match is performed to determine the pa-
sitions should be assigned to a coordinate within the             rameter. In contrast to previous work that generally utilizes
sports field, the system can automatically discard individual     color histograms [30, 55] to reduce the input feature space,
frames where the sports field registration is obviously erro-     we apply the average over pixels without any performance
neous. If one of the projected player positions is far outside    decline. The value for  is selected, for which the cost func-
the dimensions of the field including a tolerance distance ρ      tion c() = |X(O)ther | + ||XA | − |XB || is minimal and re-
in meter, then normally there is an error in the homogra-         stricted to form exactly two clusters (XA and XB ). The cost
phy estimation. The smaller the value ρ is chosen, the more       function should ensure that the clusters A and B, which rep-
frames are discarded, because only smaller errors in the ho-      resent the two teams, are about the same size and that there
mography estimation are being tolerated. Intuitively, a tol-      are as few as possible unassigned detections (X(O)ther ).
erance distance between two and five meters seems reason-
able which is proven experimentally (Section 4.5).                4. Experimental Results
                                                                     All individual components are evaluated individually,
Team Assignment: Assuming that for some sports ana-               while the main task of player position estimation is eval-
lytic tasks the position of the goalkeeper is of minor rele-      uated at the end. The main test sets that are used both to
vance (e.g., formation or movement analysis) and it is ex-        evaluate the sports field registration and player position es-
tremely rare that both goalkeepers are visible in the video at    timation are introduced in Section 4.1. As shot boundary
the same time, they are ignored in the team assignment step.      and shot type classification (Section 3.1) are common pre-
Due to the different jersey type and color it requires context    processing steps in video data, we refer to the supplemental
information (i.e. the location) to correctly assign the team.     material A. Section 4.2 and 4.3 focus on the evaluation of
    Another problem is that coaches and attendants also pro-      player detection and team assignment, while the evaluation
trude onto the sports field with their bodies due to the per-     of sports field registration is reported in Section 4.4. Finally,
spective of the camera so that the number of visible classes      the main task is evaluated by comparing the estimated posi-
which appear in a frame cannot be predetermined. We               tional data with the ground-truth data (Section 4.5).
present a simple approach that provides a differentiation be-
                                                                  4.1. Main Datasets
tween only two classes (team A and B) based on the object
detection and assumes that the use of an unsupervised clus-           To evaluate the main task of player position estimation,
tering method is more appropriate in this domain since it         synchronized video and positional data are needed. To in-
does not rely on any training data and the player detection       dicate the generalizability, we use a total of four datasets
results are already available with high quality. We apply         that are primarily designed only for testing, i.e., no training
DBScan [11] to determine two dominant clusters represent-         nor fine-tuning of individual modules is performed on this
ing the field players of both teams. Any unassigned detec-        or closely related data.
tion, which should include goalkeepers, referees, and other           Common broadcast videos of different resolutions (SD
persons, is discarded. The feature vectors are formed based       and HD) and seasons (2012, 2014) are available as well
on the player detection results, i.e., the bounding boxes.        another type of video – the tactic-cam (TC): this camera
We use the upper half of a bounding box since it usually          recording is without any cuts and usually covers a wider
covers the torso of a player. Each bounding box is first          range of the pitch. Since the tactic-cam is located next to the
uniformly scaled to 20 × 20 and then the center of size           main TV camera and usually covers the majority of players,
16 × 16 is cropped. This should reduce the influence of the       it is usually used for video analysis. In general, each dataset
surrounding grass in the considered area. Since the jersey        contains four halves from four matches from the German
colors differ greatly, it is sufficient to use the average over   Bundesliga in 25 Hz temporal resolution with synchronized
color channels (HSV color space). It can be assumed that          positional data. Our datasets are referred to as TV12 (2012,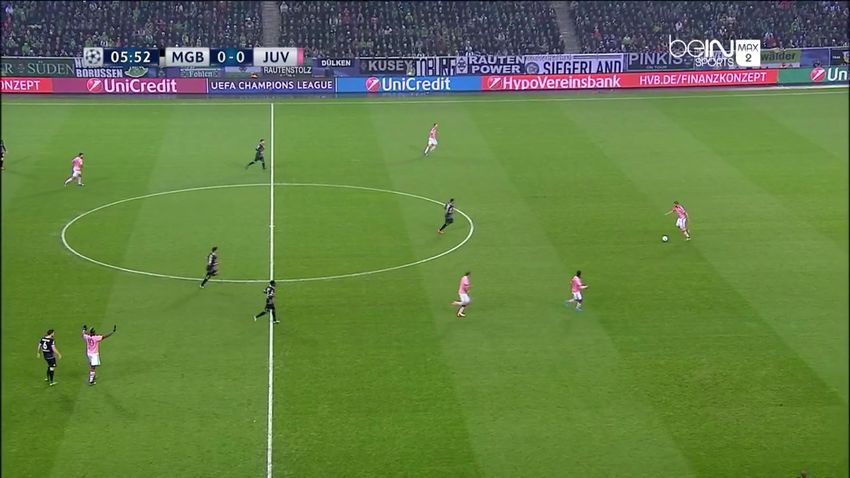
SD resolution), TV14 (2014, HD), TC14 (HD), and TV14-                                      ISSIA-CNR [9]     Soccer Player [28]
S that covers the broadcast videos of the same matches as
                                                                  Faster R-CNN [42]             87.4                 92.8
TC14. Due to temporal inconsistencies in the raw video of         FootAndBall [21]              92.1                 88.5
TV14-S to the positional data, these videos are synchronized      CenterTrack [61]              90.1                 90.2
using the visible game clock. The position data are consid-
ered as ground truth since they are generated by a calibrated    Table 1. Performance evaluation for player detection: The average
(multi-)camera system that covers the entire field. However,     precision in percent is measured on two subsets from the ISSIA-
this system can be inaccurate in some cases [39]. An error       CNR and Soccer Player dataset.
of one meter is to be assumed in the data provided to us.
    The quality of the field registration is essential for the
accurate prediction of the player positions, but as there is     FHD resolution) comprising 3000 frames per camera. Soc-
only one limited dataset for sports field registration in soc-   cer Player [28] is a dataset created from two professional
cer [16], we manually estimate ground-truth homography           matches where each match is recorded by three HD broad-
matrices for a subset of our datasets. In particular, 25 rep-    cast cameras with 30 Hz and bounding boxes are annotated
resentative and challenging images per match are chosen to       for approximately 2000 frames. For evaluation, we report
cover a wide range of camera settings resulting in 100 anno-     the average precision (AP) according to [38]. In the final
tated images per test set. The remaining modules, i.e., shot     step of CenterTrack bounding boxes are estimated, which
boundary and shot type classification, player detection, and     makes AP a suitable metric to compare the performance of
team assignment are trained and evaluated on other pub-          object detectors, even though the size of the bounding box
licly available datasets and introduced in their respective      is not relevant to extract positional data. We refer to the sup-
sections.                                                        plemental material (F) for details about the training process.
                                                                     Results: The results on the test set for our fine-tuned
4.2. Evaluating Player Detection                                 Faster R-CNN [42], Komorowski et al. [21]’s model and
                                                                 the fine-tuned CenterTrack [61] are reported in Table 1.
    Player detection and the usage of the homography ma-         Since Faster R-CNN and FootAndBall perform well on only
trix enable the extraction of two-dimensional coordinates        one test set and perform significantly worse on the other,
for players. While a general object detector like Faster R-      this suggests a lack of generalizability whereas CenterTrack
CNN [42] localizes the bounding box for each object, this        achieves good results on both data sets. As CenterTrack
information is not necessarily needed, rather the exact po-      benefits from training with tracking data [61], we are con-
sition is of interest. To assess the performance of Center-      fident that results can further be improved, but choose this
Track [61] on soccer data, we compare it to another special-     model for our pipeline as it already provides good results.
ized network [21] for this domain and to a general object
detection framework that is fine-tuned [42] for the soccer       4.3. Evaluating Team Assignment
domain. We note that alternative solutions such as [28] ex-          In this experiment, we evaluate the team assignment that
ist and a comparison is generally possible. However, it is       relies on detected bounding boxes.
out of scope of our paper to re-implement and test several           Dataset & Setup: In contrast to very small datasets [9,
variants especially if a satisfactory quality is achieved with   28], Yu et al. [59]’s dataset provides a good diversity regard-
the selected solution.                                           ing the environmental setting (camera movements, lighting
    Datasets & Setup: Due to the lack of publicly avail-         conditions, different matches, jersey colors, etc.). There-
able datasets for training and evaluation, Komorowski et al.     fore, a subset from their dataset is manually annotated with
[21] train their network on two small-scale datasets [9, 28]     respect to team assignment. To bypass errors in the player
where the training and test data is separated by frame-wise      detection, bounding boxes and player assignment are man-
shuffling and subsequential random selection (80% training,      ually annotated for a set of frames containing multiple shot
20% test). CenterTrack can exploit temporal information to       perspectives and matches. Team assignment is annotated
track players. However, to the best of our knowledge, there      for three categories, team A, team B, and other including
exists only one dataset in the domain of soccer with track-      referees and goalkeepers (due to its sparsity). We randomly
ing information (ISSIA-CNR [9]), but it contains a very lim-     select one frame for a total of ten shots captured by the main
ited number of scene perspectives from multiple static cam-      camera for each match. We took 20 matches that were al-
eras and is thus inappropriate for our system. For a fair        ready used to evaluate the temporal segmentation resulting
comparison with the alternative approach, we follow the          in 200 frames for evaluation. As mentioned before, the aim
train-test split of Komorowski et al. [21] where individual      is to find two main clusters, and we found empirically that
frames are used for training. The publicly available ISSIA-      ncls = 0.2 provides good results for this task.
CNR [9] dataset contains annotated sequences from sev-
eral matches captured by six static cameras (in 30 Hz and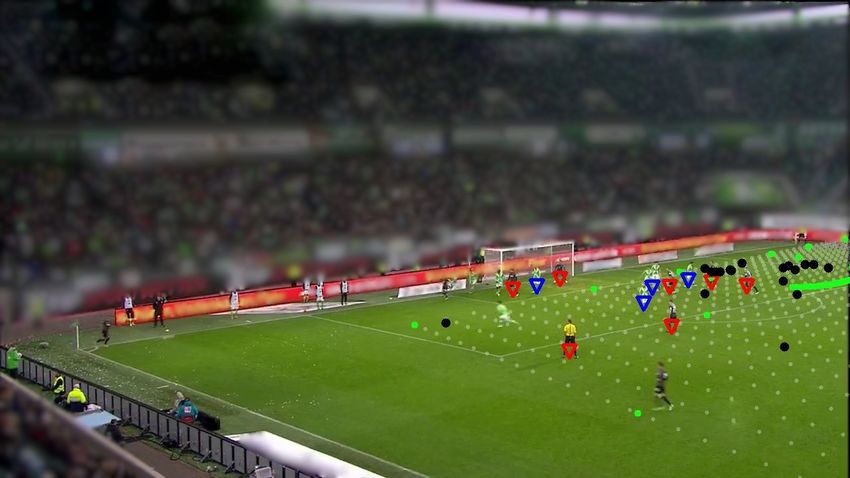
Metrics: Istasse et al. [18] proposed micro accuracy for                                    WC14 [16]  TV12 TV14 TC14 TV-S
this task, but this metric only considers labels from both                 Approach             Mean Med. Mean (std) Mean Mean Mean
teams and is insufficient in our case, since it can be mis-       [4] repr. w.o. refinement      88.3   90.2   63.6 (34.8)   80.2   82.7   84.5
                                                                  [4] reproduced                 93.6   96.5   66.5 (37.4)   85.2   88.7   90.2
leading when the algorithm assigns uncertain associations         Ufocal len.                    92.2   96.6   64.3 (34.8)   85.5   92.5   89.6
to the class other. To prevent this, referees and goalkeepers     Ufocal len. + 2x num. cam.     94.6   96.2   59.5 (39.1)   82.4   89.9   91.0
must be excluded from the object detection or an alternative      Ufocal length + Uxyz           92.2   95.6   61.1 (38.3)   87.4   87.1   89.8
                                                                  Jiang et al. [19] (repr.∗ )    95.1   96.7          72.1   72.5   65.0   76.6
metric needs to be defined. For this reason, we additionally      CCBV [46]                      94.2   95.4             -      -      -      -
consider the macro accuracy for all three classes.                Student CCBV [5]†              88.5   92.3             -      -      -      -
    Results: Our simple method performs well, both in             Teacher CCBV [46] [5]          96.6   98.7             -      -      -      -
                                                                  Nie et al. [37] keypoints      95.8   97.2             -      -      -      -
terms of macro accuracy (0.91) for the three classes and mi-      Nie et al. [37] alignment      95.9   97.1             -      -      -      -
cro accuracy (0.93) for the two team classes. We found that
most errors are players that are assigned to other (goalkeep-     Table 2. Evaluation of multiple candidates for the sports field
ers, referees). This leads to the conclusion that field players   registration on several test sets using IoU part . ∗ official released
are assigned correctly with a high probability in most cases.     model; † no fine-tuning on WC14 but learned from private teacher
In comparison to an end-to-end approach for team assign-          model; Gray colored: private training data.
ment of Istasse et al. [18], where the overall performance
is evaluated on basketball data, a similar micro accuracy
(0.91) is reported. However, the domain basketball differs        test versions, where we uniformly sample from the focal
much from soccer making a direct comparison difficult.            length parameters (Ufocal length (1000, 6000)) and from the lo-
                                                                  cations (Uxyz ([45, −66, 10]T , [60, −17, 23]T )), and double the
4.4. Importance of Sports Field Registration                      number of training images to 100 000. Training process for
                                                                  line segmentation and homography estimation remain un-
    As already introduced, many approaches rely on
                                                                  changed and we refer to Chen and Little [4] and F for im-
manually annotated ground-truth data for training.
                                                                  plementation details.
There exist only one public benchmark dataset (World-
                                                                      Results: As reported in Table 2 the reproduced re-
Cup2014 (WC14) [16]). While the test set follows the
                                                                  sults (base parameters) from Chen and Little [4] at WC14
same data distribution as the training data, in particular,
                                                                  are of similar quality compared to other methods [19, 37,
the camera hyper-parameters (location, focal-length,
                                                                  46]. We observe a noticeable drop in IoUpart on our test
etc.), generalization capabilities are not investigated by
                                                                  sets where the camera parameters (especially the camera
existing solutions [4, 19, 37, 46]. Primarily, to indicate the
                                                                  position (x, y, z)) are unknown. For the TV12 test set all
adaptability of Chen and Little [4]’s approach (Section 3.2)
                                                                  configurations fail on challenging images. This further in-
to different environmental settings, we explore several
                                                                  dicates that the original parameters are optimized for the
hyper-parameters on our target test sets (see Section 4.1).
                                                                  camera dataset distribution in WC14. However, on the re-
Additionally we compare them with recent work.
                                                                  maining three test sets, the approach of Chen and Little [4]
    Metrics: Since the visible part of the pitch is of
                                                                  is able to generalize, whereas an alternative solution [20]
interest for application, we report the intersection over
                                                                  fails. Due to the non-availability of (private) training data
union (IoUpart ) score to measure the calibration accuracy.
                                                                  a comparison with [37, 46] is not fair (colored gray). Yet,
It is computed between the two edge images using the pre-
                                                                  these approaches seem to yield comparable results. A (stu-
dicted homography and the ground-truth homography on
                                                                  dent) CCBV [46] model from [5] is trained on the out-
the visible part of the image.
                                                                  put of a teacher model. As it was originally trained on
    Camera Hyper-parameters: In general, we as-
                                                                  a large-scale and private dataset, noticeable lower transfer
sume that the recommended parameters [4] (derived from
                                                                  performance is observed on WC14. In summary, with slight
WC14 [16]) for generating synthetic training data fit
                                                                  changes in the hyper-parameters, the approach from Chen
for many soccer stadiums. However, we also evalu-
                                                                  and Little [4] is suitable for the applicability to new data
ate slight modifications of the base camera parameters
                                                                  without fine-tuning by human annotations.
which are available in WC14: camera location distri-
bution N (µ = [52, −45, 17]T , σ = [2, 9, 3]T ) in me-            4.5. Player Position Estimation
ters, i.e., the average location from all stadiums (ori-
gin is the lower left corner flag of the pitch); fo-                  This section investigates the performance for player po-
cal length (N (3018, 716) mm) and pan (U(−35◦ , 35◦ )),           sition estimation. Besides, errors of individual modules,
tilt (U(−15◦ , −5◦ )) ranges. We extend the pan and tilt range    i.e., sports field registration, player detection, and team
to (−40◦ , 40◦ ) and (−20◦ , −5◦ ), respectively, in all mod-     assignment as well as compounding errors of the system
els. As the tactic-cam obviously covers a wider range (es-        are discussed. We choose the full datasets as introduced
pecially focal length as seen in Figure 2 A,D,E), we also         in Section 4.1. Despite the shot boundary and shot type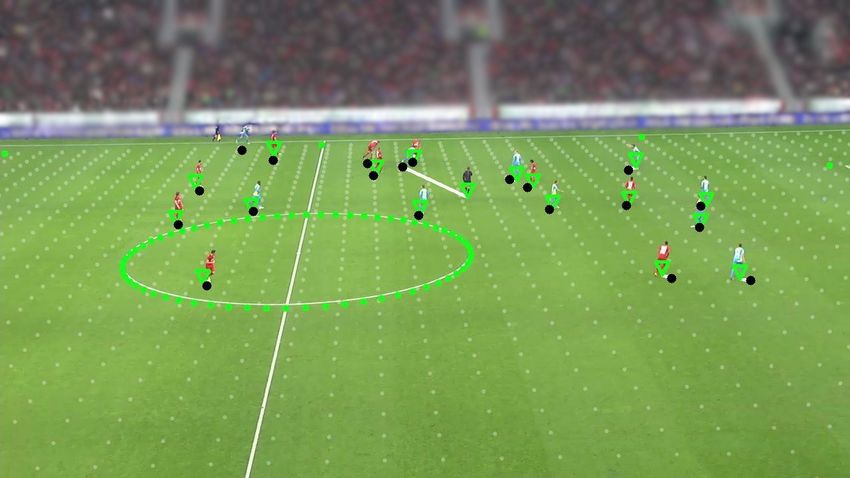
classification provide good results (see Appendix A), we                                                 Team Assignment Constraint
eliminate their influence by considering manually annotated                                             no                       yes

shots as the results for position estimation depend on this       Dataset   sv pm Ratio dmean dmed. acc2 acc3 dmean dmed. acc2 acc3
pre-processing step. False-negative errors lead to a lower                         1.00   4.15   1.84     0.56   0.71   5.33   3.47   0.27   0.43
number of relevant frames for the system’s output and for         TV12      X      0.90   2.52   1.66     0.61   0.77   4.06   3.31   0.30   0.46
                                                                            X X    0.79   2.10   1.55     0.64   0.80   3.39   2.99   0.34   0.51
evaluation, while false-positive errors (e.g., close-ups) pri-                     1.00   3.33   1.78     0.56   0.70   4.95   2.20   0.31   0.46
marily produce erroneous output for homography estima-            TV14      X      0.84   2.82   1.71     0.55   0.71   3.57   1.81   0.34   0.51
tion.                                                                       X X    0.72   2.29   1.64     0.60   0.77   3.17   1.71   0.35   0.53
                                                                                   1.00   3.71   1.20     0.74   0.83   3.32   1.39   0.65   0.78
                                                                  TC14      X      0.89   1.81   1.14     0.79   0.88   2.16   1.34   0.68   0.81
                                                                            X X    0.78   1.66   1.13     0.79   0.88   1.92   1.29   0.71   0.81
Metrics: We measure the distance (in meters) between
                                                                                   1.00   2.47   1.36     0.69   0.81   3.19   2.44   0.43   0.58
the estimated positions and the actual positions by taking        TV14-S    X      0.92   1.89   1.29     0.73   0.85   2.89   2.34   0.44   0.59
the mean and median over all individual frames (dmean ,                     X X    0.75   1.73   1.27     0.75   0.87   2.78   2.32   0.45   0.60
dmed. ) and additionally report how many frames have an er-
ror of less or equal than l ∈ {2.0, 3.0} meters (al ). As pre-    Table 3. Results regarding mean (dmean ) and median error (dmed )
viously mentioned, the sensor devices that capture position       in meters and fraction of frames with an error of less or equal
                                                                  than l meters (accl ) of the total system on several datasets. Ratio
data (used as ground-truth also in other works [33]) can be
                                                                  indicates how many frames are kept for evaluation after applying
slightly inaccurate. A domain expert confirmed, that errors
                                                                  different criteria (system output: only with sv).
in our system of less or equal than l ≤ 2 m can be consid-
ered as correct results and that errors of less than 3 m can
still be meaningful for some sports analysis applications.        ing to the estimated homography matrix. If the number of
    Matching estimated positions to ground-truth: Most of         detected players differs significantly from the actual players
the time only a subset of players is visible in the broadcast     then the homography is probably erroneous (called player
videos and there is no information about which player is          mismatch: pm). We also define a tolerance range of 5% of
visible at a certain frame – making evaluation complex. As        the image borders to include players that are at the boundary
there is no direct mapping between predicted and ground-          to avoid penalizing smallest discrepancies in the estimation
truth positions and the number of detections may vary, the        of the homography matrix. Finally, we discard all frames
resulting linear sum assignment problem first minimized us-       for evaluation that do not satisfy the following condition:
ing the Hungarian Method [23]. Its solution provides a set
of distances for each field player visible in the frame t, for-                                         |Dreal
                                                                                                          t    |
                                                                                  αt := 1 − ζ <             gt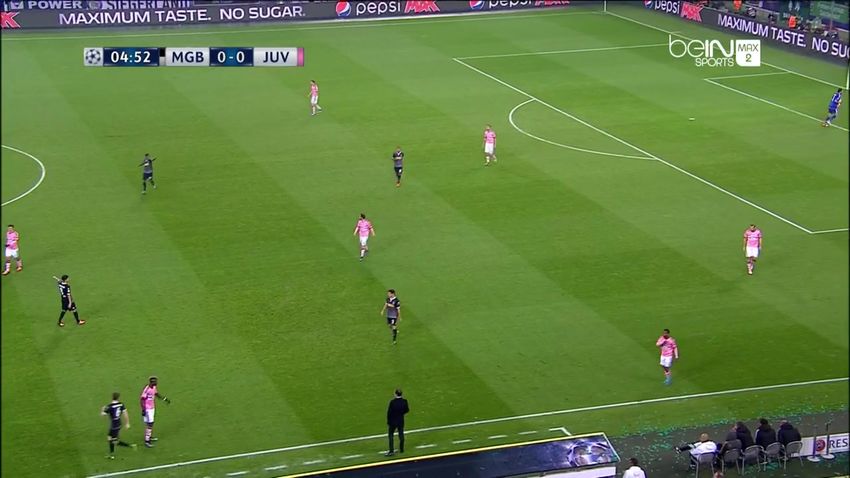
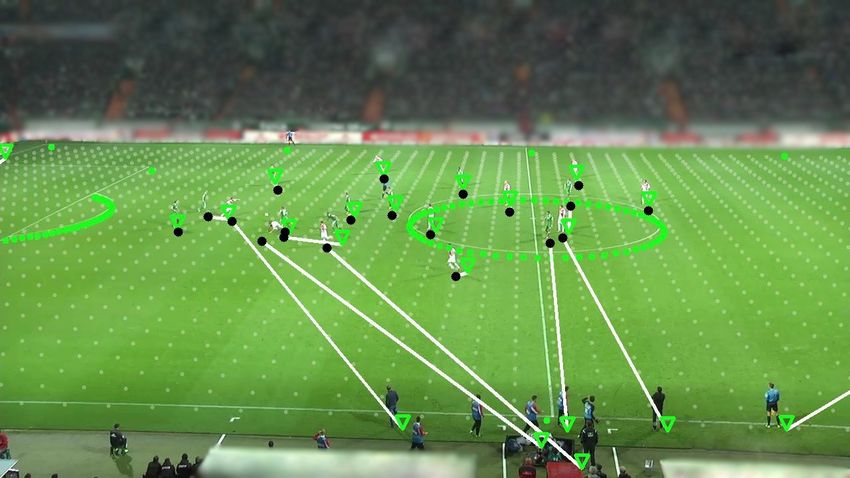
Figure 2. Qualitative results of the proposed system for the extraction of positional player data ordered from low (left) to high error (right):
The top row presents the output without considering teams. The green triangles correspond to the predicted positions (5) of players and the
black points to the ground-truth positions (•); team assignments are colorized red and blue. For the input image the ground-truth positions
are re-projected according to the estimated homography matrix; in the sports field some grid points are highlighted.

maining frames, the pipeline provides promising results on                 tion detection [2, 36] or space control [12, 41].
all datasets. The pm criterion demonstrates the high im-
pact of the sports field registration. Even for marginal er-
rors in the homography estimation, i.e., ca. 95% IoU, the                  5. Conclusions & Future Work
absolute error in meter (mean) is about 1 m when back-
                                                                              In this paper, we have presented a fully-automated sys-
projecting known keypoints [37]. Hence, the applied re-
                                                                           tem for the extraction of positional data from broadcast soc-
duction of bounding boxes to one point does not substan-
                                                                           cer videos with interchangeable modules for shot bound-
tially affect the error in meters. The qualitative examples
                                                                           ary detection, shot type classification, player detection, field
in Figure 2 (with applied sv) primarily show the output of
                                                                           registration, and team assignment. All components as well
the pipeline and support the choice of our metrics. In Fig-
                                                                           as their impact on the overall performance were evaluated.
ure 2 (I, J), the output is obviously erroneous, but not dis-
                                                                           We investigated which parts of the pipeline influence each
carded in the sv process demonstrating the importance of an
                                                                           other and how they could be improved, e.g., by fine-tuning
accurate sports field registration. Furthermore, the influence
                                                                           a specific module with more appropriate data. A relatively
of false-positive field players (A,D,E), and incorrect team
                                                                           small error in meters should allow sports analysts to study
identification is visible (G,H,I). Since the quantitative re-
                                                                           team behavior. Indeed, the adaptation to other sports would
sults are weaker with team assignment, this suggests a lack
                                                                           definitely be interesting. In the future, we also plan to in-
of generalizability to the test data for the player detection
                                                                           tegrate a tracking module. However, additional steps for
and team assignment module. Indeed, player tracking is not
                                                                           player re-identification (within and across shots) are neces-
covered which would lead to more stable predictions across
                                                                           sary to allow player-based analysis across a match.
multiple frames, and temporal consistency of the sports
field registration is not evaluated quantitatively. However,
the sports field registration appears to provide stable results            Acknowledgement
even without explicitly treating the temporal component but
could be post-processed in an additional step [24, 47].                       This project has received funding from the German
    In summary, we claim that our system outputs promising                 Federal Ministry of Education and Research (BMBF –
results in many cases providing a first baseline to conduct                Bundesministerium für Bildung und Forschung) un-
various automatic analyses, for instance, regarding forma-                 der 01IS20021B and 01IS20021A.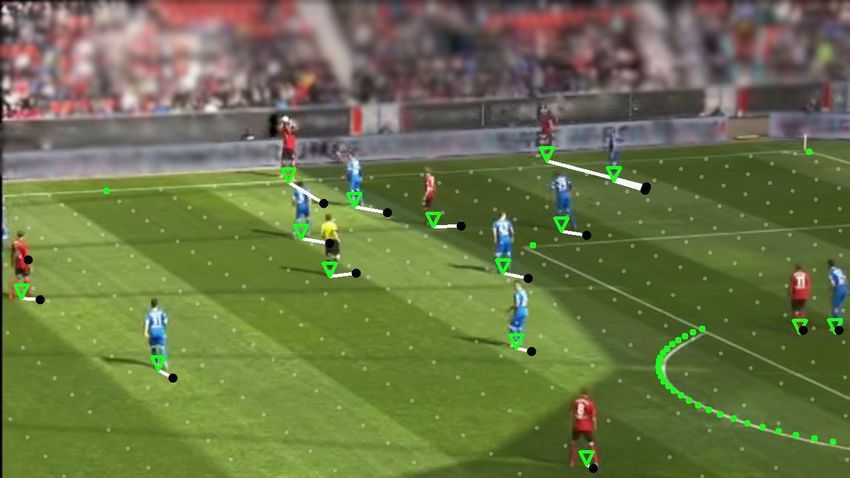
Appendix                                                                                              TransNet [26]   TransNetV2 [50]
                                                                 ∆                                    0    1     2      0    1    2
    In the supplemental material the shot boundary detection     precision                           0.65 0.81 0.88   0.59 0.76 0.86
and shot type classification are evaluated in Section A and      recall                              0.80 0.83 0.84   0.88 0.91 0.92
                                                                 F1                                  0.72 0.82 0.86   0.71 0.83 0.89
contains additional dataset description for the evaluation of
the team assignment in Section 4.3 of the main paper. The        Table 4. Evaluation of the shot boundary detection with ∆ frames
computation costs to run the entire pipeline is roughly spec-    tolerance for the two methods.
ified in Section B whereas related limitations regarding the
temporal consistency is addressed in Section C. Section D
provides additional information to the self-verification fil-    in Section 3.1 of the main paper where only a pre-defined
tering to discard obviously errors in the sports field regis-    parameter τ and the model for sports field registration are
tration, especially the influence of the controllable param-     involved. We have determined this value experimentally us-
eter ρ. The choice of the function to aggregate per-frame        ing five randomly sampled matches from SSET [59] without
distances (predicted positions matched to ground-truth) is       intersections to the test set und using the reproduced model
described in Section E.                                          from Chen and Little [4] (Table 2 second row of the main
                                                                 paper). For each match, a grid search is conducted to de-
A. Shot Boundary & Shot Type Detection                           termine a corresponding threshold and the average overall
   In this experiment, we evaluate the performance of the        matches provide a final value of τ = 0.35. The F1 score is
pre-processing module on soccer data that includes (1) shot      optimized as it provides the harmonic mean between preci-
boundary detection and (2) shot type detection where its         sion and recall. Applied on the test set, an overall F1 score
output is essential for the success of the following modules.    of 0.88 indicates that almost all relevant shots are correctly
                                                                 classified with a precision of 0.90 and recall of 0.87.
Dataset: For this purpose, we select a subset from
SSET [59] where the shot boundaries and camera types             B. Runtime of the Pipeline
(main camera or other) are manually annotated for each
frame. Since a general method for shot boundary detection            All components are real-time capable (> 25 f ps) on
is applied where no extra training is needed, 20 matches         common hardware (we used a 8x 2.9 GHz CPU and one
are randomly selected that contain different challenges like     Nvidia 2080Ti to run each module) except for the field reg-
varying resolutions (ten HD (1280 × 720) and ten SD              istration, especially the homography refinement [1]2 . Even
(640 × 360)), light conditions (artificial vs. daylight) or      an alternative approximated solution [20] is not able to im-
camera movement.                                                 prove the runtime. However, this step is fundamental for
                                                                 the quality of the field registration. If computation time is
Shot Boundary Detection: To evaluate the shot bound-             a requirement, the entire module could be replaced for in-
ary detection, we report recall, precision, and the F1           stance by Nie et al. [37] that was recently published, but un-
score for pre-trained1 models of TransNet [26] and               fortunately, the authors do not provide data, nor pre-trained
TransNetV2 [50]. However, minor temporal offsets of de-          models.
tected cuts (e.g., a cut was detected a few frames earlier
or later than the ground truth) are treated as missing cuts.
Therefore we consider three different tolerance offsets with     C. Temporal Consistency
∆ = {0, 1, 2} frames. The results for TransNet on soccer
                                                                     In the last two experiments (Section 4.4 and 4.5 of the pa-
data are presented in Table 4. With a tolerance of only two
                                                                 per) we evaluated only single frames and did not consider
frames, the improved TransNetV2 [50] achieves useful re-
                                                                 temporal consistency of successive frames. A previously
sults (F1 = 0.89). Because this model is a general detector,
                                                                 evaluated approach [47] that detects individual outliers in
fine-tuning is a way to improve the results. But this would
                                                                 the homography estimation and makes the estimates con-
be beyond the scope of this work and we believe that the
                                                                 sistent across multiple frames (a kind of smoothing) was
performance is already sufficient.
                                                                 not implemented for two reasons. On the one hand, the run-
                                                                 time would have dropped to less than 1 f ps and on the other
Shot Type Detection: Please recall, that it is reasonable        hand the authors have already shown that there are only mi-
to consider only shots captured by the main camera since it      nor improvements.
shows most of the players on the field. To obtain these shots,
a simple but effective classification method was introduced
                                                                    2 https://docs.opencv.org/4.5.1/dc/d6b/group__video_
  1 https://github.com/soCzech/TransNetV2                        _track.html#ga1aa357007eaec11e9ed03500ecbcbe47
ρ                         Ratio   dmean d≤2 m d≤3 m d≤4 m d≤5 m
1.0                       0.81    2.12   0.70  0.84  0.91  0.94                         12         quantile
2.0                       0.87    2.12   0.70  0.84  0.91  0.94                                    average from quantile
3.0                       0.90    2.15   0.69  0.84  0.90  0.93                         10         average
4.0                       0.91    2.18   0.69  0.83  0.90  0.93                          8
5.0                       0.92    2.20   0.68  0.83  0.90  0.93

                                                                                d [m]
∞                          1.0    3.69   0.64  0.78  0.84  0.88                          6
                                                                                         4
Table 5. Results of the actual error made in meters (dmean ) and
                                                                                         2
fraction of frames smaller than l meters on TV12 while varying the
self-verification parameter ρ. Ratio indicates how many frames are                           0.5       0.6       0.7            0.8    0.9     1.0
discarded for evaluation (∞ corresponds to no self-verification.)                                                          q

                                                                     Figure 3. Error in meter over all frames for one match by vary-
D. Self-Verification (sv) Parameter ρ                                ing q when the quantile is used to aggregate per-frame distances:
                                                                     Ground-truth positions of the referees are not included which re-
    In Section 3.3 of the paper we have introduced the self-         sults in a lot of false-positive player detections.
verification (sv) criterion that allows the system to automat-
ically discard individual frames where the sports field reg-
istration is erroneous. Here, we vary the control-able pa-                               9         quantile
                                                                                                   average from quantile
rameter ρ, and show its influence on the TV12 dataset in                                 8         average
Table 5 according to the final result table (Table 3). The                               7
stricter (smaller) the value is chosen, the more frames are                              6

                                                                                 d [m]
                                                                                         5
discarded without much improvement of the results. Thus,
                                                                                         4
we have used ρ = 3 m as it provides a good trade-off.
                                                                                         3
                                                                                         2
E. Per-Frame Distances Aggregation                                                           0.5       0.6       0.7            0.8    0.9     1.0
                                                                                                                           q
   As shortly explained in the main paper, a set of per-frame
distances Dt = {d1 , . . . , dn } is aggregated to calculate a       Figure 4. Error in meter over all frames for one match by varying
global error in meters over all frames and matches. The              q when the quantile is used to aggregate per-frame distances.
use of the average distance as error metric can be mislead-
ing as an outlier, i.e., a false positive player detection (e.g.
substitute player) can be matched to a ground truth player           influence on the global error in meter using mean, median
position with high distance. These outliers can drastically          and our proposed per-frame aggregation function is shown
affect the average distance and lead to wrong impressions.           for TV12 without team assignment in Table 6.
To efficiently reject outliers without using an error threshold
                                                                     Aggregation                                               sv pm Ratio   dmean d≤2 m d≤3 m
as additional system parameter, we proposed to report the
                                                                                                                                     1.00    8.90   0.48  0.69
average distances of the best q-percent position estimates.          Mean                                                      X     0.90    2.67   0.53  0.75
The choice of q is intuitively chosen with 80% to allow mi-                                                                    X X 0.75      2.27   0.56  0.79
nor false-positive player detection errors.                                                                                          1.00    3.70   0.62  0.78
                                                                     Median                                                    X     0.90    2.24   0.66  0.83
   The influence of q to the global error in meter over all                                                                    X X 0.75      1.83   0.71  0.88
frames (dmean ) of one randomly chosen match is addressed                                                                            1.00    3.69   0.64  0.78
in Figure 3 and Figure 4 after applying both filtering crite-        proposed                                                  X     0.90    2.15   0.69  0.84
                                                                                                                               X X 0.75      1.77   0.73  0.88
ria (sv and pm) and without considering team assignment.
This influence of q could be ideally explained for the match         Table 6. The influence of the per-frame aggregation function on
in Figure 3 where no ground-truth positions for the refer-           the actual error made in meters is shown on the TV12 dataset.
ees are given, but for most of time one referee is visible
in the image and has a bounding box according to Center-
Track [61]. This bounding will be assigned to one of the             F. Implementation Details
ground-truth player positions which is just an issue in eval-
uation metric.                                                       F.1. Sports Field Registration
   If we choose a q between 0.8 and 0.9, these kinds of                 For sports field registration and line segmentation we
errors can be ignored in the evaluation because the focus is         have modified the officially available source code3 [4].
on the distances of the significant player positions. A value
of q = 0.8 is also according to Figure 4 not too strict. The           3 https://github.com/lood339/SCCvSD
During training, we sample 50000 camera poses using [7] Carlos Cuevas, Daniel Quilon, and Narciso Garcı́a. Auto-
the provided camera pose engine. Camera parameters are matic soccer field of play registration. Pattern Recognition,
set as explained in our paper. Following [4] we generate 103:107278, 2020.
edges images (1280 × 720 resolution) for sampled camera [8] V Di Salvo, Ramon Baron, H Tschan, FJ Calderon Montero,
N Bachl, and F Pigozzi. Performance characteristics accord-
poses. Then, the edge images are resized to 320 × 180 and
ing to playing position in elite soccer. International Journal
are used to train the two pix2pix models with underlying of Sports Medicine, 28(03):222–227, 2007.
U-Net architecture. We refer to the implementation sec- [9] Tiziana D’Orazio, Marco Leo, Paolo Spagnolo, Pier Luigi
tion of [4] for hyper-parameters as these parameters have Mazzeo, Nicola Mosca, Massimiliano Nitti, and Arcangelo
remained unchanged. These generated edge images are the Distante. An investigation into the feasibility of real-time
input of the siamese network (structure as in [4]) and pro- soccer offside detection from a multiple camera system.
duces a 16-dimensional deep feature for each edge images IEEE Transactions on Circuits and Systems for Video Tech-
used for retrieval during inference. nology, 19(12):1804–1818, 2009.
[10] B. Drust, G. Atkinson, and T. Reilly. Future perspectives in
F.2. Player Detection the evaluation of the physiological demands of soccer. Sports
Medicine, 37(9):783–805, 2007.
As a pre-trained CenterTrack [61] model is fine-tuned [11] Martin Ester, Hans-Peter Kriegel, Jörg Sander, Xiaowei Xu,
on the described data as in the paper, we use the fine-tuning et al. A density-based algorithm for discovering clusters in
script from the official implementation4 with default param- large spatial databases with noise. In kdd, volume 96, pages
eters with the except that the number of epochs is set to 70. 226–231, 1996.
[12] Javier Fernandez and Luke Bornn. Wide open spaces: A
In this context, we would like to point out that providing
statistical technique for measuring space creation in profes-
all details and hyperparameters in this document is not pur- sional soccer. In Sloan sports analytics conference, volume
poseful. 2018, 2018.
[13] J. Garganta. Trends of tactical performance analysis in team
References sports: bridging the gap between research, training and com-
petition. Portuguese Journal of Sport Sciences, 9(1):81–89,
[1] Simon Baker and Iain Matthews. Lucas-kanade 20 years on: 2009.
A unifying framework. International journal of computer [14] Michael Gygli. Ridiculously fast shot boundary detection
vision, 56(3):221–255, 2004. with fully convolutional neural networks. In 2018 Inter-
[2] Alina Bialkowski, Patrick Lucey, Peter Carr, Yisong Yue, national Conference on Content-Based Multimedia Indexing
Sridha Sridharan, and Iain Matthews. Large-scale analysis of (CBMI), pages 1–4. IEEE, 2018.
soccer matches using spatiotemporal tracking data. In 2014 [15] Raia Hadsell, Sumit Chopra, and Yann LeCun. Dimensional-
IEEE International Conference on Data Mining, pages 725– ity reduction by learning an invariant mapping. In 2006 IEEE
730. IEEE, 2014. Computer Society Conference on Computer Vision and Pat-
[3] P. S. Bradley and J. D. Ade. Are current physical match tern Recognition, volume 2, pages 1735–1742. IEEE, 2006.
performance metrics in elite soccer fit for purpose or is the [16] Namdar Homayounfar, Sanja Fidler, and Raquel Urtasun.
adoption of an integrated approach needed? International Sports field localization via deep structured models. In 2017
Journal of Sports Physiology and Performance, 13(5):656– IEEE Conference on Computer Vision and Pattern Recog-
664, 2018. nition, CVPR 2017, Honolulu, HI, USA, July 21-26, 2017,
[4] Jianhui Chen and James J. Little. Sports camera calibration pages 4012–4020. IEEE Computer Society, 2017.
via synthetic data. In IEEE Conference on Computer Vision [17] Phillip Isola, Jun-Yan Zhu, Tinghui Zhou, and Alexei A
and Pattern Recognition Workshops, CVPR Workshops 2019, Efros. Image-to-image translation with conditional adver-
Long Beach, CA, USA, June 16-20, 2019, pages 2497–2504. sarial networks. In Proceedings of the IEEE conference on
Computer Vision Foundation / IEEE, 2019. computer vision and pattern recognition, pages 1125–1134,
[5] Anthony Cioppa, Adrien Deliège, Floriane Magera, Silvio 2017.
Giancola, Olivier Barnich, Bernard Ghanem, and Marc Van [18] Maxime Istasse, Julien Moreau, and Christophe De
Droogenbroeck. Camera calibration and player localization Vleeschouwer. Associative embedding for team discrimi-
in soccernet-v2 and investigation of their representations for nation. In IEEE Conference on Computer Vision and Pat-
action spotting. In IEEE Conference on Computer Vision and tern Recognition Workshops, CVPR Workshops 2019, Long
Pattern Recognition Workshops, CVPR Workshops 2021, vir- Beach, CA, USA, June 16-20, 2019, pages 2477–2486. Com-
tual, June 19-25, 2021, pages 4537–4546. Computer Vision puter Vision Foundation / IEEE, 2019.
Foundation / IEEE, 2021. [19] Wei Jiang, Juan Camilo Gamboa Higuera, Baptiste Angles,
[6] Leonardo Citraro, Pablo Márquez-Neila, Stefano Savare, Weiwei Sun, Mehrsan Javan, and Kwang Moo Yi. Opti-
Vivek Jayaram, Charles Dubout, Félix Renaut, Andres Has- mizing through learned errors for accurate sports field reg-
fura, Horesh Ben Shitrit, and Pascal Fua. Real-time camera istration. In IEEE Winter Conference on Applications of
pose estimation for sports fields. Mach. Vis. Appl., 31(3):16, Computer Vision, WACV 2020, Snowmass Village, CO, USA,
2020. March 1-5, 2020, pages 201–210. IEEE, 2020.
4 https://github.com/xingyizhou/CenterTrack
[20] Wei Jiang, Juan Camilo Gamboa Higuera, Baptiste Angles,Weiwei Sun, Mehrsan Javan, and Kwang Moo Yi. Optimiz- Journal of Sports Sciences, 31(6):639–76, 2013.
ing through learned errors for accurate sports field registra- [32] Mehrtash Manafifard, Hamid Ebadi, and H Abrishami
tion. In Proceedings of the IEEE/CVF Winter Conference on Moghaddam. A survey on player tracking in soccer videos.
Applications of Computer Vision, pages 201–210, 2020. Computer Vision and Image Understanding, 159:19–46,
[21] Jacek Komorowski, Grzegorz Kurzejamski, and Grzegorz 2017.
Sarwas. Footandball: Integrated player and ball detector. [33] Daniel Memmert, Koen APM Lemmink, and Jaime Sam-
In Giovanni Maria Farinella, Petia Radeva, and José Braz, paio. Current approaches to tactical performance analyses
editors, Proceedings of the 15th International Joint Confer- in soccer using position data. Sports Medicine, 47(1):1–10,
ence on Computer Vision, Imaging and Computer Graphics 2017.
Theory and Applications, VISIGRAPP 2020, Volume 5: VIS- [34] Daniel Memmert and Dominik Raabe. Data analytics in
APP, Valletta, Malta, February 27-29, 2020, pages 47–56. football: Positional data collection, modelling and analysis.
SCITEPRESS, 2020. Journal of Sport Management, 2018.
[22] Maria Koshkina, Hemanth Pidaparthy, and James H Elder. [35] Rabia A Minhas, Ali Javed, Aun Irtaza, Muhammad Tariq
Contrastive learning for sports video: Unsupervised player Mahmood, and Young Bok Joo. Shot classification of field
classification. In Proceedings of the IEEE/CVF Conference sports videos using alexnet convolutional neural network.
on Computer Vision and Pattern Recognition, pages 4528– Applied Sciences, 9(3):483, 2019.
4536, 2021. [36] Eric Müller-Budack, Jonas Theiner, Robert Rein, and Ralph
[23] Harold W Kuhn. The hungarian method for the assignment Ewerth. “does 4-4-2 exist?” –: An analytics approach to
problem. Naval research logistics quarterly, 2(1-2):83–97, understand and classify football team formations in single
1955. match situations. In Proceedings of the 2nd International
[24] Antje Linnemann, Sebastian Gerke, Sven Kriener, and Workshop on Multimedia Content Analysis in Sports, MM-
Patrick Ndjiki-Nya. Temporally consistent soccer field reg- Sports ’19, page 25–33, New York, NY, USA, 2019. Associ-
istration. In 2013 IEEE International Conference on Image ation for Computing Machinery.
Processing, pages 1316–1320. IEEE, 2013. [37] Xiaohan Nie, Shixing Chen, and Raffay Hamid. A robust and
[25] Wei Liu, Dragomir Anguelov, Dumitru Erhan, Christian efficient framework for sports-field registration. In Proceed-
Szegedy, Scott E. Reed, Cheng-Yang Fu, and Alexander C. ings of the IEEE/CVF Winter Conference on Applications of
Berg. SSD: single shot multibox detector. In Bastian Leibe, Computer Vision, pages 1936–1944, 2021.
Jiri Matas, Nicu Sebe, and Max Welling, editors, Computer [38] Rafael Padilla, Sergio L Netto, and Eduardo AB da Silva.
Vision - ECCV 2016 - 14th European Conference, Amster- A survey on performance metrics for object-detection algo-
dam, The Netherlands, October 11-14, 2016, Proceedings, rithms. In 2020 International Conference on Systems, Sig-
Part I, volume 9905 of Lecture Notes in Computer Science, nals and Image Processing (IWSSIP), pages 237–242. IEEE,
pages 21–37. Springer, 2016. 2020.
[26] Jakub Lokoc, Gregor Kovalcı́k, Tomás Soucek, Jaroslav [39] Svein A Pettersen, Håvard D Johansen, Ivan AM Baptista,
Moravec, and Premysl Cech. A framework for effective Pål Halvorsen, and Dag Johansen. Quantified soccer using
known-item search in video. In Laurent Amsaleg, Benoit positional data: A case study. Frontiers in physiology, 9:866,
Huet, Martha A. Larson, Guillaume Gravier, Hayley Hung, 2018.
Chong-Wah Ngo, and Wei Tsang Ooi, editors, Proceedings [40] Robert Rein and Daniel Memmert. Big data and tactical anal-
of the 27th ACM International Conference on Multimedia, ysis in elite soccer: future challenges and opportunities for
MM 2019, Nice, France, October 21-25, 2019, pages 1777– sports science, dec 2016.
1785. ACM, 2019. [41] Robert Rein, Dominik Raabe, and Daniel Memmert. “which
[27] Benedict Low, Diogo Coutinho, Bruno Gonçalves, Robert pass is better?” novel approaches to assess passing effective-
Rein, Daniel Memmert, and Jaime Sampaio. A systematic ness in elite soccer. Human movement science, 55:172–181,
review of collective tactical behaviours in football using po- 2017.
sitional data. Sports Medicine, pages 1–43, 2020. [42] Shaoqing Ren, Kaiming He, Ross B. Girshick, and Jian
[28] Keyu Lu, Jianhui Chen, James J. Little, and Hangen He. Sun. Faster R-CNN: towards real-time object detection
Light cascaded convolutional neural networks for accurate with region proposal networks. In Corinna Cortes, Neil D.
player detection. In British Machine Vision Conference Lawrence, Daniel D. Lee, Masashi Sugiyama, and Roman
2017, BMVC 2017, London, UK, September 4-7, 2017. Garnett, editors, Advances in Neural Information Process-
BMVA Press, 2017. ing Systems 28: Annual Conference on Neural Information
[29] Keyu Lu, Jianhui Chen, James J Little, and Hangen He. Processing Systems 2015, December 7-12, 2015, Montreal,
Lightweight convolutional neural networks for player detec- Quebec, Canada, pages 91–99, 2015.
tion and classification. Computer Vision and Image Under- [43] Melike Şah and Cem Direkoğlu. Evaluation of image repre-
standing, 172:77–87, 2018. sentations for player detection in field sports using convolu-
[30] Wei-Lwun Lu, Jo-Anne Ting, James J Little, and Kevin P tional neural networks. In International Conference on The-
Murphy. Learning to track and identify players from broad- ory and Applications of Fuzzy Systems and Soft Computing,
cast sports videos. IEEE transactions on pattern analysis pages 107–115. Springer, 2018.
and machine intelligence, 35(7):1704–1716, 2013. [44] Hugo Sarmento, Filipe Manuel Clemente, Duarte Araújo,
[31] R. Mackenzie and C. Cushion. Performance analysis in foot- Keith Davids, Allistair McRobert, and António Figueiredo.
ball: a critical review and implications for future research. What performance analysts need to know about researchYou can also read