Fact Sheet Scales Corporation Limited 2019
←
→
Page content transcription
If your browser does not render page correctly, please read the page content below

Scales Corporation Limited

 Fact Sheet
          2019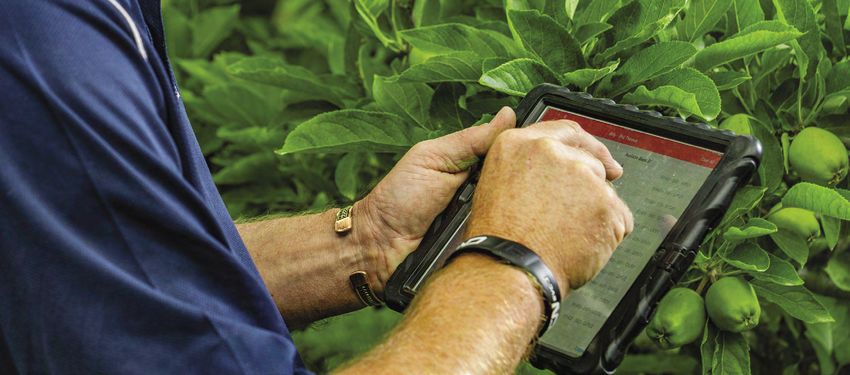
02

About Scales
Scales Corporation Limited (Scales) is an S&P NZX 50 listed
agribusiness group with three operating divisions:

Horticulture

                              Vertically integrated apple grower,
                              packer & marketer

                              Apple marketer a

Logistics

                                                 Air & sea freight

Food Ingredients
                              Petfood ingredient
                 MEATEOR      procurer, processor
                              and marketer b

                              Petfood ingredient
                              procurer, processor
                              and marketer c

                              Juice
                              manufacturer d                                                    Scales’ origins date back to 1897 when it was
                                                                                                established by George H Scales to challenge the
                                                                                                freight rates being charged by the large British
                                                                                                shipping lines to New Zealand wool exporters.
                                                                                                Now the group comprises:
                                                                                                • Mr Apple (including Longview) – New Zealand’s
                                                                                                  largest fully vertically integrated apple business,
                                                                                                  based in Hawke’s Bay.
                                                                                                • Fern Ridge – 73 per cent ownership of a fresh
                                                                                                  produce marketer and exporter in Hawke’s Bay.
                                                                                                • Scales Logistics – leaders in ocean freight services
                                                                                                  to exporters and importers of perishable products,
                                                                                                  with offices in Auckland, Christchurch, Tauranga,
                                                                                                  Hawke’s Bay and Melbourne.
                                                                                                • Balance Cargo – providers of air freight services,
                                                                                                  including chiller and warehousing facilities, based
                                                                                                  in Christchurch.
                                                                                                • Meateor Pet Foods – a 50 per cent owned
                                                                                                  processor and marketer of New Zealand petfood
                                                                                                  ingredients for the global petfood industry, with
                                                                                                  processing plants in Whakatu and Dunedin.
                                                                                                • Meateor Australia – a supplier of petfood
                                                                                                  ingredients sourced from Australia.
    Australia                                         USA                                       • Shelby – 60 per cent ownership of a US procurer,
                                                                                                  processor and marketer of ingredients for the
                                                                                                  petfood industry, purchased in December 2018.
a
  Scales owns 73 per cent of Fern Ridge Produce Limited (Fern Ridge).
b
  On 7 March 2019, Alliance Group acquired a 50 per cent stake in Meateor New Zealand.          • Profruit – a 50 per cent owned manufacturer
c
  Scales owns 60 per cent of Shelby Foods.                                                        of high quality apple, kiwifruit and pear juice
d
  Profruit is a 50 per cent owned joint venture.                                                  concentrates, located in Hawke’s Bay.

                                                                     Scales Corporation Limited
                                                                   Company Fact Sheet - June 2019
03

Vision and Strategy                                                         Sustainability Report
                                                                            Following our inaugural Sustainability Report in 2016 where
Scales’ vision                                                              we identified our materiality index, we progressed in 2017 to
To be the foremost investor in, and grower of, New Zealand                  identifying our key Sustainability focus areas. In 2018, we begun
agribusinesses by leveraging our unique insights, experience and            measuring these areas and setting targets for reducing our
access to collaborative synergies.                                          environmental impact. Accurate measurement will enable us
                                                                            to determine our current position and to assess our progress in
Strategy Update                                                             achieving those reductions.

During 2017 we refreshed our strategy to adopt a greater focus on           In 2018 we focused on the following areas:
pure agribusiness. In 2018, we focused on opportunities that play           • People – in particular, staff engagement and health and safety.
well to our strengths:
                                                                            • Energy – participation in CEMARS® (carbon footprint
• Fully-vertically integrated.                                                calculation) baseline.
• Export-led.                                                               • Waste - in particular the amount of waste sent to landfill.
• Add value from our China relationships.                                   A range of initiatives are underway across the business in each
• Strong corporate brand and long term relationships with                   of these areas. For further information, please read our full
  customers and suppliers.                                                  Sustainability Report in our 2018 Annual Report.

Successful implementation of our refreshed strategy will ultimately
result in a meaningful rebalance of our portfolio of businesses:
                                                                                    Sustainability framework - areas of focus
• Our storage businesses (Polarcold and Liqueo) have been divested.
  These businesses were less aligned with our core strengths and
  generated returns that were below those of our other businesses.
                                                                                                       Workforce              Health
• Our initial investment focus has been on our Food Ingredients                                         stability            & Safety
  division, with the objective of creating a business with the
                                                                                            Employment                                 Community
  potential to generate EBITDA of $25 million. To date:                                      practices                                 investment

   • Scales has acquired a controlling interest in Shelby.
                                                                                                                        People
   • Meateor New Zealand entered into a 50/50 partnership with
                                                                                                                                                Water
     Alliance Group Limited (Alliance) to create Meateor Pet Foods.                 Certification

                                                                                                                                   nme t
                                                                                    & traceability       M arke

                                                                                                                                      n
We will continue to focus on opportunities that complement our
strengths, seeking and investigating appropriate acquisitions

                                                                                                                                 ro
                                                                                                                  la
                                                                                                           tp

and partnerships.                                                                                                      ce         vi
                                                                                                                             En
                                                                                         Spray use                                             Energy
                                                                                         & residues

Strategies to Create Value
Our underlying strategies to create value remain the same. We will:
                                                                                                      Biosecurity                 Waste

• Extend our agribusiness reach through disciplined and patient
  investment to develop new divisions or market sectors by:
   • Using our core investor competency of identifying sectors with
     the appropriate growth characteristics and supporting this
     with our in-depth industry due diligence capabilities.
   • Aligning investments with our core operating competencies to
     deliver collaborative synergies.
   • Seeking a long-run Return on Capital Employed (ROCE) target
     of 15 per cent across our portfolio.
   • Targeting investments that have, or are able to reach, scale.
   • Retaining a focus predominately (but not exclusively) on
     New Zealand.
   • Where appropriate, aligning investments with our expanding
     network in China and Asia, taking advantage of the
     connection and support from our cornerstone shareholder
     China Resources Ng Fung Limited (China Resources Ng Fung)
     and our participation in Primary Collaboration
     New Zealand (PCNZ).
• Support business units by making material investment in growth
  assets, our people and our culture.
   • This includes significant investment in our team, fixed assets,
     brands and market position.
   • Develop our sustainability philosophy and reporting such that
     we are seen to be an ‘Employer of Choice’.
• Be transparent in our market communications.
   • Provide relevant key operating metrics with honesty and
     integrity, subject to maintaining commercial confidentiality.

                                                         Scales Corporation Limited
                                                       Company Fact Sheet - June 2019
04
Share Information
NZX code SCL Closing share price at 30 April 2019 $4.98
Shares on issue at 30 April 2019 141, 364,953 Market capitalisation at 30 April 2019 $704 million
Gross dividend yield 1
5.7% Financial year end 31 December
Primary / Agriculture S&P NZX All
NZX industry sector Indices
and Fishing S&P NZX 50
Scales’ share price from date of listing to 30 April 2019 is shown below.
$5.00
$4.50
20.0m
$4.00
Investment by
China Resources Ng Fung
$3.50
15.0m
$3.00
$2.50
10.0m
$2.00
$1.50
$1.00 5.0m
$0.50
$0.00
Jul Sep Nov Jan Mar May Jul Sep Nov Jan Mar May Jul Sep Nov Jan Mar May Jul Sep Nov Jan Mar May Jul Sep Nov Jan Mar
14 14 14 15 15 15 15 15 15 16 16 16 16 16 16 17 17 17 17 17 17 18 18 18 18 18 18 19 19
Volume Share Price ($)
Dividends Research Coverage
A dividend payout ratio in respect of each financial year of
between 65 per cent and 75 per cent of Net Profit is targeted. It is Company Analyst Email
expected that dividends will be fully imputed for NZ tax residents
Deutsche Craigs Adrian Allbon adrian.allbon@craigsip.com
with the interim and final dividends split approximately evenly and
payable in January (interim) and July (final). Jarden Jack Crowley jack.crowley@jarden.co.nz
Forsyth Barr Guy Hooper guy.hooper@forsythbarr.co.nz
Amount
Period Date Paid
(cash paid)
2017 Interim 19/01/18 9.0 cps
2017 Final 07/07/18 9.0 cps
2018 Interim 18/01/19 9.5 cps
2018 Final (declared) 05/07/19 (payable) 9.5 cps
1
Based on the 2018 fully imputed interim and final dividends of 9.5 cents each (gross 13.2 cents) as at 20 May 2019 and average share price for the 2018 financial year.
Scales Corporation Limited
Company Fact Sheet - June 201905
Key Financials Horticulture
$ million FY2014 FY2015 FY2016 FY2017 FY2018 $ million FY2014 FY2015 FY2016 FY2017 FY2018
(Restated) (Restated)
Underlying2 Revenue 158.8 178.1 230.1 222.0 254.6
263.3 301.4 373.9 393.1 464.7
Revenue
% of Group
Underlying 60% 59% 62% 56% 55%
39.8 61.4 67.9 62.0 67.1 Revenue3
EBITDA
Underlying
Underlying 23.9 40.0 45.3 38.9 42.6
EBITDA
EBITDA 15.1% 20.4% 18.1% 15.8% 14.4%
Margin % of Group
Underlying 60% 65% 67% 63% 64%
Underlying EBITDA
19.8 34.8 38.6 32.7 35.8
Net Profit
Net Profit Orchard Area
18.4 35.9 38.2 31.6 45.5
(Statutory) - Total planted
1,037 1,052 1,042 1,142 1,149
Earnings per orchard at harvest
14.3 25.7 27.4 22.5 32.2
share (cents) - Fully mature
871 902 922 1,043 1,057
Dividends planted orchard
per share
10.0 17.5 14.5 19.0 18.5
(cents - Packhouses 3 3 4 4 3
declared)
Peak coolstore
Average Net 71,361 106,875 107,385 109,818 128,711
40.8 32.5 43.4 54.8 70.7 volumes (bins)
Debt
Capital Our Horticulture division remains the largest division within the Scales
11.1 15.8 15.7 13.5 16.3
Expenditure group and comprises:
• Mr Apple (including Longview), New Zealand’s largest vertically
Divisional Overview integrated grower, packer and marketer of apples, based in
Hawke’s Bay. Mr Apple also packs, stores and markets apples
on behalf of a number of external growers in Hawke’s Bay and
The chart below shows the 2018 Underlying EBITDA contribution markets on behalf of external growers in Nelson.
from each of Scales’ three key operating divisions. Our Corporate
division ran at an EBITDA loss of $6.8m to achieve Underlying • A 73 per cent stake in Fern Ridge, a fresh produce exporter in
Group EBITDA of $67.1m: Hawke’s Bay.
Storage & Our strategy is to grow our sales of premium branded apples
Logistics throughout Asia and the Middle East. We made good progress
$21.1m against this strategy in 2018:
28%
• We continued to redevelop lower-performing orchards and
varieties into higher value varieties. During the winter of 2018,
68 hectares were redeveloped, including the conversion of 50
hectares of established orchard. Of this total redevelopment, 41
hectares were in one of our new apple brands, DazzleTM.
Food • We continue to invest in our apple varieties and brands:
Ingredients
$10.2m • DazzleTM, a new apple brand 20 years in the making, is
14% specifically targeted at the Asia market with its high colour,
Horticulture sweet taste and big size. Mr Apple’s first commercial sales of
$42.6m
58% DazzleTM will take place during 2019.
• PosyTM is a pinky red, sweet apple, which is harvested at the
very beginning of the season. It is also targeted at consumers
in Asia and the first commercial sales of PosyTM are expected to
take place in early to mid-2019.
• Our relationships with China Resources Ng Fung and PCNZ
continue to provide essential insight, support and access to
the large Asia market, with sales to Asia and the Middle East
continuing to account for over 50 per cent of our export sales.
• While continuing to develop Asia, Mr Apple sees opportunities
in creating a more consumer-centric brand in China. Mr Apple is
uniquely positioned to fulfil this position by virtue of its size and
being 100 per cent dedicated to apples. To build a consumer-
centric brand, Mr Apple is implementing a range of marketing
2
Underlying results are considered by Scales to be the best financial measures to and branding strategies.
describe the ongoing performance of Scales. Underlying results exclude some New
Zealand International Financial Reporting Standards (NZ IFRS) non-cash adjustments Around 590 million apples were picked from Mr Apple’s planted apple
(namely, change in fair value gain on apple inventory, cash-settled and equity-settled orchards in the 2018 season from approximately 1,149 hectares of Mr
share-based payments and change in gross liability for non-controlling interests).
Scales believes that Underlying Results more accurately demonstrate the change in
Apple’s planted apple orchard. This equates to a gross production of
operational performance of the Group. Underlying Results include earnings from 5.09 million TCEs of which 3.87 million TCEs were exported. Including
Polarcold (full year) and Liqueo (up until sale). Fern Ridge and other external growers, the Horticulture division
3
Underlying Revenue in 2017 and 2018. exported approximately 5.83 million TCEs.
Scales Corporation Limited
Company Fact Sheet - June 201906
Premium Apple Volumes by Variety
(TCE 000s)
Logistics
$ million FY2014 FY2015 FY2016 FY2017 FY2018
1,901 (Restated)
1,656 1,616 Revenue3 90.6 95.6 108.4 126.0 153.2
CAGR 20% 1,454
% of Group
959 34% 32% 29% 32% 33%
Revenue
1,059 1,036 866 809
831 Underlying
12.3 16.3 16.2 19.1 21.1
741 EBITDA
536 585 574 359
301 253 % of Group
393
282 Underlying 31% 27% 24% 31% 31%
273 457
185 245 245
343 406 EBITDA
119 214
2011 2012 2013 2014 2015 2016 2017 2018
Our Logistics division (formerly Storage & Logistics) changed
Other High Colour Fuji & Royal Gala
significantly during 2018 as a result of:
Pink Lady NZ Queen
• The sale of Liqueo, our bulk liquid storage business, in
August 2018.
• The sale of Polarcold, our controlled temperature storage and
Weighted Average FOB Price / TCE warehousing business, in May 2018. This sale was subject to
for Premium Apples (NZD) Overseas Investment Office approval (OIO), which was granted
in May 2019.
$38.8
$37.8
$37.4
$36.8
The division now comprises:
$31.6 $32.8 • Scales Logistics – leaders in ocean freight services to exporters
and importers of perishable products, with offices in Auckland,
Christchurch, Tauranga, Hawke’s Bay and Melbourne.
$27.8
$26.9 • Balance Cargo – providers of air freight services, including a
purpose built chiller and warehousing facilities, based
in Christchurch.
The division experienced strong growth in 2018, with Scales
Logistics delivering a standout performance with a 48 per cent
increase in EBITDA.
2011 2012 2013 2014 2015 2016 2017 2018
Exports by Market
34%
20% 34%
42%
18% 20%
42%
53% 20%
18%
53% 20%
9%
4%
9%
2007 2017
Europe 4%
UK
2007 2017
North America
Europe
Asia & Middle East
UK
North America
Asia
The Horticulture division has & Middle East
pronounced financial seasonality:
• Over 50 per cent of Mr Apple’s sales are made between
February and June each year.
• Produce growing on apple trees are accounted for as
unharvested agricultural produce assets under NZ IAS 41
Agriculture. This requires unsold agricultural produce to be
measured at fair value less costs to sell, meaning that expected
profit on unsold fruit is recognised in the interim result.
Scales Corporation Limited
Company Fact Sheet - June 201907
Food Ingredients Capital Management
Target return on capital employed for the Group is 15 per cent
$ million FY2014 FY2015 FY2016 FY2017 FY2018 or greater.
(Restated)
Revenue3 37.2 48.6 58.0 68.9 83.1 2017 2018
% of Group Underlying Underlying
14% 16% 16% 18% 18%
Revenue EBITDA EBITDA
Underlying ROCE Margin ROCE Margin
5.7 7.6 9.2 8.0 10.2
EBITDA
Horticulture 21% 18% 21% 17%
% of Group
Storage &
Underlying 14% 12% 14% 13% 15% 13% 15% 16% 14%
Logistics4
EBITDA
Food
37% 10% 32% 10%
Our Food Ingredients division converts agricultural by-products into Ingredients5
valuable food commodities. The division comprises four businesses: Group6 17% 16% 17% 14%
• Meateor Pet Foods – a 50 per cent owned processor and
marketer of New Zealand petfood ingredients for the global Target 15% 15%
petfood industry, with processing plants in Whakatu Underlying
and Dunedin. EBITDA A measure of the business’ core profitability
• Meateor Australia – a supplier of petfood ingredients sourced margin:
from Australia. Calculation: Underlying EBITDA divided by revenue
• Shelby – a 60 per cent ownership of a US procurer, processor A measure of the business’ return on its
and marketer of ingredients for the petfood industry, purchased ROCE:
capital invested
in December 2018.
Underlying EBIT divided by the average of
• Profruit – a 50 per cent owned manufacturer of high quality Calculation:
opening and closing capital employed
apple, kiwifruit and pear juice concentrates, located in
Hawke’s Bay.
This division presents a number of exciting developments and
opportunities, with the most significant recent developments being:
• the acquisition of a controlling interest in Shelby, adding 80,000
MT of petfood ingredient sales to the Group.
• the sale of 50 per cent of Meateor New Zealand to Alliance to
create Meateor Pet Foods. This provides a number of benefits
to Scales and the New Zealand petfood industry including
scale, customer and supplier relationships and added
value opportunities.
There was good growth in both revenues and profitability in this
division in 2018, with Meateor’s volume of petfood sold increasing
5 per cent on 2017 and Profruit sales volumes increasing by 10
per cent.
4
Storage & Logistics (now renamed Logistics) ROCE for 2018 is based on Scales Logistics and Polarcold. Liqueo has been excluded due to the nil balance of capital employed at year end.
5
Food Ingredients ROCE excludes Shelby.
6
Group EBITDA margin is based on Underlying EBITDA divided by Underlying Revenue (revenue from continuing and discontinued businesses).
Scales Corporation Limited
Company Fact Sheet - June 201908
Governance John Sainsbury, CEO Meateor
John has been with Meateor in various management roles for the
last 18 years. Prior to that, John worked in senior management,
Board of Directors marketing and operational roles in the United States. John was
Tim Goodacre Independent Chair appointed CEO of Meateor in March 2015.
Andy Borland Managing Director Andrew van Workum, CEO Mr Apple
Nick Harris Independent Director, Chair Health Andrew has worked in the apple industry for over 30 years.
and Safety Committee He joined Mr Apple at its inception in 2001 and prior to that
was General Manager of Mr Apple’s predecessor, Grocorp
Mark Hutton Independent Director, Chair Nominations Pacific Limited, where he worked for 16 years. He has extensive
and Remuneration and Finance and experience in the production aspects of the apple industry, and
Treasury Committees was previously a Director of Pipfruit New Zealand.
Alan Isaac Independent Director, Chair Audit and Risk
Management Committee
Tomakin Lai Director
Company information
Scales Corporation Limited
Nadine Tunley Independent Director
PO Box 1590, Christchurch 8140, New Zealand
52 Cashel Street, Christchurch 8013, New Zealand
Management T: +64 3 379 7720
E: info@scalescorporation.co.nz
Andrew (Andy) Borland, Managing Director W: www.scalescorporation.co.nz
Andy joined Scales in 2007 and became Managing Director
in 2011. Prior to joining Scales he had a 20-year career in
banking, with his final role being Head of Corporate at Westpac
New Zealand. Andy has overall responsibility for the strategic
Registry information
direction and day-to-day management of Scales. In addition to Computershare Investor Services Limited
his directorships of the Group, Andy is currently Chair of Akaroa Private Bag 92119, Auckland 1142
Salmon Limited, PCNZ and Primary Collaboration New Zealand
T: +64 9 488 8777
(Shanghai) Co. Limited, and is a Director of apple and pear industry
E: enquiry@computershare.co.nz
body New Zealand Apple & Pears, George H Investments Limited,
Rabobank New Zealand Limited, Rabobank Australia Limited and
Rabo Australia Limited.
Glossary
Hamish Davis, Managing Director Fern Ridge
Hamish joined Fern Ridge in 2001, becoming Managing Director ~ Approximately
in 2008 following supply management and sales roles. He has over
30 years’ experience in the growing and post-harvest sectors of Certified Emissions Measurement and
CEMARS®
the apple industry, and remains very active in export sales for Reduction Scheme
the company. EBIT Earnings Before Interest and Tax
Brett Frankel, President Shelby Foods Earnings Before Interest, Tax, Depreciation
EBITDA
and Amortisation
Brett established United States based Shelby Foods in 2007, and
has been its President since inception. Brett has over 20 years’ IAS International Accounting Standard
experience in petfood, having had a senior procurement role prior
to starting Shelby. He also represents the 3rd generation of family IFRS International Financial Reporting Standard
involvement in the sector, following in the footsteps of both his OIO Overseas Investment Office
father and grandfather.
PCNZ Primary Collaboration New Zealand
Steve Kennelly, Chief Financial Officer
ROCE Return on Capital Employed
Steve has been with Scales since 1993 in a variety of accounting
and financial roles. As CFO, Steve is responsible for finance, Tray carton equivalent (a measure of apple
funding, legal, company secretarial and information technology. TCE and pear weight, defined as 18.6kg packed
Steve is a member of Chartered Accountants Australia and weight, which equates to 18.0kg sale weight)
New Zealand.
Karen Morrish, Group Health & Safety, Compliance
and Sustainability Manager
Karen was appointed to this new Group role during 2017. Prior
to that Karen was the Health & Safety and Compliance Manager
for Mr Apple, where she has worked for 14 years.
Kent Ritchie, CEO Scales Logistics
Kent joined Scales in 1998, and has spent over 30 years in the
shipping industry. He has been involved in setting up shipping
services from New Zealand, has experience in all aspects of the
transport industry and has led Scales’ expansion into the
logistics arena.
Scales Corporation Limited
Company Fact Sheet - June 2019You can also read