Fairtree Equity Update - Stephen Brown, Chantelle Baptiste Anne-Marie Gous - Fairtree Capital
←
→
Page content transcription
If your browser does not render page correctly, please read the page content below

Fairtree Equity Update

                        Stephen Brown, Chantelle Baptiste
                                        Anne-Marie Gous

October 2020
Disclaimer
Fairtree Asset Management (Pty) Ltd is registered as a financial services provider with the         A Collective Investment Scheme may be closed to new investors in order for it to be managed
Financial Services Board of South Africa, with registration number 2004/033269/07 and FSP           more efficiently in accordance with its mandate. The Manager does not provide any guarantee
number 25917.                                                                                       with respect to the capital or the return of the portfolio. Excessive withdrawals from the
                                                                                                    portfolio may place the portfolio under liquidity pressure and in such circumstances, a process
A schedule of fees, charges and maximum commissions, as well as a detailed description on           of ring-fencing of withdrawal instructions and managed pay-outs over time may be followed.
how performance fees are calculated and applied, is available on request from the manager of        Commission and incentives may be paid, and if so, are included in the overall costs. Investors
each fund (“the Manager”), being either Sanne Management Company (RF) (Pty) Ltd, Realfin            should note that the value of an investment is dependent on numerous factors which may
Collective Investment Schemes (RF) (Pty) Ltd, Prescient Management Company (RF) (Pty) Ltd           include, but not limited to, share price fluctuations, interest and exchange rates and other
or Boutique Collective Investments (RF) (Pty) Ltd, all being registered and approved managers       economic factors. Performance is further affected by uncertainties such as changes in
of Collective Investment Schemes. The name of the fund shall reflect the name of the                government policy, taxation and other legal or regulatory developments.
approved manager of the fund. Additional information, including key investor information
documents, minimum disclosure documents as well as other information relating to the                The performance of the portfolio is dependent on the making of correct assessments of the
portfolio is available, free of charge, on request from the Manager.                                price movements of individual securities and other investments. Financial markets have
                                                                                                    historically exhibited high levels of volatility and negative movements that have affected the
The Manager retains full legal responsibility for any co-named portfolio and is responsible for     price of all assets within a specific class. The portfolio’s investments will thus be subject to
the appointment of a trustee in accordance with the provisions of the Collective Investment         market risk. Through financial gearing via the long/short process, the portfolio may be
Schemes Control Act, 45 of 2002.                                                                    leveraged. This will mean enhanced positive gains but conversely can mean magnified losses.
                                                                                                    No taxation has been deducted in the computation of returns. The taxation treatment of
We believe the information displayed is accurate and reliable, but no warranty of accuracy or       returns is the investor’s responsibility.
reliability is given and no responsibility arising in any way for errors and omissions (including
by way of negligence) is accepted by Fairtree Asset Management (Pty) Ltd.                           All returns are disclosed net of performance fees.

This information is not intended to provide advice to, or take into account individual investors’   The Fairtree Global Flexible Income Plus fund is a sub-fund of PRESCIENT GLOBAL FUNDS PLC
objectives or circumstances. This material should not be construed to represent a solicitation      and is managed by Prescient Fund Services (Ireland) Limited. Prescient Fund Services (Ireland)
to invest in the portfolio and is disclosed for reporting purposes only.                            Limited is authorised in Ireland and regulated by the Central Bank of Ireland. The Fairtree
                                                                                                    Global Flexible Income Plus fund is approved as a foreign collective investment scheme under
Collective Investment Schemes are generally medium to long-term investments. Please note            Section 65 of the Collective Investment Schemes Control Act 45 of 2002 by the Financial
that past performance is no guarantee of future performance and that the value of                   Sector Conduct Authority of South Africa. Fairtree Asset Management (Pty) Ltd (FSP: 25917)
participatory interests may go down as well as up. Collective investments are traded at ruling      is the investment manager of the Fairtree Global Flexible Income Plus fund.
prices and can engage in scrip lending and borrowing.

2
Contents

Performance Analysis
Equity Market Outlook
Portfolio Positioning
Closing
Fund Annual Return Relative to Benchmark
Consistent alpha generation across the business cycle

As of 30 September 2020

                                                                                                                                        7.72%

                                                                                                                               -4.00%

4    *Benchmark JSE/FTSE All Share Weighted Index (SWIX) from inception to 30 Apr 2017, changed to Capped SWIX on 1 May 2017
     Source: Bloomberg, Prescient, MetCi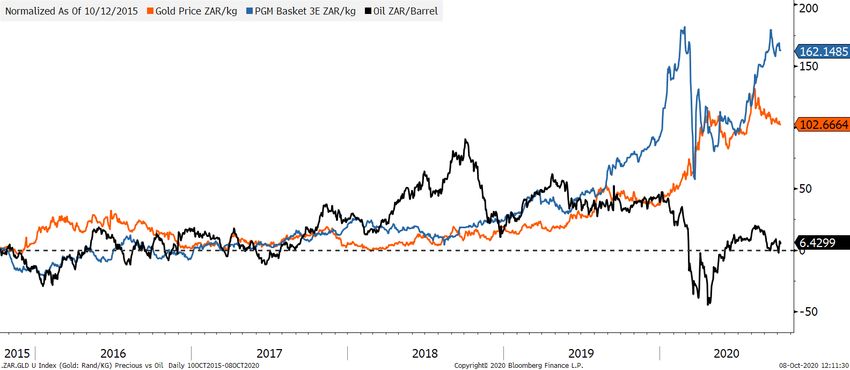
Sector Returns to 5 October 2020
Large bifurcation of market performance during the year

                                                Large Drawdown   Defensive

5
     Source: Bloomberg
Fairtree Equity Fund Positioning
The ability to be flexible is key to adapt to prevailing economic conditions
Defensive Offshore
Offshore Consumer
Resources
SA Inc.*Contents Performance Analysis Equity Market Outlook Portfolio Positioning Closing
SA Inc. Valuations
Valuations are at extreme levels
Terms of Trade Drivers
Precious Metal Prices vs Price of Oil

9
Gold Valuations
Gold Companies trading at attractive valuations
GFI EBITA ($bn) HAR EBITDA (ZARbn)
2018 2019 2020 Spot 2018 2019 2020 Spot 23
FCF Yield -7% 7% 5% 8% FCF Yield -7% -3% 4% 15%
21
PE Ratio n.m. 24.8 14.3 8.5 PE Ratio 13.8 12.5 n.m. 5.9
2.6 2.6
EV/EBITDA 5.0 5.3 6.1 4.1 2.4
EV/EBITDA 4.8 3.4 10.3 3.0
17
2.0
1.9 1.9
1.7
1.5
1.4
1.3 1.3
1.2 1.2 1.2
1.2
1.1
1.0
0.7 5.5
4.1 4.0 3.9
0.5 0.5 3.3
2.7 2.9 2.7
0.3 0.3 2.5
2.0 2.0 2.2
2.5
0.2 0.2 2.0 1.6 1.9
1.0
0.4 0.6 0.1 0.4
2000
2001
2002
2003
2004
2005
2006
2007
2008
2009
2010
2011
2012
2013
2014
2015
2016
2017
2018
2019
2020
2021
2022
2023
2000
2001
2002
2003
2004
2005
2006
2007
2008
2009
2010
2011
2012
2013
2014
2015
2016
2017
2018
2019
2020
2021
2022
2023
Source: Fairtree, Bloomberg, Company Reports, as of 7 October 2020 10PGM Valuations
PGM Companies trading at extreme valuations
IMP EBITDA (ZARbn) NHM EBITDA (ZARbn)
76 24
2018 2019 2020 Spot 2018 2019 2020 Spot
FCF Yield -19% 9% 16% 38% 70 70 FCF Yield -22% -1% 7% 21%
PE Ratio n.m. 9.5 6.0 2.7 PE Ratio 44.4 21.8 16.6 6.7
20
EV/EBITDA 5.3 2.9 3.1 1.2 EV/EBITDA 19.3 12.5 9.0 3.1 19
27.8
6.0
17.6
14.6
11.6
9.8 9.8 2.9
8.1
6.1 5.5
7.5 7.4 2.1 2.4
4.9 4.6 4.5 5.5 4.7 5.4
2.8 3.4 3.2 3.3 1.1 1.0 1.0 0.9 0.8 1.1 1.3
0.4
0.9 0.7
0.5 0.5 0.4 0.5 0.5 0.9 0.5
2000
2001
2002
2003
2004
2005
2006
2007
2008
2009
2010
2011
2012
2013
2014
2015
2016
2017
2018
2019
2020
2021
2022
2023
2000
2001
2002
2003
2004
2005
2006
2007
2008
2009
2010
2011
2012
2013
2014
2015
2016
2017
2018
2019
2020
2021
2022
2023
Source: Fairtree, Bloomberg, Company Reports, as of 7 October 2020 11Mining Taxes
Mining profitability will provide a meaningful boost to the fiscus
South African Mining Taxes & Royalties - Rbn
22
+71%
ZAR billions
+52% 14
80
9
7
6 45
4 23 30
19
13
CY16 CY17 CY18 CY19 CY20e Spot '21
Taxes Royalties
12
Source: Company Reports; Fairtree; Minerals Council of South Africa, as at 7 October2020SA’s Economic headwinds
The CR administration has inherited a weak fiscus and needs to embrace a more accelerated growth path
FW De Klerk Mandela Mbeki Zuma CR
Keys Liebenberg/Manuel Manuel Pravin/Nene/Van Rooyen/Pravin/Gigaba Nene/Tito
FM
Ian McRae Allen Morgan Mpho Makwana/Brian Dames/Collin Jabu Mabuza
Thulani Gcabashe/ Jacob Maroga
ESKOM
Matjila/Tshediso Matona/Zethembe Khoza/Brian /Andre de
CEO
Molefe/Matshela Koko Ruyter
Johnny Dladla/Shaun Maritz/Phakamani Hadebe
GDP +0.6% +2.7% +4% +1.5% -2.5%
D/GDP 35% 47% 26% 51% 64%-81%
Unemployment na 20% 23% 29% 35%
FDI na $400m $12bn $7.1bn 0
BBB+
BBB BBB
Investment grade BBB - BBB -
BB+ BB+
BB BB
BB -
1990
1991
1992
1993
1994
1995
1996
1997
1998
1999
2000
2001
2002
2003
2004
2005
2006
2007
2008
2009
2010
2011
2012
2013
2014
2015
2016
2017
2018
2019
2020
2021
Sovereign rating*
13
Source: Standard Bank, Bloomberg, National Treasury, Fairtree. * S&P rating usedSA’s Confidence Crisis
This level of confidence was last felt in 1985’s Rubicon Speech
FW De Klerk Mandela Mbeki/Manuel Zuma/Pravin CR/Tito
14Question: If there were one structural reform that would
immediately boost confidence what would it be?
1. Overturn the VISA regime and open our borders to skilled foreign workers
2. Digital migration and spectrum allocation
3. Relax hiring and firing aspects of the Labour Relations Act
4. Significant increase in electricity self-generation limits
5. Prosecution of high ranking officials suspected of corruption
15
Source: RMB Morgan Stanley Big 5 conference September 2020Investor sentiment is negatively charged
The Investor community has become emotionally compromised and focused on prosecution
1. Overturn the VISA regime and open our borders to skilled foreign workers
2. Digital migration and spectrum allocation
3. Relax hiring and firing aspects of the Labour Relations Act
4. Significant increase in electricity self-generation limits
5. Prosecution of high ranking officials suspected of corruption
16
Source: RMB Morgan Stanley Big 5 conference September 2020Corruption Reform
CORRUPTION REFORM
Evident & gaining momentum
HAWKS
17 arrests in total last week (October 2020):
• Hawks arrest 6 officials/businessmen in the Free State asbestos
2018 Godfrey Lebeya appointed - Hawks
APRIL audit case
• Thoshan Panday (businessman based in Durban who is a close
CR announces SIU will be created inside NPA to prosecute state capture cases
2019
ally of former president Zuma), was charged with fraud,
FEB
corruption and forgery in relation to ZAR47m in tenders he
OCTOBER - DECEMBER Treasury allocates R38m to special unit
received to provide accommodation to SA Police Service
(SAPS) members during the 2010 FIFA World Cup Mr Panday’s
2020 co-accused include former KZN police chief Mmamonnye
Ngobeni and former SAPS official Aswin Narainpershad
JANUARY
• Four people were arrested in connection with an allegedly
FEBRUARY 9 arrested in VBS bank theft; improper ZAR24m catering tender in KZN
Phillip Truter sentenced and state witness;
MARCH “additional members” will be arrested • Hawks had arrested a former MP (whose identity has not yet
been revealed), as well as several others in connection with a
APRIL
Former MP Vincent Smith in court ZAR4.8m case of theft involving the Limpopo Makgatho
CR amended regulation 11 of the on corruption charges related to
MAY state capture commission Bosasa payments Community Property Association
JUNE
Hawks arrest 6 officials/businessmen
SIU launched case to retrieve in the Free State asbestos audit case
R3.8bn (Guptas, as former
minister, former Eskom executives
JULY and board members implicated)
SAPS: Former crime 17 arrests in total last week (October
‘Fusion Centre’ to work on Covid-19 2020)
AUGUST
corruption intelligence head Richard
Mdluli sentenced for 5 years
SEPTEMBERInstitutional Reform
Key Institutions being rebuilt
NPA ESKOM OTHER SARS
2018 McKinsey agrees to pay back R1bn
from inappropriate fees Transnet New board
APRIL Godfrey Lebeya appointed - Hawks 15 senior Transnet executives
Shaun Abrahams fired Tom Monyane fired
MAY resign
President appoints Eskom
17 PIC board members and senior
JULY - OCTOBER 2 Senior Advocates removed Sustainability Task Team executives resign
headed by Anton Eberhard Edward Kieswetter appointed
NOVEMBER Shamila Batohi appointed
Freeman Nomvalo appointed as Chief Risk 3 Land Bank employees sentenced
2019 Officer incl ex CEO
FEB Eskom Independent CRO Advisor Report Mpati commission
published
SAA former report released on
MARCH Hermoine Cronje appointed The Eskom roadmap presented by DPE Minister PIC irregularities 3 7 senior executives resign from
Pravin Gordhan Chair Dudu SARS from lifestyle audit proposal
MAY 5 Senior Prosecutors removed Myeni individuals have
deemed been issued
R102m allocated to fill vacancies at the NPA delinquent summons to repay SARS seizes ex Land
JUNE - SEPTEMBER
Private sector practitioners appt to assist NPA
Andre de Ruyter appointed stolen money Bank CEO assets
OCTOBER - DECEMBER 300 Eskom managers (including 184 sir
Eskom executives) take voluntary Transnet: R2bn recovered from
retrenchment packages - from lifestyle Guptas and South China Rail
2020 audit proposal
JANUARY R3.7bn coal contract with Guptas cancelled
FEBRUARY 800 posts at the NPA advertised Deloitte agrees R150bn settlement with Eskom
MARCH 2 Deloitte partners resign
CR allows municipalities in “good financial standing”
APRIL to procure their own power from independent power
CR amended regulation 11 of the producers
MAY
state capture commission CEO implements "divisionalisation" approach
JUNE
R14bn oil supply agreement cancelled
JULY ‘Fusion Centre’ to work on Covid-
19 corruption
AUGUST NERSA approve plan to tender 12 GW of power
generation capacity
SEPTEMBEREnergy Crisis
Historical fleet EAF decline since 2001 resulting in 2019 load shedding crisis
Loadshedding GWH
Unknown
EAF %
Stage 1 100%
Stage 2
Stage 3 1325 1352 95%
Stage 4
Stage 5 90%
Stage 6
85%
80%
75%
476
70%
GWhr
176 203 192 65%
143 65%
60%
2000
2001
2002
2003
2004
2005
2006
2007
2008
2009
2010
2011
2012
2013
2014
2015
2016
2017
2018
2019
2020
2007
2008
2009
2010
2011
2012
2013
2014
2015
2016
2017
2018
2019
2020
Source: Eskom; Eskom se Push (mobile app); Nersa; CSIR analysis.
EAF= Energy Availability Factor is the average amount of Eskom's power generation fleet that is available relative to its installed capacityEnergy Solution
“High probability of intermittent national load shedding for next 2 years” – Andre De Ruyter
53.6
1. Improve EAF (18mth)
8.8GW 2. Increase Capacity:
Peak Demand (35GW)
• 8.8GW proposed in 2019
IRP capacity plans –
2022/2023
3. Self Generation
Min Demand (20GW)
38 34.8 40.2
Supply GW Supply Supply
(Installed Capacity) @current 65% @target
EAF 75% EAF
Coal Nuclear Peaking Renewable and other
Source: Eskom; CSIR Energy Centre analysis
EAF= Energy Availability Factor is the average amount of Eskom's power generation fleet that is available relative to its installed capacityUnemployment
In South Africa we have 39m people aged 15-64yr with a total 60m population
Not The Lockdown caused
Economically
Active 20.6m 2.2m lost jobs:
- 1.2m Formal
- 600K Informal
- 300K Domestic HH
2.2m lost jobs - 60K Agri
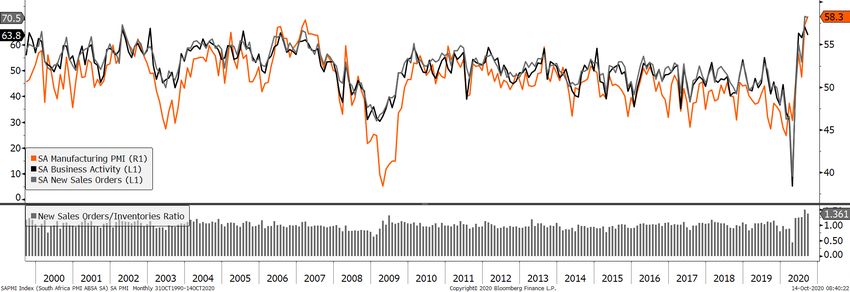
21SA activity is rebounding sharply Macro indicators point to sharp productivity rebound above pre-covid levels
Economic activity continue to normalize
Yoco Small Business turnover index

Activity % compared with pre-lockdown                                                                                                                                                          Domestic VAT (y/y%)
120%
                                                                                                                                                                                                5%
                  *L5                            L4                       L3                                                                  L2                       L1                             25-30% of total government revenue
100%                                                                                                                                                                                            0%

 80%                                                                                                                                                                                            -5%

                                                                                                                                                                                               -10%
 60%
                                                                                                                                                                                               -15%
 40%
                                                                                                                                                                                               -20%
 20%                                                                                                                                                                                           -25%

     0%                                                                                                                                                                                        -30%
                                                                                                                                  03-Aug-20
                                                                                                                                               17-Aug-20
                                                                                                                                                           31-Aug-20
                                                                                  08-Jun-20
                                                                                              22-Jun-20
                      30-Mar-20
                                  13-Apr-20
                                              27-Apr-20

                                                                                                          06-Jul-20
                                                                                                                      20-Jul-20

                                                                                                                                                                       14-Sep-20
                                                                                                                                                                                   28-Sep-20
          16-Mar-20

                                                          11-May-20
                                                                      25-May-20

                                                                                                                                                                                                                                                     Aug-20
                                                                                                                                                                                                                                   Jun-20
                                                                                                                                                                                                         Apr-20

                                                                                                                                                                                                                                            Jul-20
                                                                                                                                                                                                                      May-20
          Source: Yoco Small Business Yoco.co.za
23        * L = Lockdown Level
SA rebound could be sharp
If EM fundamentals remain supportive 2021 recovery could surprise on the upside
Real GDP %
12% 1
Adjusted Real GDP %
10%
EM/DM 1
9.3%
8%
1
6%
4% 1
Consensus 3.50%
2%
1
0%
-8.50%
-2% 1
-4%
0
-6%
0
-8%
-10% 0
1993
2004
1989
1990
1991
1992
1994
1995
1996
1997
1998
1999
2000
2001
2002
2003
2005
2006
2007
2008
2009
2010
2011
2012
2013
2014
2015
2016
2017
2018
2019
2020
2021
Source: Bloomberg, Stats SA, FairtreeDM vs EM Cycles
EM under-/outperformance moves in cycles
GFC
Dotcom bubble Commodity
Super Cycle
EM/DM is the MSCI EM Index/S&P Global 1200 25Global monetary easing
Central banks have cut rates aggressively but further cuts are limited
World weighted average policy rate (%) % of central banks easing globally
6
70%
67%
5
58%
4
3
2
1 1.3
0
00 01 03 04 06 07 09 11 12 14 15 17 19 00 01 03 05 06 08 10 11 13 15 16 18 20
Source: UBS, Haver. 32 global central banks used to calculate weighted policy rate and percentage easing.
26Central bank easing at unprecedented scale
More than $5trn of QE since the crisis
6% of
6M change in Global CB B/S Global
6 000 GDP
5 000
4 000 3.8% of
Global
GDP
3 000
2 000
1 000
-
-1 000
Jun-08
Jun-09
Jun-10
Jun-11
Jun-12
Jun-13
Jun-14
Jun-15
Jun-16
Jun-17
Jun-18
Jun-19
Jun-20
Dec-08
Dec-07
Dec-09
Dec-10
Dec-11
Dec-12
Dec-13
Dec-14
Dec-15
Dec-16
Dec-17
Dec-18
Dec-19
27 Source: Fairtree, Bloomberg10
30
40
50
60
20
28
Sep-17
Oct-17
US
Nov-17
China
Dec-17
Eurozone
Jan-18
South Africa
Feb-18
Source: Bloomberg, Fairtree
Mar-18
Apr-18
May-18
Jun-18
Jul-18
Aug-18
Sep-18
Oct-18
Nov-18
China leads, Europe surpasses US while EM lags
Dec-18
Jan-19
Feb-19
Mar-19
Apr-19
May-19
Jun-19
Jul-19
Global economic recovery takes hold
Aug-19
Sep-19
Oct-19
Nov-19
Dec-19
Jan-20
Feb-20
Mar-20
Apr-20
May-20
Jun-20
Jul-20
Aug-20Global Steel Production
Chinese production remains robust, while the rest of the world recovers
Global crude steel production growth, cumulative % y/y
7%
6%
5% 5% 5% 5%
4% 4% 4%
3% 3% 3%
2% 2%
-1%
-2% -2%
-2% -3%
-4% -4% -4%
-3% -5% -5%
-5%
-5%
-9%
-11% -11%
-13%
-14% -14%
-15% -15% -15%
Jan-20 Feb-20 Mar-20 Apr-20 May-20 Jun-20 Jul-20 Aug-20 Sep-20 Oct-20 Nov-20 Dec-20
China RoW World
29
Source: World Steel Association; Fairtree as at 10 October 2020Global policy backdrop will keep real yield low Real yields are at multi-year lows 30
US Dollar Outlook
 Twin Deficit

Source: Bloomberg, Fairtree
-300000
                                                  -200000
                                                            -100000
                                                                                 100000
                                                                                          200000
                                                                                                   300000
                                                                                                                             400000

                                                                            0
                                                                                                                                                  Net FDI ($m)
                              Dec-95
                               Jul-96
                              Feb-97
                              Sep-97

Source: Bloomberg, Fairtree
                              Apr-98
                              Nov-98
                              Jun-99
                              Jan-00
                              Aug-00
                              Mar-01
                              Oct-01
                              May-02
                              Dec-02
                               Jul-03
                                                                                                                                                                 FDI dynamics could weigh on US dollar

                              Feb-04
                              Sep-04
                              Apr-05
                              Nov-05
                                                                                                            Net FDI (rolling 4 quarter ave.)

                              Jun-06
                              Jan-07
                              Aug-07
                              Mar-08
                              Oct-08
                              May-09
                              Dec-09
                               Jul-10
                                                                                                                                                                                                         US election impact on US Dollar

                              Feb-11
                              Sep-11
                              Apr-12
                              Nov-12
                              Jun-13
                                                                                                            TWI Broad US Dollar (DXY)

                              Jan-14
                              Aug-14
                              Mar-15
                              Oct-15
                              May-16
                              Dec-16
                               Jul-17
                              Feb-18
                                                              Trump

                              Sep-18
                              Apr-19
                                                                                                                                               USD Broad TWI

                              Nov-19
                                        80
                                                      90
                                                                      100
                                                                                110
                                                                                           120
                                                                                                        130

                32
US Election Monitor
Average (RCP) polls and Trump approval rating
Biden polls
Trump approval
Trump polls
Hillary - Trump
Biden – Trump
33 As at Oct 2020. Source: Bloomberg, Real Clear PoliticsContents Performance Analysis Equity Market Outlook Portfolio Positioning Closing
Fairtree Equity Prescient Fund Holdings
A quality and diversified portfolio
Fund holding as of 30 September 2020   Top Twenty Holdings
                                          1   Naspers Ltd                     11.26%
                                          2   Impala Platinum Holdings Ltd     9.20%
                                          3   Northam Platinum Ltd             7.61%
                                          4   African Rainbow Minerals Ltd     5.29%
                                          5   AngloGold Ashanti Ltd            5.24%
                                          6   Harmony Gold Mining Co Ltd       4.62%
                                          7   Foschini Group Ltd/The           4.05%
                                          8   Gold Fields Ltd                  4.03%
                                          9   Prosus NV                        3.54%
                                         10   Mr Price Group Ltd               3.48%
                                         11   Sibanye Stillwater Ltd           3.39%
                                         12   Capitec Bank Holdings Ltd        3.35%
                                         13   Kumba Iron Ore Ltd               2.94%
                                         14   Woolworths Holdings Ltd/South    2.62%
                                         15   Anglo American Platinum Ltd      2.56%
                                         16   Standard Bank Group Ltd          2.46%
                                         17   Truworths International Ltd      2.06%
                                         18   Bidvest Group Ltd/The            1.88%
                                         19   Anglo American PLC               1.53%
                                         20   BHP Group PLC                    1.53%

35
Thank you
You can also read