Fault diagnosis of rolling element bearing using ACYCBD based cross-correlation spectrum
←
→
Page content transcription
If your browser does not render page correctly, please read the page content below

Fault diagnosis of rolling element bearing using ACYCBD based cross-correlation spectrum Yongxiang Zhang Naval University of Engineering Danchen Zhu ( bryantzdc@sina.com ) Naval University of Engineering https://orcid.org/0000-0002-5610-7742 Lei Zhao Naval University of Engineering Research Article Keywords: Maximum second-order cyclostationary blind deconvolution, cross-correlation spectrum, harmonic signi cance index, rolling element bearing, fault diagnosis Posted Date: July 31st, 2021 DOI: https://doi.org/10.21203/rs.3.rs-344502/v1 License: This work is licensed under a Creative Commons Attribution 4.0 International License. Read Full License
Fault diagnosis of rolling element bearing using ACYCBD based
                           cross-correlation spectrum
                                Yongxiang Zhang, Danchen Zhu, Lei Zhao
                                                   (Danchen Zhu
                                             bryantzdc@sina.com)
         School of Power Engineering, Naval University of Engineering, Wuhan 430033, China

Abstract
Rolling element bearings are crucial components in all kinds of rotating machinery. Its fault detection is of great
importance, as it ensure the performance of the whole machine. Periodic transient impulses caused by bearing
defects are usually submerged in strong background noise which poses a challenge for effective fault feature
extraction. To detect bearing faults reliably, a new fault feature extraction method is presented. First, the adaptive
maximum second-order cyclostationary blind deconvolution (ACYCBD) is utilized to recover bearing fault related
impulses, while the optimal filter length is chosen based on the harmonic significance index (HSI) which
quantifies the diagnostic information contained in a deconvoluted signal. Second, cross-correlation is calculated
between the teager energy operator (TEO) and the envelope of the deconvoluted signal to further eliminate the
irrelevant noise. Finally, fast fourier transform (FFT) is employed to acquire the cross-correlation spectrum and the
fault features can be extracted successfully. The performance of the proposed method is verified on both
simulation signals and experimental signals acquired from a test rig. The superior abilities of noise reduction and
fault detection are shown clearly when compared with some traditional method.

Keywords
Maximum second-order cyclostationary blind deconvolution, cross-correlation spectrum, harmonic significance
index, rolling element bearing, fault diagnosis.
1. Introduction
Rolling element bearings (REBs) are widely used in rotating machinery and play an important role in
modern industries. The working condition of the whole machine is usually closely related to the performance
of the REB. Hence, detecting bearing defects at an early stage is of great importance and has drawn
considerable attention. Since the transient impulses caused by fault occurance are weak which often masked
by background noise and interference components [1], along with the unknown transmission path, the
extraction of bearing fault features could be quite difficult.
     Vibration based signal processing method is most commonly applied to bearing fault diagnosis as the
measured vibration signals contain abundant information concerning bearing healthy conditions. In the past
few decades, many effective approaches were proposed, such as the spectral analysis [2], the wavelet
transform [3], the spectral kurtosis [4], the singular value decomposition (SVD) [5-6], the empirical mode
decomposition (EMD) [7], the variation mode decomposition (VMD) [8], the morphological filter [9-10] and
so on. Although the effectiveness of the above methods had been verified, some problems still exist. For
example, both proper center frequency and filtering bandwidth are needed for the envelope analysis. The
SVD is an efficient denoising method which may still be useless if the original signal has low signal-to-noise
ratio (SNR). The EMD is usually used for noise reduction due to its excellent signal decomposition ability,
however, the performance of EMD suffers from end effects and mode mixing greatly. The VMD is a newly
proposed non-recursively adaptive time–frequency analysis method that can decompose a complex
multi-components signal into several intrinsic mode components [11], which has been introduced into
bearing fault detection [12-13]. However, the results obtained by VMD may be limited by the selection of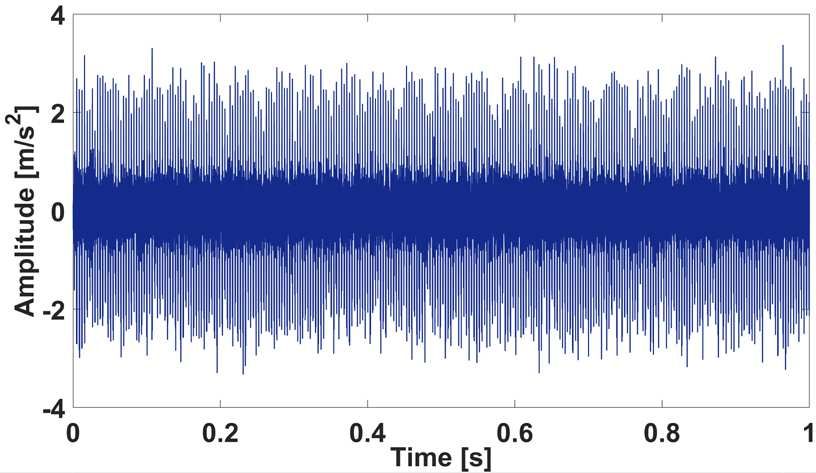
mode number K and balancing parameter a, hence, many attentions have been drawn to solve the problem
[14-15]. The morphology filter is a nonlinear analysis method which is often utilized to eliminate the noise
and enhance the impulse components, but proper selection of morphology operators and structure elements
are essential to achieve ideal filtered results.
     In real application, the vibration signals are often measured far from the defective points, the
complicated transmission path may devote a great impact to the fault detection. As a result, the blind
deconvolution (BD) method has been widely used which can recover the impulsive components from the
noisy observations. As a typical BD technique, the minimum entropy deconvolution (MED) was originally
pioneered by Wiggins [16] to process the seismic signal, which aims to enhance the impulses in raw
vibration signals based on the maximization of kurtosis. The MED has been widely used for bearing fault
diagnosis and is usually combined with other signal processing techniques, for example, the spectral kurtosis
[17], the auto-regressive model [18] and the morphological filter [19]. However, since the noise with single
impulse components may also have high kurtosis values, which may influence the filtered results and the
failure related impacts can be lost. Moreover, the selection of filter coefficients is also of great importance,
which can be solved by optimization algorithms, such as the shuffled frog leaping algorithm (SFLA) [20]
and the particle swarm optimization (PSO) [21].
     McDonald et al proposed the maximum correlated kurtosis deconvolution (MCKD) to enhance the
impulse components in the vibration signals related to a certain fault period [22]. However, the MCKD
entails rigorous requires for input parameters, only when all the parameters are set properly, can the
superiority of MCKD be highlighted. To overcome this limitation, the cuckoo search algorithm (CSA) that
aims to achieve the maximum feature energy ratio is employed to select the optimal filter length and number
of shift, which was proved to be effective compared with some traditional methods [23]. In addition, a
non-iterative deconvolution approach called multipoint optimal minimum entropy deconvolution adjusted
(MOMEDA) was then proposed [24], which shows some advantages over MED and MCKD.
     Recently, a BD technique based on the cyclostationary maximization was proposed by Buzzoni et al
[25], which is presented for both single-input-single-output (SISO) system and single-input-multi-output
(SIMO) system. The BD method based on the maximization of the second-order indicators of
cyclostationary (ICS2), called CYCBD, is suitable for bearing fault detection in both time and angle domain
due to characteristic of bearing fault signals. The CYCBD was proved to provide excellent diagnostic
performance when compared with other BD methods in early fault detection. Although the CYCBD seems to
be robustness with different filter length and defect size for the values of the indicator of cyclostationary
(ICS), an arbitrary selection of filter length may still be improper.
     Therefore, to extract the weak fault features from the vibration signals masked by strong noise, a new
method named ACYCBD-based cross-correlation spectrum is proposed. The main contribution of this paper
is the use of harmonics significance index (HSI) to choose the optimal filter length for the CYCBD and the
propose of cross-correlation spectrum to further enhance fault features of the deconvoluted signals. The
proposed method uses the HSI to determine the optimal filter length for the CYCBD. With detected optimal
filter length, the more impulsive signal can be obtained. Then, the cross-correlation analysis is employed to
further reduce the irrelevant noise, which is calculated between the teager energy operator (TEO) and the
envelope of the filtered signal. Finally, fast Fourier transform (FFT) is applied to the result of
cross-correlation analysis to acquire the cross-correlation spectrum, and the bearing fault features can be
extracted successfully.
     The remainder of this paper is organized as follows. Section 2 briefly reviews the theoretical
background of relevant techniques employs in this study. Simulation verification is conducted in Section 3.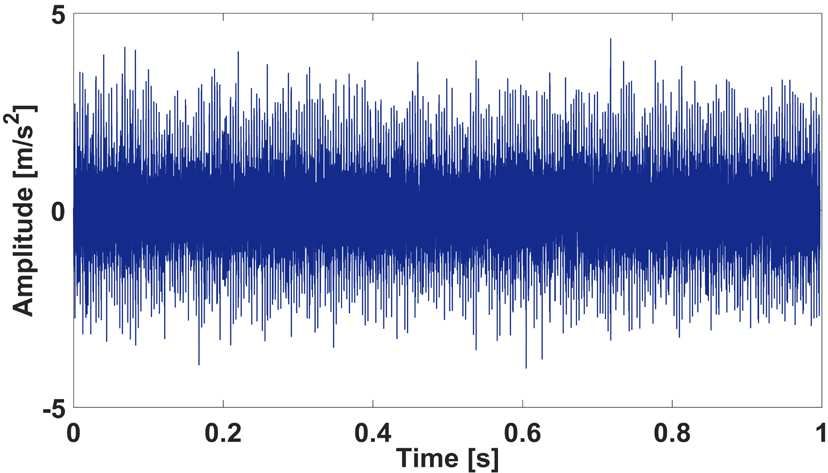
Section 4 shows the performance of the proposed method using signals acquired from a bearing test rig.
Conclusion are presented in Section 5.
2. Theoretical background of the proposed method
2.1 Basic theory of CYCBD
CYCBD is able to identify impulsive signals exhibiting cyclostationary behavior due to localized
defects. In fact, the BD method aims to recover the source signals s0 from a noisy observed signal x.
s = x ∗ h ≈ s0 (1)
where s is the estimated source signal and * denotes the convolution operation. Eq. (1) can also expressed in
a more convenient way:
s = Xh (2)
s[N − 1] x[N − 1] x[0] h[0]
= (3)
s[L − 1] x[L − 1] x[L − N − 2] h[N − 1]
where L and N represents the length of the discrete signal s and h.
The ICS2 can be defined as follows [25].
h H X H WXh h H R XWX h
ICS2 = = H (4)
h H X H Xh h R XX h
where RXWX and RXX denote the weighted correlation matrix and the correlation matrix, respectively and the
weighting matrix W reads:
W = diag H
[ ](L − N + 1) = P[s ]
P s2 2
0
(L − N + 1)
(5)
s s
∑
L −1 2
0 l = N −1
s
where
[ ]= L − 1N + 1 ∑e (e s ) = LEE− N s+ 1
H 2
2 H 2
Ps k k (6)
k
E = [e1 ek e K ] (7)
− j 2π k ( N −1)
e Ts
ek = (8)
− j 2π Ts ( L −1)
k
e
In Eq. (8), k/Ts denotes the cyclic frequency a for discrete-time signals, k and Ts represent the sample
index and the cycle, respectively. The cycle is closely related to the fault characteristic frequency.
By solving the following generalized eigenvalue problem, the maximum ICS2 can be reached [25]:
R XWX h = R XX hλ (9)
where the maximum eigenvalue λ corresponds to the maximum ICS2. As the initialization of weighting
matrix W need to be carried out by guess, hence, an iterative algorithm is required to acquire the maximum
ICS2, and the detailed steps are shown as follows:
step 1: an auto-regressive model is adopted to initialize the whitening filter h, and the coefficients of the
filter are obtained.
step 2: the weighting matrix W is estimated using observed signal X and filter h;
step 3: the maximum λ and its corresponding h are obtained by solving Eq. (9);
step 4: revert back to step 2 using the newly estimated h until convergence.
The blind deconvolution method above is suitable for SISO system. Different from MED and MCKD,
the CYCBD can be easily extended to SIMO system, which can enhance ability of the bearing fault
detection [25]. Assuming that there are Q number of observed signals xq, Rqq represents the auto-correlation
matrix of xq and R qq~ represents the cross-correlation matrix between xq and x q~ ( q~ = 1, , Q and q ≠ q~ ).
Thus, RXX can be changed as [25]:
R qq~
R XX = R qq (10)
R q~q
where Rqq and R qq~ are placed at the diagonal and off-diagonal position of the matrix RXX, respectively. RXWX
can be defined similarly. The deconvolution problems can still be solved by Eq. (9) which returns a filter h
consists of filter coefficients related to qth response. The maximum eigenvalue λ still represents maximum
criterion.
The qth contribution to the source s can be calculated as:
S q = X qh q (11)
where Xq is composed as X in Eq. (3) which is related to xq, finally, the estimated source signal s can be
calculated as:
Q
s= ∑s
q =1
q (12)
2.2 Adaptive filter length selection method based on harmonic significant index
As the analyzed result of CYCBD for a vibration signal with bearing defect is influenced by the filter
length and the longer filter length may lead to more time during convergence, the proper determine of filter
length is the key point in the BD process. Just like the traditional method MCKD and MED, the filter length
can selected by experience or adaptively chosen within a certain range based on a predefined criterion. In
this paper, the second method is chosen and the remaining problem is to determine an appropriate index to
select the optimal filter length.
According to Ref. [25], the increment of ICS2 seems to be consistent with the increase of the filter
length, so choosing the optimal filter length based on the maximum ICS2 may result in a larger filter length,
which may be improper as large filter length can lead to more calculation time.
Harmonic product spectrum (HPS) was originally developed for speech and voice analysis [26-27],
which is able to detect the maximum coincidence of harmonics in the frequency domain and can be
expressed as:
K
H (ω ) = F (ω ) ⋅ F (2ω ) F (Kω ) = ∏ F (kω )
k =1
(13)
where F(ω) represents the magnitude at frequency ω in the envelope spectrum and K is highest order of
harmonics to be considered. However, the original HPS still entails some limitations when using as a
criterion to quantify certain frequency components in the vibration signal [28]. To deal with the problem,
some modifications are made on the original HPS and an improved harmonic product spectrum (IHPS) is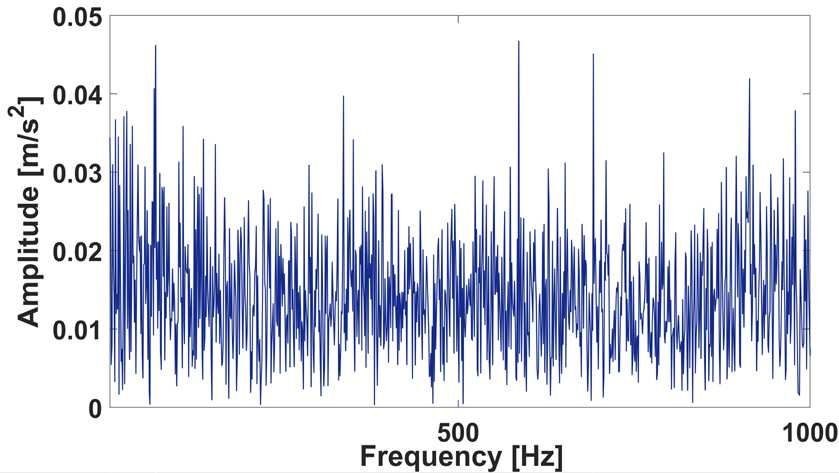
proposed that can be expressed as [28]:
1
F (ω ) F (2ω ) F ( Kω )
1
K K
∏
K
H (ω ) = × × × = P(kω ) (14)
N (ω ) N (2ω ) N (Kω ) k =1
where N(ω) is the level of background noise around the frequency ω, which can be calculated using a
moving average filter (which is the mean value of ten points’ magnitude around the frequency ω in this
paper, and 5 points are selected on both sides of ω) and the magnitude of frequency ω should be removed in
advanced to achieve an accurate result. P(ω)=F(ω)/N(ω) is the magnitude ratio which can reflect the
significant level of a certain frequency component. Thus, H(ω) can represent the significant level of the
ω-spaced harmonics above the local background noise, while for bearing fault detection, ω would be set as
defect characteristic frequency and its harmonics, and the value of H(ω), which can also be called harmonic
significant index, will increase if the bearing fault features are prominent in the envelope spectrum. Hence,
HSI is chosen as the criterion to determine the optimal filter length for CYCBD and the highest harmonic
order K is chosen as 5 in this paper.
2.3 Cross-correlation spectrum
As the estimated source signal s cannot achieve the ideal result that still contains some noise
components, which may affect the effectiveness of fault feature extraction. Based on the result shown in Ref.
[29], the cross-correlation may amplify the frequency components contained in both signals while the
uncorrelated components are attenuated. As a result, the cross-correlation spectrum may provide more
prominent harmonics for desired frequency.
Since teager energy operator (TEO) is conveniently calculated which is able to enhance the transient
impact components, so as to extract the early weak fault characteristics of the rolling bearings [25]. As a
result, in this paper, the cross-correlation is calculated between TEO and envelope of the deconvoluted signal,
due to both two signals contain the desired frequency components caused by bearing defects, the
cross-correlation may amplify the components related to bearing fault characteristic frequency and attenuate
unwanted noise and uncorrelated peaks.
The envelope of filtered signal s is acquired by Hilbert transform:
Ev[s(n )] = s(n )2 + H {s(n )}2 (15)
where Ev[s(n)] is the envelope signal, H {}
⋅ is Hilbert transform. Then the zero-mean envelope signal can be
obtained by removing the mean value.
Evzm [s (n )] = Ev[s (n )] − mean{Ev[s (n )]} (16)
As s is a discrete-time signal, the TEO can be expressed as:
ϕ [s(n )] = [s(n )]2 − s(n + 1)s(n − 1) (17)
Analogously, the zero-mean TEO can be expressed as:
ϕ zm [s (n )] = ϕ [s (n )] − mean{ϕ [s (n )]} (18)
Subsequently, the normalized cross-correlation between these two kinds of signal can be calculated as:
1 L − m −1
REv zmϕ zm (m ) = L ∑n =0
Evzm [s (n + m )]ϕ zm [s (n )] m ≥ 0
(19)
Rϕ zm Ev zm (− m )
m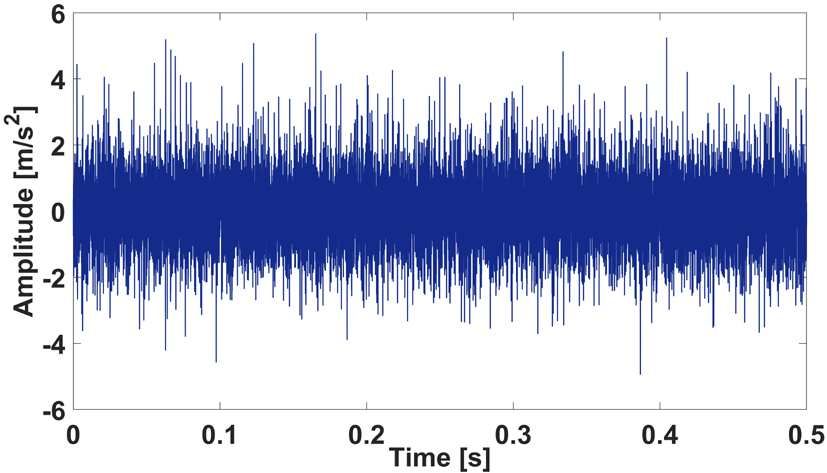
2.4 Summary for the proposed method
To availably diagnose bearing faults from vibration signal, a new fault feature extraction method is
proposed with the combination of the ACYCBD and the cross-correlation analysis. Fig.1 depicts the
flowchart of the proposed method and the detailed process of the proposed method is described as follows.
Start
Start
Collect
Collect bearing
bearing vibration
vibration signals
signals with
with
localized
localized defects
defects
Determine
Determine thethe range
range of
of filter
filter length
length and
and the
the filtered
filtered
results
results of
of CYCBD
CYCBD along
along with
with their
their corresponding
corresponding
HSI
HSI values
values are
are obtained
obtained
Determine
Determine the
the optimal
optimal filter
filter length
length according
according to
to the
the
ACYCBD
ACYCBD maximum
maximum HSIHSI value
value
Apply
Apply the
the CYCBD
CYCBD withwith optimal
optimal filter
filter length
length to
to
the
the original
original vibration
vibration signal
signal and
and the
the final
final filtered
filtered
result
result is
is obtained
obtained
Envelope
Envelope analysis
analysis Teager
Teager energy
energy operator
operator
Cross-correlation
Cross-correlation spectrum
spectrum isis acquired
acquired using
using
the
the two
two signals
signals
Extract
Extract the
the fault
fault features
features of
of rolling
rolling element
element
bearing
bearing and
and the
the fault
fault type
type can
can be
be confirmed
confirmed
End
End
Fig. 1. The flowchart of proposed method
Step 1: The vibration signals of REBs with localized defects are acquired by multi-sensors.
Step 2: Calculate the theoretical fault characteristic frequency f using the geometrical parameters of the
test bearings and the cyclic frequency is set based on the value of f. Since large filter length would result in
more calculation time, especially for a long signal. So, the searching range of filter length is chosen between
40 and 200 in this paper.
Step 3: Normalize the original signals, then some filtered results are acquired using CYCBD with
different filter length and HSI values of all filtered signals are calculated. The optimal filter length is
determined adaptively according to the maximum HSI value.
Step 4: The original vibration signal is processed by CYCBD with optimal filter length so as to acquire
the final filtered result.
Step 5: Cross-correlation is conducted between the TEO and the envelope of the optimal filtered result.
Step 6: Cross-correlation signal is subject to fast fourier transform (FTT) to obtain the cross-correlation
spectrum, and the defective features of a REB are acquired.
3 Simulation verification
A simulation example for bearing with inner-race defect is built in this part to verify the effectiveness of the
proposed method for the extraction of fault features. When a localized defect is existed on the rolling element
bearing, its vibration signals are presented as periodic transient impulses. However, these impulses are usually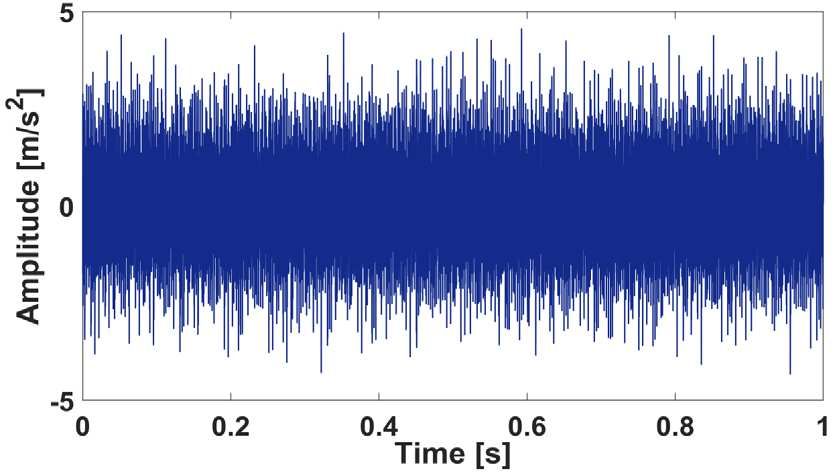
masked by interference components, such as the harmonic components and white noise. Hence, the model of
simulation signal can be expressed as follows[30]:
N
x1 (t ) =
∑ i =1
Ai s(t − iT − ti ) + B(t ) + n(t )
Ai = 4 cos(2πf r t + π 2 ) + 0.5 (20)
B(t ) = cos(2πf t ) + cos(2πf t )
1 2
s(t ) = e − 2πf n rt sin (2πf n t )
where Ai is is adopted to simulate the amplitude modulation which cycle is 1/fr, and fr=42Hz; fn=3200 and
r=0.05 denote the natural frequency of the system and the damping coefficient, respectively; The repetition
period of the periodic impulses is T=1/185s which means the fault characteristic frequency is f=185Hz; ti
represents uncertainties on the arrival time (jitters) of the ith impact (where E{ti}=0 and E{titj}=δijσt, E{·}
represents the expected value, δij represents the Kronecker symbol and σt represents the standard deviation of
the sequence ti, in this simulation, σt is set to be 0.04T). The harmonic B(t) is employed to simulate the
presence of interferences in the signal while f1 and f2 are 50Hz and 100Hz, respectively. The sampling
frequency in simulation is 32768Hz and the signal is simulated for 1 second. zero-mean random noise n1(t)
with standard deviation of 1 is simulated by MATLAB based on the function randn(1, n) in advance, while
n(t)=3*n1(t) is used in the simulation.
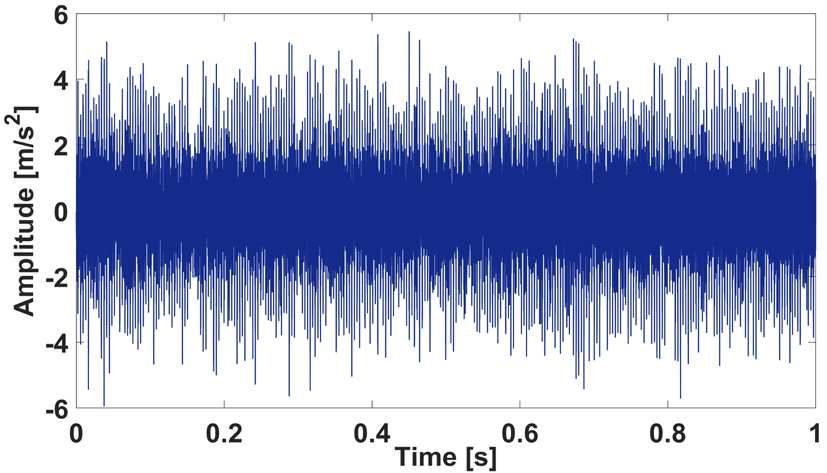
Fig. 2 describes the normalized time-domain waveform of the simulation signal and its envelope
spectrum. It can be seen from Fig. 2(a) that periodic impulses are submerged by strong background noise
which can hardly be observed, while the envelope spectrum shown in Fig. 2(b) is also greatly influenced by
the noise and only the fault characteristic frequency is able to be detected. Therefore, the proposed method is
applied to the simulation signal.
(a) (b)
Fig. 2. Simulation signal: (a) the time domain waveform; (b) the envelope spectrum of (a);
The HSI values of the filtered signals over the selected range of filter length are calculated and
presented in Fig. 3(a). The maximum HSI value can be achieved at the position L=175 in the HSI curve. The
filtered signal using CYCBD with the optimal filter length is shown in Fig. 3(b), the cross-correlation
spectrum described in section 2.3 is displayed in Fig. 3(c) and the fault characteristic frequency along with
four of its higher harmonics are extracted for the fault judgement on the inner-race. Moreover, the
interference of background noise is almost eliminated.
For comparison, the envelope spectrum of the optimal filtered signal is shown in Fig, 3(d) where only
the fault characteristic frequency and one of its higher harmonic can be observed, the influence of strong
noise and interference components are shown clearly, which indicates the effectiveness of cross-correlation
analysis for noise reduction. Then, to show the importance of filter length, N=163 corresponds to a lower
HSI value is chosen for analysis and results are exhibited in Fig. 3(e) and (f). The cross-correlation spectrum
shows a complicated frequency map contains many frequency components, the fault characteristic frequency
and its harmonics can hardly observed. Hence, an unsatisfactory result can be obtained if the filter length is
randomly selected.

                           (a)                                                            (b)

                           (c)                                                            (d)

                           (e)                                                            (f)
Fig. 3. Analyzed results of simulation signal using the proposed method: (a) the curve of HSI over a chosen range
of filter length; (b) the deconvoluted signal using optimal filter length; (c) the cross-correlation spectrum of (b); (d)
    the envelope spectrum of (b); (e) the deconvoluted signal when filter length is 163; (f) the cross-correlation
                                                    spectrum of (e).
     To further demonstrate the validity of the proposed method, first, two other blind deconvolution
approaches named MED and MCKD are used. In this paper, for both the two comparison methods, the filter
length is selected equal to the optimal length of the CYCBD, and for the MCKD, the period of
deconvolution is determined according to the fault characteristic frequency and sample frequency, the
number of shift is chosen to be M=3. Analyzed results using this two method are presented in Fig. 4 and Fig.
5. Fig. 4(a) and Fig. 5(a) shows the filtered signal using the MED and the MCKD respectively, where no
obvious impact components can be recognized, the corresponding envelope spectra are exhibited in Fig. 4(b)
and Fig. 5(b). In the envelope spectrum, the fault characteristic frequency and its harmonics are unable to be
observed due to the influence of heavy noise. Moreover, inappropriate selection of the parameters in the two
methods may also account for the failure of fault feature extraction. Based on the analysis above, it can
conclude that the proposed method is effective in fault feature extraction from heavy noise and the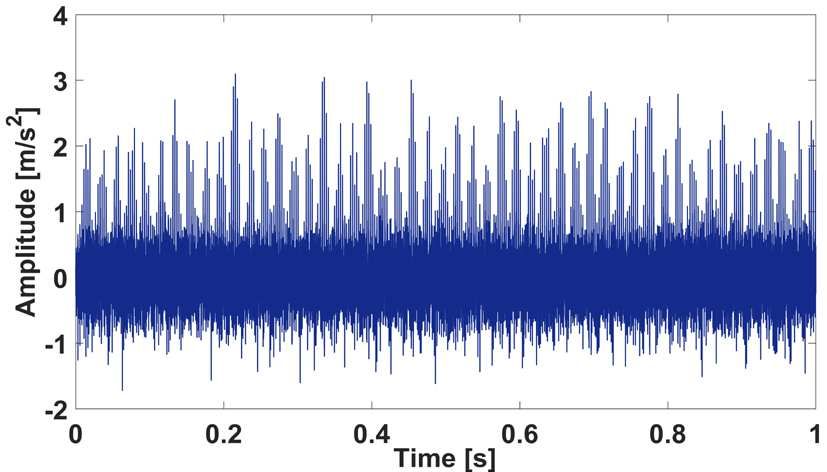
cross-correlation analysis is very important for noise reduction, meanwhile, proper selection of filter length
and other parameters for the denconvolution approaches is also of great essential.

                          (a)                                                        (b)
    Fig. 4. Analyzed results of simulation signal using the MED; (a) the deconvoluted signal; (b) the envelope
                                                 spectrum of (a).

                          (a)                                                        (b)
   Fig. 5. Analyzed results of simulation signal using the MCKD; (a) the deconvoluted signal; (b) the envelope
                                                 spectrum of (a).
     Then the classic Fast Kurtogram proposed in Ref. [31] is applied to the simulation signal and results are
displayed in Fig. 6. As can be seen from Fig. 6(a), the central frequency and bandwidth of the optimal analysis
frequency band can be determined as 3072Hz and 682Hz (red dotted line) whose square envelope spectrum is
exhibited in Fig. 6(b) where only the fault characteristic frequency is able to be observed, thus, the Fast
Kurtogram cannot achieve the ideal results when analyzing the simulation signal, which shows the
superiority of proposed method for the extraction of impulsive components from the vibration signal with
heavy noise.

                          (a)                                                        (b)
Fig.6. Analyzed results of simulation signal using Fast Kurtogram; (a) Kurtogram of simulation signal; (b) square
                                  envelope spectrum of the optimal band signal

4. Application to experimental signal
The experimental signals acquired from a test rig is employed to further demonstrate the validity of the
proposed method. The test rig shown in Fig. 7 consists several main components which are bearing support
structure, main shaft, experimental bearing, lubricating oil system, servo-driven motor, radial loading device,
axial loading device and control system.
Control system
Point 1
The flange plate with Main shaft
experimental bearing
Axial loading device
Lubricating oil
Radial loading device
Bearing support structure Point 2
Fig. 7. The test rig
As sensors may be impossible to be mounted near the defective bearing in practical applications, the
fault diagnosis using the signals acquired at a long distance may be more meaningful. Hence, two measuring
points (shown in Fig .7) are selected away from the experimental bearing to collect the vibration signals.
These signals may contain various noise and interference components which may make it more difficult for
the fault diagnosis of REB.
The type of test bearing is 6010, the outer and inner diameter of the bearing are 80mm and 50mm
respectively, thus the pitch diameter is D=65mm; the diameter and number of rolling elements are d=9mm
and Z=13; the contact angle is α=0°. The experimental signals are collected by the B&K vibration test
system, the models of the acceleration sensor and the signal conditioning and acquisition module are
B&K4354B-004 and B&K3053-B-120, respectively. During the experiment, the rotating speed is set as
fr=3000r/min. The sampling frequency of the data acquisition device is 32768Hz. The fault characteristic
frequencies for different localized defects can be calculated by the following equations:
1 d
fi = Z 1 + cos α f r (21)
2 D
1 d
fo = Z 1 − cos α f r (22)
2 D
where fi and fo denote the ball pass frequency of the inner race (BPFI) and the ball pass frequency of the
outer race (BPFO). Hence, the theoretical BPFI and BPFO are 370Hz and 280Hz, respectively.
4.1 Bearing inner-race defect identification
Since the the fault detection ability of CYCBD can be improved using vibration signals collected by
multi-sensors [25], in the experimental verification, vibration signals collected at point 1 and 2 are used
together for the estimation of source signals.
Fig. 8(a) shows the time domain waveform of signal with inner-race defect measured at point 1, the
repetitive transient impulses are not obvious due to the existence of noise. The envelope spectrum in Fig .8(b)
is also masked by noise, where only two harmonics related to BPFI are able to be observed. Fig. 8(c) showsthe time domain waveform of signal measured at point 2 and its envelope spectrum is shown in Fig. 8(d),
where the harmonics are even harder to identify. Therefore, the interference is heavier for signals collect at
point 2, and the envelope analysis isn’t enough if applied to the experimental signals directly. Then, the
proposed method is applied to the experimental signals.
(a) (b)
(c) (d)
Fig. 8. Vibration signals measured at different points with inner-race defect: (a) time domain waveform of signal
collected at point 1; (b) the envelope spectrum of (a); (c) the time domain waveform of signal at point 2; (d) the
envelope spectrum of (c).
As mentioned in Fig. 9(a), the optimal filter length should chosen to be 177 and the filtered signal is
displayed in Fig. 9(b) where the presence of noise is reduced obviously. The cross-correlation spectrum
achieved by ACYCBD is provided in Fig. 9(c). As can be seen from Fig. 9(c), the fault characteristic
frequency and four of its harmonics are prominent, while the interference of noise is reduced significantly.
Moreover, the side-bands modulated by rotating frequency around the BPFI and its harmonics are able to be
observed. All the features above clearly indicate the existence of a defect on the inner race.
Similar to simulation analysis, the envelope spectrum of the optimal deconvoluted signal is presented in
Fig. 9(d) which also shows the fault features clearly. However, noise and some other irrelevant frequency
components are more obvious than those in the cross-correlation spectrum.
(a) (b)(c) (d)
(e) (f)
Fig. 9. Analyzed results of experimental signals with inner-race defect using the proposed method: (a) the curve of
HSI over a chosen range of filter length; (b) the deconvoluted signal using optimal filter length; (c) the
cross-correlation spectrum of (b); (d) the envelope spectrum of (b); (e) the deconvoluted signal when filter length
is 114; (f) the cross-correlation spectrum of (e).
(a) (b)
(c) (d)
Fig. 10. Analyzed results of experimental signals with inner-race defect using the MED; (a) the filtered result using
signal measured at point 1; (b) the envelope spectrum of (a); (c) the filtered result using signal measured at point 2;
(d) the envelope spectrum of (c).
What’s more, filter length corresponds to lower HSI value (N=114) is employed for analysis and resultsare shown in Fig. 9(e) and (f). Fig. 9(e) shows the filtered signal and the noise is obviously reduced, but only
the fault characteristic frequency and two of its harmonics are successfully extracted in the envelope
spectrum, which means a proper selection of filter length is of great significance.
(a) (b)
(c) (d)
Fig. 11. Analyzed results of experimental signals with inner-race defect using the MCKD; (a) the filtered result
using signal measured at point 1; (b) the envelope spectrum of (a); (c) the filtered result using signal measured at
point 2; (d) the envelope spectrum of (c).
Fig. 10 and 11 illustrates the analyzed results of the experimental signals with bearing inner-race defect
using two comparison methods. As depicted in Fig. 10, MED can extracted the fault features of bearing and
reduce the background noise of the original signal, so that the fault characteristic frequency and its
harmonics can be detected in the envelope spectrum of the deconvoluted signal. However, the envelope
spectrum still shows a complicated frequency map where the amplitude of interference components are
obvious. When the MCKD is applied to the measured signal at point 1, numerous spectral peaks related to
inner-race fault can be found in the envelope spectrum presented in Fig. 11(b), but some are not prominent.
When MCKD is used to analysis the measured signal at point 2, the filter signal and its corresponding
envelope spectrum are presented in Fig. 11(c) and (d), only four harmonics related to inner-race fault are
able to be detected and the noise components are more obvious than those in Fig, 11(b). Comparing Fig.
10(b), Fig. 10(d), Fig. 11(b) and Fig. 11(d) to Fig. 9(c), it reveals that the proposed technique can largely extract
the fault related components from the raw vibration signal and eliminate the influence of noise to enable a more
accurate detection of bearing fault, which demonstrate the effectiveness of proposed method.
What’s more, the Fast Kurtogram[31] is applied to the measured signal, Fig. 12(a) and (c) provide the
Kurtogram of measured signals at point 1 and point 2, respectively. Both the Kurtogram indicates a optimal
band with the central frequency and bandwidth of 15018Hz and 2730Hz. Fig. 12(b) and (d) show the
corresponding square envelope spectrum of optimal band signals. Comparing Fig. 12(b) and (d) to Fig. 9(c), it
reveals that the proposed technique can largely extract the fault related components from the raw vibration signal
and eliminate the influence of noise to enable a more accurate detection of bearing fault, which demonstrate the
effectiveness of proposed method.(a) (b)
(c) (d)
Fig.12. Analyzed results of experimental signal with inner-race defect using Fast Kurtogram; (a) Kurtogram of
signal measured at point 1; (b) square envelope spectrum of the optimal band signal; (c) Fast Kurtogram of signal
measured at point 2; (d) square envelope spectrum of the optimal band signal.
4.2 Bearing outer-race defect identification
Analogously, bearing vibration signals with outer-race defect are also collected.
(a) (b)
(c) (d)
Fig. 13. Vibration signals measured at different points with outer-race defect: (a) the time domain waveform of
signal at point 1; (b) the envelope spectrum of (a); (c) the time domain waveform of signal at point 2; (d) the
envelope spectrum of (c).The waveform of time domain signals and their corresponding envelope spectra ranging from 0 to
2000Hz are shown in Fig. 13. It can be seen from Fig. 13 that both the time domain signals are masked by
noise and the periodic impulses can hardly observed. For signal acquired at point 1, the fault features can be
extracted directly by traditional envelope analysis, while for signal at point 2, the envelope spectrum is
greatly influence by noise and only the spectral line of characteristic frequency is obviously detected.
(a) (b)
(c) (d)
(e) (f)
Fig. 14. Analyzed results of experimental signals with outer-race defect using the proposed method: (a) the curve
of HSI over a chosen range of filter length; (b) the deconvoluted signal using optimal filter length; (c) the
cross-correlation spectrum of (b); (d) the envelope spectrum of (b); (e) the deconvoluted signal when filter length
is 110; (f) the cross-correlation spectrum of (e).
Then, the proposed method is introduced to the experimental signals and results are provided in Fig. 14.
Based on the HSI curve presented in Fig, 14(a), the maximum HSI value can be achieved at the filter length
109 and the deconvoluted signal is displayed in Fig. 14(b) where the noise is removed significantly. Fig.
14(c) exhibits the cross-correlation spectrum of the filtered signal where the fault characteristic frequency
and its higher harmonics are very prominent, which indicates the existence of a defect on the outer race. Fig.
14(d) provides the envelope spectrum of the optimal filtered signal, and the fault features are also extracted
successfully. This may result from that the outer-race fault detection is easier than inner-race fault detection
in the same situation. However, the presence of noise can still be observed in Fig. 14(d), which cannotachieve the optimal result. What’s more, another filter length N=110 with lower HSI value is employed and
the results are displayed in Fig. 14(e) and (f). The 3rd to 5th order harmonics of the fault characteristic
frequency aren’t very prominent in the cross-correlation spectrum, which reveals that a improper selection of
filter length is conducted.
(a) (b)
(c) (d)
Fig. 15. Analyzed results of experimental signals with outer-race defect using the MED; (a) the filtered result using
signal measured at point 1; (b) the envelope spectrum of (a); (c) the filtered result using signal measured at point 2;
(d) the envelope spectrum of (c).
For further comparison, the MED and MCKD is also applied to the measured signals. Fig. 15(a)
displays the deconvoluted result of signal measured at point 1 using the MED, and its envelope spectrum is
provided in Fig. 15(b), which extracts the fault characteristic frequency and its harmonics, the noise has only
a little influence. Fig. 15(c) provides the filtered results of signal measured at point 2 using the MED, and
the corresponding envelope spectrum is presented in Fig. 15(d) where the influence of noise is more obvious
and the features are not as obvious as those in Fig. 15(b). Fig. 16 displays the analyzed results of the
measured signals with outer-race fault using the MCKD. When signal at point 1 is used for analysis, the
envelope spectrum presented in Fig, 16(b) shows prominent fault characteristic frequency components but
the 5th order harmonic are unable to be observed. Fig. 16(c) and (d) display the analyzed results of signal at
point 2. As signal at point 2 contains more noise than signal at point 1, in the envelope spectrum, only 4
spectral peaks related to outer race fault are obvious, the 5th order harmonic is not prominent while the 6th
order and 7th order harmonics are unable to be detected.
The comparison above indicates that the MED and MCKD may result in improper diagnosis when a
bearing defect signal is contaminated by noise, and a randomly selection of parameters can also lead to the
decrease of the ability for fault feature extraction, which further demonstrates the validity of proposed
method for bearing fault detection from vibration signals with strong background noise.
Moreover, the Fast Kurtogram[31] is also employed. Fig. 17(a) displays the Kurtogram of signal
measured at point 1, which indicates an optimal band with central frequency and bandwidth of 13653Hz and
5461Hz, and the square envelope spectrum of optimal band signal is provided in Fig. 17(b) where only thefault characteristic frequency and three of its higher harmonics are able to be observed, the 5-order harmonic
is not prominent while the 3-order and 4-order harmonics are unable to be detected. Fig. 17(c) displays the
Kurtogram of signal measured at point 2, the optimal band is determined with central frequency and
bandwidth of 15680Hz and 128Hz. The square envelope spectrum displayed in Fig .17(d) surely reveals the
wrongly selection of optimal frequency band. The comparison above indicates that the Fast Kurtogram may
result in improper diagnosis when a bearing defect signal is contaminated by noise, which also demonstrates
the validity of proposed method for bearing fault detection from vibration signals with strong background
noise.
(a) (b)
(c) (d)
Fig. 16. Analyzed results of experimental signals with outer-race defect using the MCKD; (a) the filtered result
using signal measured at point 1; (b) the envelope spectrum of (a); (c) the filtered result using signal measured at
point 2; (d) the envelope spectrum of (c).
5. conclusions
This paper presents a new fault diagnosis method for REB based on ACYCBD and cross-correlation
spectrum. In this approach, the ACYCBD is employed to recover impulsive patterns related to bearing
defects, and the optimal filter length is determined adaptively using the maximum value of HSI as a criterion.
The cross-correlation analysis is then employed to further attenuate the uncorrelated background noise, and
bearing fault features can be extracted by the cross-correlation spectrum. The effectiveness of the proposed
technique is verified using both simulation and experimental signals. Results show that the proposed method
can largely remove the presence of noise and provide prominent bearing fault characteristic frequency
components for the fault detection even when the signals are masked by strong background noise, which also
shows advantages over some other traditional fault detection methods. However, the vibration signals
employed for verification is limited in this paper, hence, the proposed method should be applied to analyzing
more vibration signals with bearing defects in future work, especially the signals acquired from real
machine.(a) (b)
(c) (d)
Fig.17. Analyzed results of experimental signal with outer-race defect using Fast Kurtogram; (a) Kurtogram of
signal measured at point 1; (b) square envelope spectrum of the optimal band signal; (c) Fast Kurtogram of signal
measured at point 2; (d) square envelope spectrum of the optimal band signal.
References
[1] Yan XA, Jia MP, Zhang W, et al (2018) Fault diagnosis of rolling element bearing using a new optimal scale
morphology analysis method. ISA Trans 73: 165-180.
[2] Jafarian MJ , Nazarzadeh J (2019) Spectral analysis for diagnosis of bearing defects in induction machine
drives. Electric Power Applications, IET 2019 13: 340-348.
[3] Chen BJ, Shen BJ, Chen FF, et al (2018) Fault diagnosis method based on integration of RSSD and wavelet
transform to rolling bearing. Measurement. DOI: 10.1016/j.measurement.2018.07.043.
[4] Antoni J (2006) The spectral kurtosis: a useful tool for characterising non-stationary signals. Mech Syst Sig
Process 20: 282-307.
[5] Yang HG, Lin HB and Ding K (2018) Sliding window denoising K-Singular Value Decomposition and its
application on rolling bearing impact fault diagnosis. J Sound Vib 421: 205-219.
[6] An XL, Zeng HT, Yang WW, et al (2017) Fault diagnosis of a wind turbine rolling bearing using adaptive
local iterative filtering and singular value decomposition. Trans Inst Meas Control 39: 1643-1648.
[7] Xu YB, Cai ZY, Ding K (2018) An enhanced bearing fault diagnosis method based on TVF-EMD and a
high-order energy operator. Meas Sci Technol 29: 095108.
[8] Zhao HS and Li L (2016) Fault diagnosis of wind turbine bearing based on variational mode decomposition
and Teager energy operator. IET Renewable Power Gener 11: 453-460.
[9] Deng FY, Yang SP, Tang GJ, et al (2017) Self adaptive multi-scale morphology AVG-Hat filter and its
application to fault feature extraction for wheel bearing. Meas Sci Technol 28(4): 045011.
[10] Li YF, Zuo MJ, Chen YJ, et al (2018) An enhanced morphology gradient product filter for bearing fault
detection. Mech Syst Sig Process 109: 166-184.
[11] Dragomiretskiy K and Zosso D (2014) Variational mode decomposition. IEEE Trans Signal Process 62:531-544.
[12] Zhang M, Jiang ZN and Feng K (2017) Research on variational mode decomposition in rolling bearings fault
diagnosis of the multistage centrifugal pump. Mech Syst Sig Process 93: 460-493.
[13] Jiang XX, Wang J, Shi JJ, et al (2019) A coarse-to-fine decomposing strategy of VMD for extraction of weak
repetitive transients in fault diagnosis of rotating machines. Mech Syst Sig Process. DOI:
10.1016/j.ymssp.2018.07.014.
[14] Yan XA, Jia MP and Xiang L (2016) Compound fault diagnosis of rotating machinery based on OVMD and
a 1.5-dimension envelope spectrum. Meas Sci Technol 27: 075002.
[15] Ma J, Wu JD, Wang XD (2018) Incipient fault feature extraction of rolling bearings based on the MVMD
and Teager energy operator. ISA Trans 80:297-311.
[16] Wiggins RA (1978) Minimum entropy deconvolution. Geoexploration 16: 21-35.
[17] Sawalhi N, Randall RB and Endo H (2007) The enhancement of fault detection and diagnosis in rolling
element bearings using minimum entropy deconvolution combined with spectral kurtosis. Mech Syst Sig
Process 21: 2616-2633.
[18] Endo H, Randall RB (2007) Enhancement of autoregressive model based gear tooth fault detection technique
by the use of minimum entropy deconvolution filter. Mech Syst Sig Process 21(2): 906-919.
[19] Jiang C, Liu J, Zhang H, et al (2015) A new bearing fault diagnosis scheme using MED-morphological filter
and ridge demodulation analysis. Journal of Vibroengineering 17(8): 4231-4247.
[20] Li JL, Jiang JS, Fan XH, et al (2018) A New Method for Weak Fault Feature Extraction Based on Improved
MED. Shock Vib 1:11.
[21] Cheng Y, Zhou N, Zhang WH, et al (2018) Application of an improved minimum entropy deconvolution
method for railway rolling element bearing fault diagnosis. J Sound Vib 425: 53-69.
[22] Mcdonald GL, Zhao Q, Zuo MJ (2012) Maximum correlated Kurtosis deconvolution and application on gear
tooth chip fault detection. Mech Syst Sig Process 33: 237-255.
[23] Tang GJ, Wang XL, He YL (2016) Diagnosis of compound faults of rolling bearings through adaptive
maximum correlated kurtosis deconvolution. J Mech Sci Technol 30: 43-54.
[24] McDonald GL, Zhao Q (2017) Multipoint optimal minimum entropy deconvolution and convolution fix:
application to vibration fault detection. Mech Syst Sig Process 82: 461-477.
[25] Buzzoni M, Antoni J, D'Elia G (2018) Blind deconvolution based on cyclostationarity maximization and its
application to fault identification. J Sound Vib 432: 569-601.
[26] Seneff S (1978) Real-time harmonic pitch detector. IEEE Trans Acoust Speech Signal Proces 26: 358-365.
[27] Schroeder MR (1968) Period histogram and product spectrum: New methods for fundamental-frequency
measurement. The Journal of the Acoustical Society of America 43: 829-834.
[28] Zhao M, Lin J, Miao YH, et al (2016) Detection and recovery of fault impulses via improved harmonic
product spectrum and its application in defect size estimation of train bearings. Measurement 91: 421-439.
[29] Klausen A, Robbersmyr KG (2019) Cross-correlation of whitened vibration signals for low-speed bearing
diagnostics. Mech Syst Sig Process.
[30] Antoni J (2007) Cyclic spectral analysis of rolling-element bearing signals: Facts and fictions. J Sound Vib
304: 497-529.
[31] Antoni J (2007) Fast computation of the kurtogram for the detection of transient faults. Mech Syst Sig
Process 21: 108-124.You can also read