Fibonacci Sequence-related Phenomenon During Chondrocyte Proliferation of the Gottingen Pig Knee Tibial Plateau
←
→
Page content transcription
If your browser does not render page correctly, please read the page content below
Fibonacci Sequence-related Phenomenon During
Chondrocyte Proliferation of the Gottingen Pig Knee
Tibial Plateau
xiao jian wang ( wxj990713@163.com )
Shanxi Medical University
Wei Tian
Shanxi Provincial Peoples Hospital
Jian-bo Wu
Shanxi Provincial Peoples Hospital
Jian Zhang
Shanxi Provincial Peoples Hospital
Research Article
Keywords: Chondrocytes, Cell proliferation, Fibonacci sequence, Gottingen pigs
Posted Date: September 28th, 2021
DOI: https://doi.org/10.21203/rs.3.rs-929643/v1
License: This work is licensed under a Creative Commons Attribution 4.0 International License.
Read Full License
Page 1/9Abstract
Background The aim of our study was to observe the quantitative changes in tibial plateau chondrocytes
in the proliferation process from normal Gottingen pigs in vitro and compare them with the Fibonacci
sequence.
Methods Chondrocytes from normal Gottingen pig tibial plateau cartilage were isolated and cultured to
the third generation, and the number of chondrocytes was measured to determine whether the
chondrocyte growth was at the logarithmic growth phase. Chondrocytes were added to cell culture bottles
at very a low density to allow full separation and allow each chondrocyte to grow as independently as
possible. Thirty single chondrocytes were selected, and the number of chondrocyte colonies were
observed and recorded every day.
Results Among the 30 chondrocyte colonies, the changes in the numbers of 16 chondrocyte colonies
were 1, 2, 3, 5, 8, 13, 21, 34, 55, 89, 144, 233, 377, 610, and 987, which conformed to the numbers of the
Fibonacci sequence.The number of other chondrocyte colonies was lower than corresponding numbers
of the Fibonacci sequence at the same time point.
Conclusion The numbers of normal Gottingen pig tibial plateau chondrocytes during the proliferation
process were in line with the numbers of the Fibonacci sequence.Alignment to the Fibonacci sequence
may be the fastest way for changes in the numbers of normal chondrocytes during the proliferation
process in vitro.
Background
The Fibonacci sequence was first described by the Italian mathematician Leonardo Fibonacci 1. He
defined the sequence 0,1 as the first two terms, and the numerical value of the third term is the sum of the
first two terms, namely,α1 = 0α2 = 1,αn = αn−2 + αn−1.The specific values are 0, 1, 1, 2, 3, 5, 8, 13, 21, 34, 55,
89, 144 … Later, it was found that the Fibonacci sequence is closely related to the biological development
of animals and plants in nature 2−4, such as the number of branches of large trees, the number of leaves
of plants, the spiral lines of snail shells and sunflower seeds.Some scholars believe that when an
individual has a certain amount of energy, the proliferation mode conforming to the Fibonacci sequence
may be fastest.
The proliferation of chondrocytes on the tibial plateau of the knee joint has always been a popular
research topic 5–7. Studies have shown that when knee joint degenerative diseases occur, the proliferation
ability of chondrocytes in tibial plateau cartilage is obviously weakened, which eventually leads to
cartilage degeneration 8–11.When we cultured tibial plateau chondrocytes of Gottingen pigs in vitro, we
found that the chondrocyte number of the proliferation process was closely related to the Fibonacci
sequence.
Page 2/9The aim of our study was to observe whether the Gottingen pig tibial plateau chondrocyte number of the
proliferation processwas in line with the Fibonacci sequence.
Materials And Methods
Animal handling
This study was approved by the Ethics Committee of Shanxi Medical University (approval
number:SXMUE2019004). Ten 6-month-old female specific-pathogen free (SPF)-grade Gottingen pigs
(Animal Experiment Center of Shanxi Provincial People's Hospital, China) were euthanized, and cartilage
tissue samples of the bilateral knee tibial plateau were obtained under aseptic conditions. All experiments
were performed in accordance with the Public Health Service Policyand the Guide to the Care and Use of
Laboratory Animals.Cartilage tissue of the Gottingen pig osteoarthritis(OA) knee was subsequently
obtained (via the anterior cruciate ligament cutting model,provided by Professor Wei Lei of Brown
University).
Tibial growth plate chondrocytes
A sterile scalpel was used to cut layers of cartilage tissue in both the normal group and OA group, and
chondrocytes were obtained after tissue clipping and collagenase type II digestion.The isolated
chondrocytes were cultured in Dulbecco's modified Eagle's medium (DMEM) supplemented with 10%
foetal calf serum (FCS) at 37°C in a humidified atmosphere comprising 95% air and 5% CO2. The
chondrocytes were cultured to the third generation (P3) for experiments.
Planting and observation of chondrocytes
The chondrocytes were grown to maturity and added to a T75 culture flask at very low density
(104/bottle).A total of 10 bottles of chondrocytes and a total of 30 chondrocyte colonies were used for
experiments in the normal group and OA group,respectively.After 24 hours of chondrocyte adhesion, three
isolated cells were selected from each bottle for observations and moved to the bottom wall of the culture
bottle for subsequent observations.Every day, the changes in the number of all chondrocyte colonies were
observed, and the corresponding time points were recorded.
Comparison of chondrocyte proliferation between the
normal group and the OA group
The change in the number of chondrocyte colonies in the normal group and OA group was plotted with
observation days and compared with the Fibonacci sequence, and the average norm was calculated as
follows:Average norm=[(N1 -1)2 + (N2 -2)2 + (N3 -3)2 + (N4 -5)2 + (N5-8)2 + (N6-13)2 + (N7-21)2 + (N8 -34)2 +
(N9-55)2+ (N10 -89)2 + (N11 -144)2 + (N12 -233)2 + (N13 -377)2 + (N14 -610)2 + (N15 -987)2]/30(N represents
the number of chondrocytes at the observed time point).
Page 3/9Results
Comparison of normal chondrocyte proliferation with the
Fibonacci sequence
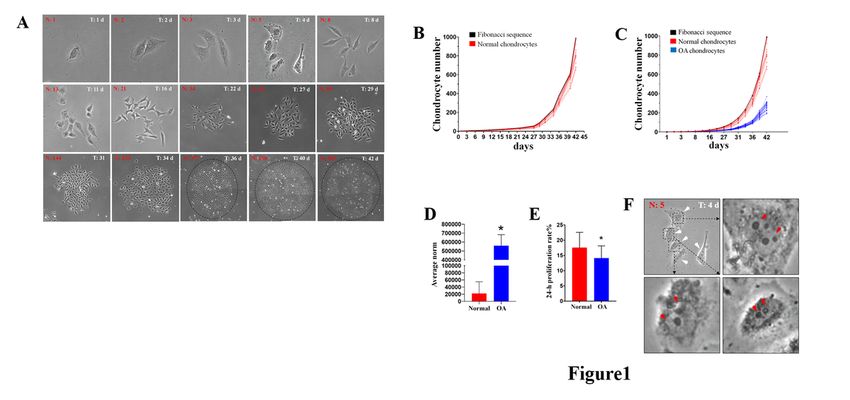
Among the 30 chondrocyte colonies, the changes in the number of 16 chondrocyte colonies were 1, 2, 3,
5, 8, 13, 21, 34, 55, 89, 144, 233, 377, 610, 987at the corresponding time point, which conformed to the
Fibonacci sequence.The number of other chondrocyte colonies was lower than that of the Fibonacci
sequence at the same time point (Table 1, Fig. 1).
Comparison of normal chondrocyte proliferation with OA
chondrocytes
Compared with that of normal chondrocytes, the average norm of chondrocytes in the OA group
increased significantly.This means that the proliferation number of chondrocytes in the OA group is
highly different from the Fibonacci sequence. The proliferation number of chondrocytes in the normal
group was closer to the Fibonacci sequence.The 24-hour average proliferation rate was lower in the OA
group than in the normal group (Table 2, Fig. 1).
Discussion
The Fibonacci sequence is also called the "rabbit sequence" 12. The earliest model problem is as follows:
Suppose there is a pair of young rabbits that grow up after one month, and then they can breed a pair of
young rabbits every month. The young rabbits will also grow up after one month of growth and join the
ranks of young breeding rabbits. Assuming that no rabbits will die, ask how many pairs of rabbits there
are in month X.According to the calculation, the specific values are 1 pair in the first month, 2 pairs in the
second month, 3 pairs in the third month, 5 pairs in the fourth month, 8 pairs in the fifth month, 13 pairs in
the sixth month, 21 pairs in the seventh month, 34 pairs in the eighth month and 55 pairs in the ninth
month, …. Since then, scholars have found that the processes of several aspects of many species in
nature follow the Fibonacci sequence, such as the emergence of large branches, which is as follows: the
thickest trunk is 1, the upward branches are 2, and then the upward branches are 3, 5, 8, .... For example,
the emergence of some plant leaves and the number of petals are consistent with the numbers of the
sequence. Why does this phenomenon occur? Scientists have found through experiments that breeding
processes in line with the Fibonacci sequence are the fastest way,as the energy in animals and plants is
constant this way 2,3 13.
When knee OA occurs, the proliferation ability of chondrocytes in articular cartilage tissue decreases,
which leads to a decrease in both chondrocytes and extracellular matrix secreted by
chondrocytes,ultimately leading to a decrease in cartilage tissue quantity.Therefore, the proliferation
ability of chondrocytes is an important direction to study the development of knee OA 14,15.The division
and proliferation of chondrocytes are affected by many factors.When we cultured chondrocytes in vitro,
Page 4/9we found that the process of chondrocyte division and proliferation did not follow the mode of 1–2,2–
4,4–8; in other words, it was not a 2n series mode.Instead, we found that when a chondrocyte population
divides and proliferates, there are always some chondrocytes in the division stage and the other
chondrocytes in the resting stage.As shown by the red arrow in Fig. 1F, 3 out of 5 chondrocytes are in the
cell division stage (the nucleus is about to divide).
To observe the change in the proliferation number of normal chondrocytes,we added Gottingen pig knee
chondrocytes to culture bottles at very low density,and because of the "ameba" movement of
chondrocytes, when we selected chondrocytes for observation, we selected isolated chondrocytes without
other cells around the microscope field of vision.After 42 days of observation, we found that the
proliferation of normal chondrocytes conformed to the Fibonacci sequence. Sixteen of the 30 observed
chondrocyte colonies essentially conformed to the sequence.The proliferation number of the other
remaining chondrocytes was lower than that of the Fibonacci sequence, and no chondrocyte colony
presenting numbers exceeding those corresponding to this sequence was observed.Moreover, the
chondrocytes in the OA group essentially did not have chondrocyte colonies whose growth followed a
pattern similar to that of the Fibonacci sequence, and the number of chondrocyte colonies that
proliferated in the end was significantly less than that in the normal group.By comparing the average
norm of chondrocyte number and Fibonacci number at the same time point between the two groups, we
found that the average norm of the OA group was significantly larger than that of the normal group.This
shows that the proliferation number of chondrocytes in the OA group deviated from thenumbers of the
Fibonacci sequence more than that in the normal group did.Therefore, we believe that in the process of
the proliferation of Gottingen pig knee chondrocytes, the change in chondrocyte number is close to the
numbers in the Fibonacci sequence under normal circumstances, and when there are interferingfactors
such as cell ageing and the proliferation ability decreases, the number deviates from and becomes lower
than corresponding numbers of the Fibonacci sequence.We even speculate that the fastest of all cell
proliferation methods may be closely aligned to the Fibonacci sequence, but the time differences in
changes in cell numbers are different, which eventually leads to the inconsistency of the cell proliferation
rate after 24 hours.
Conclusion
In summary,we found that the changes in the number of Gottingen pig knee normal chondrocytes in vitro
were very consistent with the Fibonacci sequence, while OA chondrocytes deviated from and were lower
than the corresponding numbers of this sequence.The cell proliferation mode conforming to the
Fibonacci sequence may be the fastest cell proliferation mode.
Our experiment also has some limitations. In this experiment, we found that the change in the number of
chondrocytes on the tibial plateau of normal knees in vitro is in accordance with the numbers of the
Fibonacci sequence. However,the longest observation time was 42 days, and the apoptosis rate of
chondrocytes was not considered. What is the additional relationship between chondrocyte proliferation
and the Fibonacci sequence? Further observations and research are needed.
Page 5/9Abbreviations
OA: Osteoarthritis; OARSI: Osteoarthritis Research Society International (OARSI); NS: normal saline; SPF:
Specific-pathogen free; DMEM: Dulbecco’s modified Eagle’s medium; FCS: Fetal calf serum; P3: Third
generation
Declarations
Acknowledgements
The authors would like to thank Fang Liu for her work on literature search and query. The author also
thanks Gang Zheng and Hong Bi for their work on pathology.
Funding source
This work was supported by grants from the China Postdoctoral Science Foundation (2020M680910),
Fund Program for the Scientific Activities of Selected Returned Overseas Professionals in Shanxi
Province (no.20210019).
Availability of data and materials
Not applicable
Authors' contributions
XJ Wang: study design, data acquisition, data analysis, wrote the manuscript. Wei Tian: statistical
analyses.JB Wu and J Zhang: study design, manuscript correction. All authors have approved the
submitted manuscript.
Competing interests
None declared.
Consent for publication
Not applicable.
Page 6/9Ethical Approval and Consent to participat
This study was approved by the Ethics Committee of Shanxi Medical University [Approval number:
SXMUE(2019004)] (Tai Yuan,China).
References
1. Luttge U, Souza GM. The Golden Section and beauty in nature: The perfection of symmetry and the
charm of asymmetry. Prog Biophys Mol Biol. 2019;146:98–103.
2. Lachowiec J, Queitsch C, Kliebenstein DJ. Molecular mechanisms governing differential robustness
of development and environmental responses in plants. Ann Bot. 2016;117:795–809.
3. Gliroy S, Trewavas A. Signal processing and transduction in plant cells: the end of the beginning?
Nat Rev Mol Cell Biol. 2001;2:307–14.
4. Kirisci M, Karaisa A. Fibonacci statistical convergence and Korovkin type approximation theorems. J
Inequal Appl. 2017;2017:229.
5. Abram SGF. Judge A,Beard DJ,et al.Rates of knee arthroplasty within one-year of undergoing
arthroscopic partial meniscectomy in England: temporal trends, regional and age-group variation in
conversion rates. Osteoarthritis Cartilage. 2019;27:1420–9.
6. Murray IR, Benke MT, Mandelbaum BR. Management of knee articular cartilage injuries in athletes:
chondroprotection, chondrofacilitation, and resurfacing. Knee Surg Sports Traumatol Arthrosc.
2016;24:1617–26.
7. Guermazi A, Roemer FW, Burstein D, et al. Why radiography should no longer be considered a
surrogate outcome measure for longitudinal assessment of cartilage in knee osteoarthritis. Arthritis
Res Ther. 2011;13:247.
8. Stiffel V, Rundle CH, Sheng MH, et al. A Mouse Noninvasive Intraarticular Tibial Plateau Compression
Loading-Induced Injury Model of Posttraumatic Osteoarthritis. Calcif Tissue In. 2020;106:158–71.
9. Hee J, Chaekyu K, Remi-Martin L, et al. Local Clearance of Senescent Cells Attenuates the
Development of Post-Traumatic Osteoarthritis and Creates a Pro-Regenerative Environment. Nat
Med. 2017;23:775–81.
10. Didier P, David G, Daniela P,et al. p16INK4a and Its Regulator miR-24 Link Senescence and
Chondrocyte Terminal Differentiation-Associated Matrix Remodeling in Osteoarthritis. Arthritis Res
Ther. 2014;16:R58.
11. Xue JF, Shi ZM, Zou J, et al. Inhibition of PI3K/AKT/mTOR signaling pathway promotes autophagy
of articular chondrocytes and attenuates inflammatory response in rats with osteoarthritis. Biomed
Pharmacother. 2017;89:1252–61.
12. Kirişci M, Karaisa A. Fibonacci statistical convergence and Korovkin type approximation theorems.
Inequal Appl. 2017;2017:229.
Page 7/913. Lugito G, Nagarajan S, Woo EM. Explosive Fibonacci-sequence growth into unusual sector-face
morphology in poly(L-lactic acid) crystallized with polymeric diluents. Sci Rep. 2020;10:10811.
14. Carballo CB, Nakagawa Y, Sekiya I, et al. Basic Science of Articular Cartilage. Clin Sports Med.
2017;36:413–25.
15. Liu Q, Li M, Jiang L, et al.METTL3 promotes experimental osteoarthritis development by regulating
inflammatory response and apoptosis in chondrocyte. Biochem. Biophys Res Commun.
2019;516:22–7.
Tables
Due to technical limitations, tables are only available as a download in the Supplemental Files section.
Figures
Figure 1
Gottingen pig knee tibial plateau chondrocytes cultured in vitro and the Fibonacci sequence. (A) Changes
in chondrocyte number and morphology at 42 days. (B)Comparison between the proliferation of normal
chondrocytes and the Fibonacci sequence.(C)The proliferation curves of normal chondrocytes and OA
chondrocytes were compared with the Fibonacci sequence.(D)Comparison of the average norm with the
Fibonacci sequence in both the normal chondrocyte group and the OA chondrocyte group.(E)Comparison
of the 24-h proliferation rate between normal chondrocytes and OA chondrocytes.(F)Three(red arrows) of
the five chondrocytes(white arrows) are in a state of division.
Page 8/9Supplementary Files
This is a list of supplementary files associated with this preprint. Click to download.
Table1.jpg
Table2.jpg
Page 9/9You can also read