Financial Information - HORIBA, Ltd. March, 2022
←
→
Page content transcription
If your browser does not render page correctly, please read the page content below
Financial Information
HORIBA, Ltd.
                                                March, 2022
     © 2022 HORIBA, Ltd. All rights reserved.                 1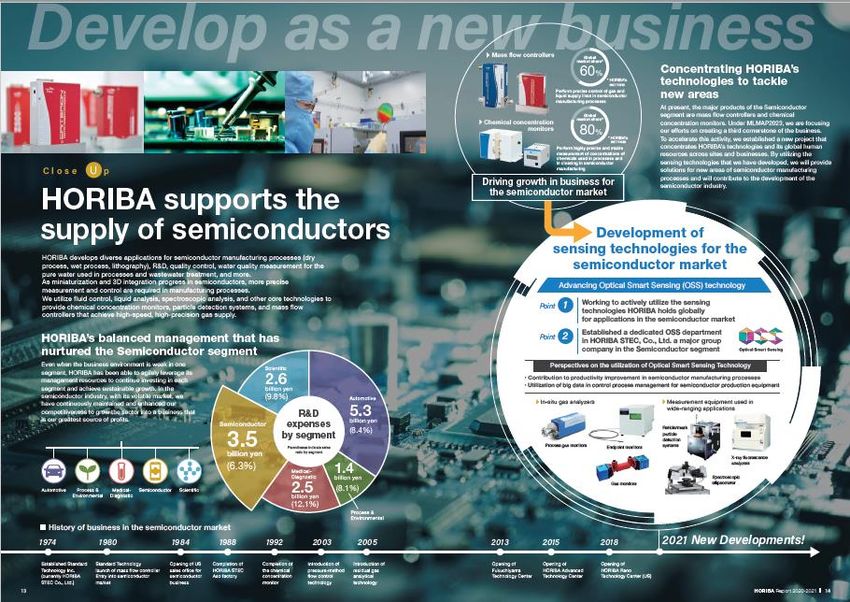
Contents
◼   2021 Results
◼   2021 Forecast
◼   Outlines by Business Segment
◼   Topics - Deepening Cross-segment Activities
◼   Shareholder Return
➢   Financial Data
➢   Corporate Profile

      © 2022 HORIBA, Ltd. All rights reserved.    2
Contents
◼   2021 Results
◼   2021 Forecast
◼   Outlines by Business Segment
◼   Topics - Deepening Cross-segment Activities
◼   Shareholder Return
➢   Financial Data
➢   Corporate Profile

      © 2022 HORIBA, Ltd. All rights reserved.    3
Review of 2021

                       ◆ Increased momentum to de-carbonization and carbon neutral
                       ◆ Accelerated investment in vehicle electrification
 External
                       ◆ Increased investment in semiconductor production equipment due
 Events
                         to increased demand for data transmission
                       ◆ Further heightened interest in life science

                       ◆ Continued investment for growth mainly in China and Europe
                       ◆ Focused development of new technologies and aggressive launch
 Internal                of new products
  Events               ◆ Implemented M&A in the medical and energy fields
                       ◆ Business expansion in new markets related to hydrogen energy
                         and life-science
      © 2022 HORIBA, Ltd. All rights reserved.                                            4
2021 Results                                                                                                   (Billions of Yen)

                                                 2020                         2021
                                                                                                          vs
                                                             Forecasts                   vs
                                                Results                      Results                 Forecasts
                                                           (as of Nov. 11)              2020
                                                                                                   (as of Nov. 11)

                Sales                             187.0          220.0         224.3      +37.2                +4.3
     Operating Profit                              19.6           28.5          32.0      +12.3                +3.5
               O.P.%                               10.5%          13.0%         14.3%     +3.8p            +1.3p
     Ordinary Profit                                19.3           28.0          32.0     +12.6                +4.0
   Net Income attributable
    to Owners of Parent
                                                    13.1           18.5          21.3      +8.1                +2.8

             USD/JPY                              106.76         109.00        109.90      +3.14               +0.90
             EUR/JPY                              121.88         130.00        129.91      +8.03               -0.09

     © 2022 HORIBA, Ltd. All rights reserved.                                                  : Record-high                5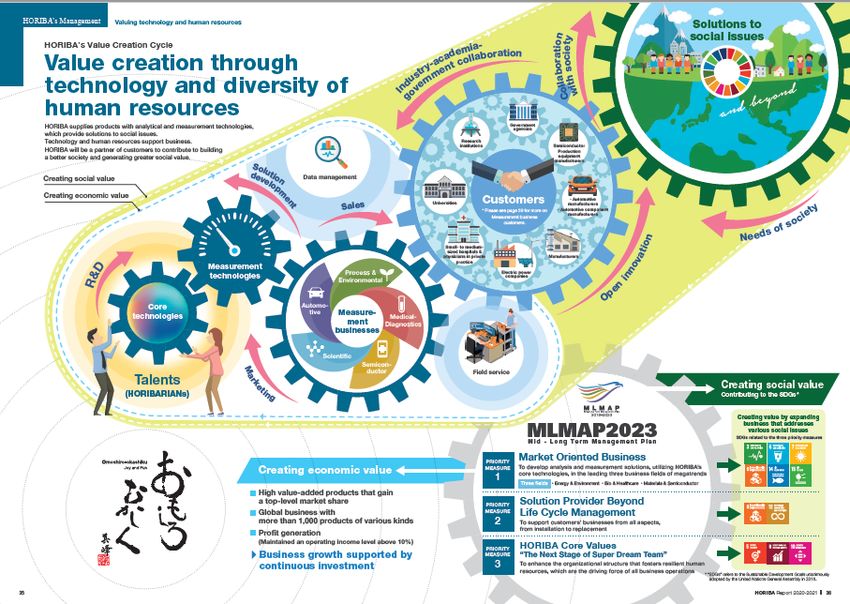
2021 Results by Segment                                                                                                                       (Billions of Yen)

                                                          Sales                                                    Operating Profit
                      2020                                 2021                                  2020                         2021

                                                                     vs         vs                                                      vs           vs
                   Results            Forecasts           Results                               Results   Forecasts          Results
                                        (as of Nov. 11)             2020     Forecasts                     (as of Nov. 11)             2020      Forecasts
                                                                              (as of Nov. 11)                                                      (as of Nov. 11)

  Auto                   63.9                 64.0         61.2       -2.6            -2.7          2.4             1.0        -0.0      -2.4              -1.0
  P&E                    18.3                 21.0         20.2      +1.8             -0.7          1.6             1.5         1.9     +0.3             +0.4
Medical                  21.0                 25.0         25.8      +4.8           +0.8           -0.4             0.5         0.1     +0.5               -0.3
 Semi                    56.9                 81.0         87.0     +30.0           +6.0          14.0           24.0          28.0    +13.9             +4.0
Scientific               26.8                 29.0         29.9      +3.1           +0.9            1.9             1.5         1.9      -0.0            +0.4
  Total               187.0                220.0          224.3     +37.2           +4.3          19.6           28.5          32.0    +12.3             +3.5

                                                                                                                                          : Record-high
          © 2022 HORIBA, Ltd. All rights reserved.                                                                                                                   6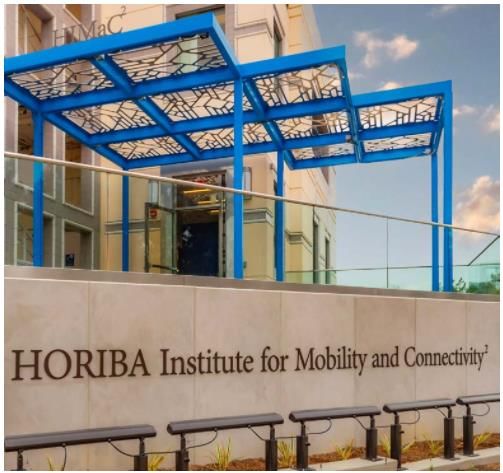
2021 Results (B/S, CF)

                      ◆Total assets were ¥371.5bn, up ¥43.5bn, by increasing in cash
 B/S                   and accounts receivables due to an increase in sales
                      ◆Equity ratio: 54.8%
                                                            (compared to the end of Dec. 2020)

                      ◆Operating CF: Cash in ¥35.2bn due to
                       operating profit
                                                                Free CF: + ¥20.6bn
                      ◆Investing CF: Cash out ¥14.6bn due to
  CF                   capital investments
                      ◆Financial CF: Cash out ¥4.0bn due to
                       payment of dividends
    © 2022 HORIBA, Ltd. All rights reserved.                                                     7
Contents
◼   2021 Results
◼   2021 Forecast
◼   Outlines by Business Segment
◼   Topics - Deepening Cross-segment Activities
◼   Shareholder Return
➢   Financial Data
➢   Corporate Profile

      © 2022 HORIBA, Ltd. All rights reserved.    8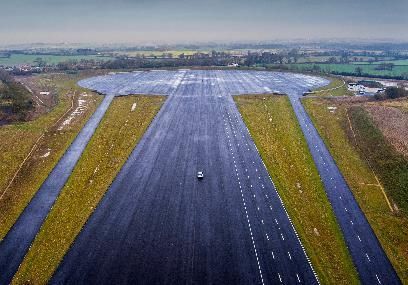
HORIBA’s Assumptions Regarding the Market Environment

                                                 Remain concerned about supply chain of components.
  General                                        Expect economic activities to be revitalized in the “Living with Covid” society.

                                                 Electrification including utilization of hydrogen and autonomous driving technology accelerates.
 Automotive
                                                 Stagnant demand for development investment related to internal combustion engines continues.

                                                 Environmental regulation-driven demand remains strong; the Asian market expands centered
  Process &                                      on air and water quality measurement.
 Environmental
                                                 Decarbonization expands business opportunities in the crude oil processing market.

                                                 Opacity of the market environment, due to uncertainty of timing of containment of COVID-19 in
  Medical                                        different regions.

                                                 Capital investment by semiconductor manufacturers stays high.
 Semiconductor                                   Medium-term, increase in demand for measurement due to technological evolution of
                                                 semiconductor manufacturing processes.
                                                 Strong demand for measurement and analysis equipment for development and manufacturing
 Scientific                                      processes in the semiconductor market.
                                                 Anticipate an increase in demand in the life science market.

          © 2022 HORIBA, Ltd. All rights reserved.                                                                                                  9
2022 Forecasts                                                                                         (Billions of Yen)

                                                2020       2021                  2022
                                                                                         vs
                                               Results    Results    Forecasts
                                                                                        2021

                               Sales             187.0      224.3    250.0                 +25.6

                  Operating Profit                 19.6       32.0    35.0                   +2.9

                              O.P.%               10.5%      14.3%    14.0%                    -0.3p

                    Ordinary Profit                19.3       32.0     34.5                  +2.4
              Net Income attributable
               to Owners of Parent                 13.1       21.3     23.0                  +1.6

            Net profit per share (Yen)             312        505         545                   +40
                                 ROE              7.6%      11.2%       10.8%                  -0.4p

    © 2022 HORIBA, Ltd. All rights reserved.                                      : Record-high                    10
2022 Forecasts by Segment (Billions of Yen)
Sales Operating Profit
2021 2022 2021 2022
vs vs
Results Forecasts 2021 Results Forecasts 2021
Auto 61.2 68.0 +6.7 -0.0 1.5 +1.5
P&E 20.2 23.5 +3.2 1.9 2.0 +0.0
Medical 25.8 28.5 +2.6 0.1 0.5 +0.3
Semi 87.0 96.0 +8.9 28.0 29.0 +0.9
Scientific 29.9 34.0 +4.0 1.9 2.0 +0.0
Total 224.3 250.0 +25.6 32.0 35.0 +2.9
© 2022 HORIBA, Ltd. All rights reserved. : Record-high 11Contents
◼ 2021 Results
◼ 2021 Forecast
◼ Outlines by Business Segment
◼ Topics - Deepening Cross-segment Activities
◼ Shareholder Return
➢ Financial Data
➢ Corporate Profile
© 2022 HORIBA, Ltd. All rights reserved. 12Automotive
2021 Results and 2022 Forecasts (Billions of yen)
*1 Mechatronics *3 Advanced Driver-Assistance Systems
2021 Results *2 Engineering Consultancy & Testing 2022 Forecasts *4 Connected and Autonomous Vehicle
◼ Outlook for internal combustion engine development remained 【EMS】
uncertain. Demand for vehicle electrification expanded. Expect the similar level of capital investment by automotive
【EMS】 manufacturers as in 2021.
• Sales declined as demand driven by regulations has run its 【MCT】
course in Asia region. Expect an increase in sales by faster growth of R&D investment for
• Sales in Japan were sluggish, lowering the profit margin. vehicle electrification and hydrogen energy utilization.
【MCT*1・ ECT*2】 【ECT】
Captured demand related to vehicle electrification and hydrogen Inquiries related to ADAS*3 / CAV*4 and vehicle electrification
energy, and increased sales. increase.
Sales and O.P. (Half Year/Full Year) Sales by Region
Sales
O.P
© 2022 HORIBA, Ltd. All rights reserved. 13Process &
Environment 2021 Results and 2022 Forecasts (Billions of yen)
※1 Carbon dioxide Capture, Utilization and Storage
2021 Results 2022 Forecasts ※2 Total Organic Carbon
◼ Demand for public investment remained firm against the backdrop of 【Gas Monitoring】
environmental regulations, which led to an increase in sales. • Strong demand for product replacement in Japan and Europe.
【Gas Monitoring】 • Increase in demand related to new energy technology (such as
Sales increased in Asia due to strong demand related to environmental hydrogen energy and ammonia combustion power generation) and
regulations. the CCUS*1 related business.
【Water quality】 【Water quality】
Demand for water quality measurement equipment for manufacturing Increase in sales by capturing demand for new products such as TOC*2
processes in the electronics industry, and demand based on analyzers and by responding to regulations.
compliance with environmental regulations were strong.
Sales and O.P. (Half Year/Full Year) Sales by Region
Sales
O.P.
© 2022 HORIBA, Ltd. All rights reserved. 14Medical-
Diagnosis 2021 Results and 2022 Forecasts (Billions of yen)
2021 Results 2022 Forecasts
◼ Sales of test reagents remained sluggish due to the ◼ Expect containment of COVID-19, enabling full normalization of
spread of COVID-19. the number of hospital in-patients.
【Asia and Europe】 ◼ Increase in sales of large-scale analyzers following start of
Increase in sales of hematology analyzers. supply of hematology analyzers to Siemens. Outlook is for
【Americas】 profit contribution over the medium to long term.
Acquisition of MedTest, a provider of clinical chemistry ◼ Further expansion in the clinical chemistry field through the
analyzers and reagents, contributed to increase in sales. business by MedTest.
Sales and O.P. (Half Year/Full Year) Sales by Region
Sales
O.P.
© 2022 HORIBA, Ltd. All rights reserved. 15Semiconductor
2021 Results and 2022 Forecasts (Billions of yen)
2021 Results 2022 Forecasts
◼ Significant increase in sales to semiconductor ◼ Increase in sales to SME manufacturers on the back of
manufacturing equipment (SME) manufacturers, who higher capital investment by semiconductor
expanded capital investment driven by increased manufacturers.
semiconductor demand. ◼ Risk of persistent supply chain issues.
◼ Less-then-expected effects of supply chain problems, that ◼ Growth of new products sales, contributing to
were limited up to the end of 2021. semiconductor manufacturing in addition to the existing
main products.
Sales and O.P. (Half Year/Full Year) Sales by Region
Sales
O.P.
© 2022 HORIBA, Ltd. All rights reserved. 16Scientific 2021 Results and 2022 Forecasts (Billions of yen)
2021 Results 2022 Forecasts
◼ Strong demand and sales increase of optical ◼ Strengthening of analytical and measurement
components for semiconductor manufacturing equipment applications in terms of both technologies and sales.
(SME). Expect to reap the harvest from products recently
◼ A gradual recovery in corporate R&D investment due to introduced to the market.
recovery from the COVID-19 impact led to an ◼ Demand growth for special products in the life science
improvement in sales of particle-size distribution field (i.e., certain pharmaceuticals) and industrial
analyzers and other devices. processes at semiconductor makers.
Sales and O.P. (Half Year/Full Year) Sales by Region
Sales
O.P.
© 2022 HORIBA, Ltd. All rights reserved.
17Contents
◼ 2021 Results
◼ 2021 Forecast
◼ Outlines by Business Segment
◼ Topics - Deepening Cross-segment Activities
◼ Shareholder Return
➢ Financial Data
➢ Corporate Profile
© 2022 HORIBA, Ltd. All rights reserved. 18HORIBA’s Contribution to Social Issues
Cross-segmentation in Response to Various Social Issues
Market Oriented Business
To develop analysis and measurement solutions, utilizing HORIBA’s core technologies,
in the leading three business fields of the mega trend
Energy & Environment Bio & Healthcare Materials & Semiconductor
Automotive
Medical-Diagnostic Semiconductor
Environmental
Process
Scientific
Solution Provider Beyond “Life Cycle Management”
To support customers’ core businesses from all aspects – from product introduction to replacement
Mid-Long Term Management Plan ”MLMAP2023”
© 2022 HORIBA, Ltd. All rights reserved. 19Organizational Restructuring to Deepen Cross-Segments
Our objective: Further growth by creating new businesses
Established the Business Incubation Division
Operations at five centers
Alternative Energy Conversion Center Mobility Solution Business Center
Bio・Life Science Center Optical Smart Sensing(OSS)
(Belongs to HORIBA STEC)
R&D Planning Center Technology Innovation Center
Corporate Officer (CTO)
✓Personnel assigned to cross-segment activities became dedicated full-time. General Manager of
Business Incubation Division
✓Propose solutions that integrate core technologies to the three focused fields in the Hiroshi Nakamura
(Doctor of Engineering)
MLMAP2023.
Simultaneously restructure the organization and work process,
and accelerate product launches
© 2022 HORIBA, Ltd. All rights reserved. 20Concept for reorganization of automotive business
Matured Market Market growth Dawn Market
Response to electrified vehicle
Service (Drive systems etc.)
Lifecycle
*1 Vehicle Resilience:
Management Emission measurement Solutions that eliminate threats associated with advanced vehicle
*2 Advanced Driver-Assistance Systems
VRES*1/Cyber security
Mobility Autonomous vehicle/ADAS*2
Solution
Data science
Business
Model-base development
Alternative Fuel cells/batteries
Energy New energy
Conversion (Hydrogen/alternative energy)
© 2022 HORIBA, Ltd. All rights reserved. 21Service Lifecycle Management(1/2)
Expanding service coverage to include the function of customers’ facility management
Current
Products Services
• Functions Services • Facility management Products
• Performance • Improvement in lab
• Specifications • Stable operation utilization rate and test
of equipment efficiency
Future
【Facility maintenance】
【Equipment maintenance】 【Total facility planning】
High-level utilization of the
Services that contribute to the Enhanced test efficiency and
entire facility and affordable
stable operation of equipment optimal capital investment
maintenance costs
Transformation from equipment sales to facility management business
starting from an installation base
© 2022 HORIBA, Ltd. All rights reserved. 22Service Lifecycle Management(2/2)
Business model transformation starting from 8,000 installed sites
Providing high-quality 【Social needs】
services to make the Vehicle electrification
most of existing facilities ✓ New vehicle demand during
the transition period
✓ EURO7 and other new regulations
【Issues at customers’ sites】
2001-2021 【顧客現場課題】
Shipped about 8,000 units of MEXA Reduced
emission measurement systems 設備投資予算削減
capital investment budget
(currently in operation) ✓ 老朽設備が更新困難
✓ Difficulty to renew aging equipment
HORIBA Techno Service
✓✓ メンテナンス回数減少
Reduced frequency of
HORIBA’s installed sites maintenance
handles the service business
Thoroughly support the transformation of the automotive industry
© 2022 HORIBA, Ltd. All rights reserved. 23Mobility Solution Business(1/2)
Strengthening the supply of solutions for the mobility business
Mobility Solution Business: Focus areas
Model-based VRES*/ Autonomous driving/
Date science
development Cyber security ADAS
✓ Providing applications ✓ From data ✓ Developing efficient ✓ Business development
that support management vehicle evaluation with an eye on potential
New business
customers’ model- platform building to regulation of vehicle
solutions for cyber
evaluation solutions for
based development data utilization security and autonomous driving/
functional safety ADAS functions
Solution development New technology
fields
Enhancement of
technologies Tighter regulations
Approach to the target markets
© 2022 HORIBA, Ltd. All rights reserved. 24
* Vehicle Resilience: Solutions that eliminate threats associated with advanced vehiclesMobility Solution Business(2/2)
Supporting R&D for vehicles in the new fields
HORIBA MIRA to expand global activities
Autonomous driving/ADAS
✓ Comprehensive support for vehicle control performance and
safety evaluation tests for practical use of autonomous driving
technology
➢ Constructed a high-speed marginal behavior evaluation
course, which is equipped with a controllable communication
network (1km in straight line and 300m in diameter) in
December 2021.
➢ Enable digital simulation and feasibility tests seamlessly
(digital-twin).
✓ Developing a comprehensive approach in fields including
automotive cyber security and functional safety
➢ Contracted for a project related to functional safety from the US
emerging EV manufacturer, Rivian Automotive.
VRES/Cyber security
© 2022 HORIBA, Ltd. All rights reserved. 25Alternative Energy Conversion(1/3)
Promoting new application development by utilizing existing business network
Generation Energy conversion Utilization
Existing Existing
Alternative Energy
business area business area
Conversion
Process &
Environmental Automotive
Core
technologies
Sales Sales
network
Concentrate resources on network
developing applications for
Energy related business
new energy industries Automotive industry
(electricity, gas, oil) such as hydrogen Heavy industry
© 2022 HORIBA, Ltd. All rights reserved. 26Alternative Energy Conversion(2/3)
Contributing to carbon neutral strategy in France
✓ In July 2021, Atsushi
Horiba, Chairman ✓ Delivered the
and Group CEO, met electrolyzer test
with President system to GENVIA.
Emmanuel Macron of
France . Support to build
a hydrogen
energy society
✓ A hydrogen technology
✓ “Introduce multiple small nuclear venture company in France
reactors and aim for mass ✓ Clean hydrogen production,
✓ President Macron visited GENVIA’s
production of clean hydrogen factory in November 2021 and energy storage, fuel
using the electric power.” announced an additional investment of application development
(President Macron's speech in €1.9 billion.
➢ Of this amount, €200 million will be GENVIA
October 2021)
used for R&D investment by GENVIA.
© 2022 HORIBA, Ltd. All rights reserved. 27Alternative Energy Conversion(3/3)
Various measures for expanding new energy business
HORIBA Fuelcon: Construction of a new factory HORIBA MIRA: Partnering with Octopus Hydrogen
Architectural rendering (construction to be completed in 2022)
✓ Installed a hydrogen/EV charging
station of Octopus Hydrogen at
HORIBA MIRA for the purpose of
vehicle development.
✓ Produce hydrogen energy from
solar power.
✓ Construction of a new factory with the aim to establish a HORIBA Institute for Mobility & Connectivity2
production system with high ability to respond to demand ✓ A research institute for realization of
✓ An increase in production capacity will enable timely response
power and mobility connectivity
in demand, including shipment to GENVIA, France.
✓ Participated in "H2Giga", a large-scale research and feasibility established at the University of
project on hydrogen technology. California, Irvine
【H2Giga project】 ✓ HORIBA agreed to financial support
✓ Germany's national project aimed at mass production and price in 2018 in anticipation of the coming
reduction of hydrogen electrolyzers
of a sustainable-energy society.
© 2022 HORIBA, Ltd. All rights reserved. 28Bio-life Science(1/2)
Providing a wide range of analytical and measurement solutions for R&D and manufacturing
Bio-life science
Research
institutes
Strengthen
HORIBA’s area of Grow in new areas
expertise
Corporate
R&D Product process
Analysis and evaluation and
measurement in manufacturing
Industrial process
cutting-edge research process monitoring
Concentrate human resources and technologies at the Bio-life Science Center and enhance
coordination of activities in Europe, the US and Japan in order to respond globally
© 2022 HORIBA, Ltd. All rights reserved. 29Bio-life Science(2/2)
Business expansion in the pharmaceutical industry
Propose customized technologies and contribute to the realization of high-quality continuous production
Analysis of small
Analysis of cell / Quality inspection
module medicines Analysis of antibody medicines
biological samples (formulation) for vaccine
✓ Analyze exosomes, ✓ Fast analysis of ✓ Efficient testing of
which are expected medical ingredients vaccines used in the ✓ Reactor
to be applied to in tablets research process monitoring in the
biomarkers manufacturing
process
Chromophoric Dissolved Analytical probe
Organic Matter (CDOM) &
ViewsizerTM Transmission raman fluorescence analyzer, Microscopic raman
3000 spectrometer Aqualog
Exploratory Development Pharmaceutical
research of new drugs manufacturing process
© 2022 HORIBA, Ltd. All rights reserved. 30Optical Smart Sensing (OSS)(1/2)
Develop the sensing technology for semiconductor manufacturing market
Chemical Optical Smart Sensing
Mass flow From R&D to quality control
Concentration
controller In-line process monitoring Measurement equipment used in a wide range of
monitor
applications
Process gas
monitor Gas monitor
End-point
monitor Spectroscopic
X-ray fluorescence analyzers
ellipsometry
Established the business for the Intend to develop as a new business for the
semiconductor market semiconductor market
Diversify applications for the semiconductor market
by utilizing various sensing technologies owned by the HORIBA Group globally
© 2022 HORIBA, Ltd. All rights reserved. 31Optical Smart Sensing (OSS)(2/2)
Deploying solutions that meet customer needs, based on core technologies
Contribute to improving productivity in semiconductor manufacturing processes
Reticle/Mask Particle Detection system PD Xpadion Plasma Emission Monitor EV 2.0
✓ Monitor the state of plasma in the
✓ Fast measurement of particles
semiconductor manufacturing
on reticles* and blanks used in process.
the lithography process ✓ Automatically extract wavelength,
*Surface of pattern/glass/pellicle
which is required to find the endpoint
of etching.
• Fast measurement of micro-sized
particles. Spectroscopic Ellipsometer UVISEL Plus
• Improve detection efficiency by
✓ Analyze characteristics of thin films,
using in combination with defect
surfaces and interfaces.
inspection equipment. • Enable evaluation of ultra-thin films
SiO2 (approx. 9.7nm).
From legacy to cutting-edge processes such as EUV, ✓ Measure changes in film thickness in
the system allows efficient inspection of particles real time by mounting UVISEL Plus in
the chamber.
© 2022 HORIBA, Ltd. All rights reserved. 32Contents
◼ 2021 Results
◼ 2021 Forecast
◼ Outlines by Business Segment
◼ Topics - Deepening Cross-segment
◼ Shareholder Return
➢ Financial Data
➢ Corporate Profile
© 2022 HORIBA, Ltd. All rights reserved. 33Shareholder Return
Dividend payment + Share buyback = 30% of Consolidated net profit to be targeted
Basic policy
Remaining earnings are retained internally for strategic investment (i.e. facilities, M&A)
Dividends per share and Share buybacks
⚫ 2020 Results 90yen [Interim 30yen/Year-end 60yen]
⚫ 2021 Results 150yen [Interim 50yen/Year-end 100yen]
⚫ 2022 Forecasts 160yen [Interim 50yen/Year-end 110yen]
Per-share dividend
Ordinary Div. (yen) Commemorative Div. (yen) Total Return Ratio (%)
200 60.0%
160
Share Buyback 145 45.0%
20 35.4%
120 30.6%
28.2% 30.0% 28.8% 29.7% 29.4%
26.8% 27.4% 30.0%
80 27.6% 160
150
116 125 130
15.0%
40 85 90
60 67 70
0 0.0%
2013 2014 2015 2016 2017 2018 2019 2020 2021 2022F
© 2022 HORIBA, Ltd. All rights reserved. 34Contents
◼ 2021 Results
◼ 2021 Forecast
◼ Outlines by Business Segment
◼ Topics - Deepening Cross-segment
◼ Shareholder Return
➢ Financial Data
➢ Corporate Profile
© 2022 HORIBA, Ltd. All rights reserved. 35Operating Profit Analysis (vs 2020) (Billions of yen)
2020 2021
Jan. – Dec. Jan. – Dec.
Exchange Exchange Increase Increase
Increase Increase impact for impact for R&D Other
19.69 Sales COGS Gross Profit Expense Expense Expense 32.04
+30.13 ー16.76 +3.41 -1.74 -0.71 -1.98
Increase Exchange Increase
Gross Profit +13.37 Impact +1.67 Expenses -2.69
Increase Operating Profit +12.35
© 2022 HORIBA, Ltd. All rights reserved. 36Consolidated Cash Flows (Billions of Yen)
2021 2020 Variation
Cash flows from operating activities +35.2 +32.2 +3.0
Cash flows from investing activities -14.6 -14.0 -0.6
Cash flows from financing activities -4.0 +0.8 -4.8
Cash and cash equivalents at end of year 133.9 114.1 +19.7
Free cash flows +20.6 +18.2 +2.3
© 2022 HORIBA, Ltd. All rights reserved. 37(Consolidated basis, each end of period)
Cash Balance (Billions of Yen)
Total Loan Balance
Cash Bond
77.0
135.0 80.1 redemption
70.3 Cash ¥15.0bn
114.5 (2026)
Bonds ¥15.0bn
44.0 Bonds
30.0 30.0 (2029)
Cash Bonds
95.6 45.0
Cash Bonds Long
Borrowed from
63.6 15.0 Long 25.0 Banks
Long 37.5 ¥15.1bn
Long
17.0 16.8 Short (redemption 2022)
Short 12.0 Short 8.4 Short 9.5 25.1 ¥20.0bn
(redemption 2030)
2018 2019 2020 2021
246% 245% 308% 253% Current ratio
58% 54% 54% 55% Capital ratio
・Recent issuer rating: R&I “A” (Aug. 2021), JCR “A+” (Aug. 2021)
© 2022 HORIBA, Ltd. All rights reserved. 38Exchange Rate
2020 2021 2022
Annual Annual Forecasts vs 2021
USD 106.76 109.90 115 +5.10
EUR 121.88 129.91 130 +0.09
1 yen O.P. sensitivity for 2022 forecast (Yen appreciation)
USD -0.37 billion yen
EUR -0.01 billion yen
© 2022 HORIBA, Ltd. All rights reserved. 39Impact of Fluctuation in Foreign exchange (Billions of Yen)
Exchange rate impact for 2021 Exchange rate impact
(vs 2020) for 2022 Forecasts
1 yen impact of Sales and O.P.
(Yen appreciation)
Increase Sales +7.09
Increase Cost of Goods Sales -3.67 Operating
Impact to Gross Profit +3.41 Sales
Profit
Increase Expenses -1.74 USD -0.72 -0.37
Impact to Operating Profit +1.67 EUR -0.35 -0.01
(Yen) 2020 2021 Diff. 2022
(Yen)
Forecasts
USD 106.76 109.90 +3.14
USD 115.00
EUR 121.88 129.91 +8.03 EUR 130.00
© 2022 HORIBA, Ltd. All rights reserved. 40Capital Investment, Depreciation, R&D (Billions of Yen)
2020 2021 2022
Previous
vs vs vs
Actual Forecasts Actual Forecasts
Previous Forecasts Previous
(as of Nov 11)
Capex 15.1 16.5 12.4 -2.6 -4.0 15.0 +2.5
Depreciation and
amortization
9.6 10.5 10.4 +0.8 -0.0 11.0 +0.5
R&D expenses 15.5 17.0 16.7 +1.1 -0.2 19.0 +2.2
to net sales(%) 8.3% 7.7% 7.4% 7.6%
PP&E:
2022
Continuation : a new facility in China, investment to HORIBA FuelCon’s new facility, etc.
Topics
New : enhance the base of global production
© 2022 HORIBA, Ltd. All rights reserved. 41Contents
◼ 2021 Results
◼ 2021 Forecast
◼ Outlines by Business Segment
◼ Topics - Deepening Cross-segment
◼ Shareholder Return
➢ Financial Data
➢ Corporate Profile
© 2022 HORIBA, Ltd. All rights reserved. 42Five Business Segments & Major Products
Figures are the sales composition ratio for FY 2020
Process &
Automotive Medical Semiconductor Scientific
Environmental
(34%) (11%) (31%) (14%)
(10%)
Emission Measurement Automatic Blood Cell
Stack Gas Analyzers Mass Flow Controllers Raman Imaging Device
Systems Counters plus CRP
© 2022 HORIBA, Ltd. All rights reserved.Global Network
Sales by region (as of Dec 2020) ● : Major business hubs
Americas Europe Asia Japan
15% 21% 33% 31%
Employee headcount by region (as of Dec 2020)
Americas Europe Asia Japan
11% 33% 18% 38%
Number of companies
(as of Dec 31, 2020)
49 Overseas sales ratio
(as of Dec 2020) 69% Foreign employee ratio
(as of Dec 31, 2020) 62%
© 2022 HORIBA, Ltd. All rights reserved.Achieving Sustainable Growth Through M&A
Major M&As
1996 1997 2005 2015 2018
ABX (France) Jobin Yvon SCHENCK DTS MIRA (UK) FuelCon
【Medical】 (France) (Germany) 【Automotive】 (Germany)
【Scientific】 【Automotive】 【Automotive】
Trends in consolidated sales 187.0 billion yen
Six-fold growth in corporate scale in 30 years
1990 2000 2010 2020
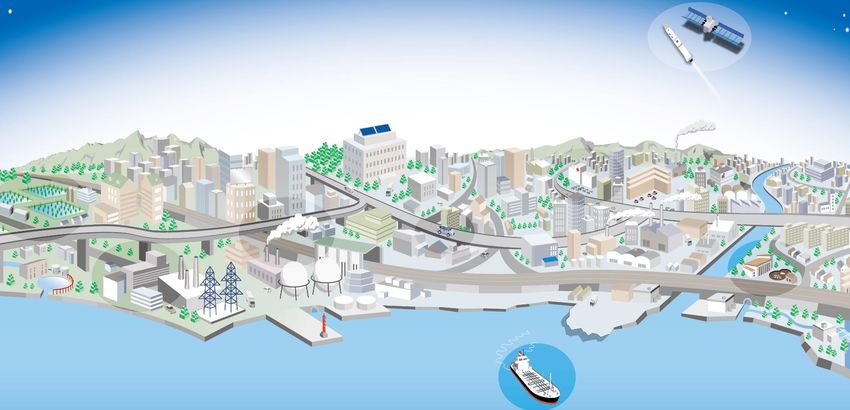
© 2022 HORIBA, Ltd. All rights reserved.HORIBA’s Business Domain
Space Planetary probe
Development Auroral analysis
Agriculture New Material IT Infrastructure Health and Security
Plant factory Development Diagnostic equipment
IoT, Cloud, 5G
Soil analysis Secondary battery New drug development
Automation informatics
Food safety Biomaterial Drinking water
Safety management Steel and ceramics
Manufacturing Process
Semiconductor device
Solar panels
Petrochemical plant
Water Quality Global Environment Automotive/Ship Development
Management Conservation Ultra-low emission
Monitoring system Monitoring air pollution Vehicle electrification, EV
Compliance with Renewable energy/power plant Autonomous driving
waste water regulations Greenhouse gases Regulatory compliance
© 2022 HORIBA, Ltd. All rights reserved.HORIBA Report 2020-2021 (Eng. ver. )
An Integrated Report that conveys HORIBA's "diversity" and “uniqueness"!
https://static.horiba.com/fileadmin/Horiba/Company/Investor_Relations/IR_Library
/HORIBA_Report/20210812_HR_en_01.pdf
© 2022 HORIBA, Ltd. All rights reserved. 47© 2022 HORIBA, Ltd. All rights reserved. 48
You can also read