Food Waste to Energy: How Six Water Resource Recovery Facilities are Boosting Biogas Production and the Bottom Line
←
→
Page content transcription
If your browser does not render page correctly, please read the page content below
EPA 600/R-14/240 | September 2014 | www.epa.gov/ord

Food Waste to Energy: How Six Water
Resource Recovery Facilities are Boosting
Biogas Production and the Bottom Line

   Office of Research and Development

                                        i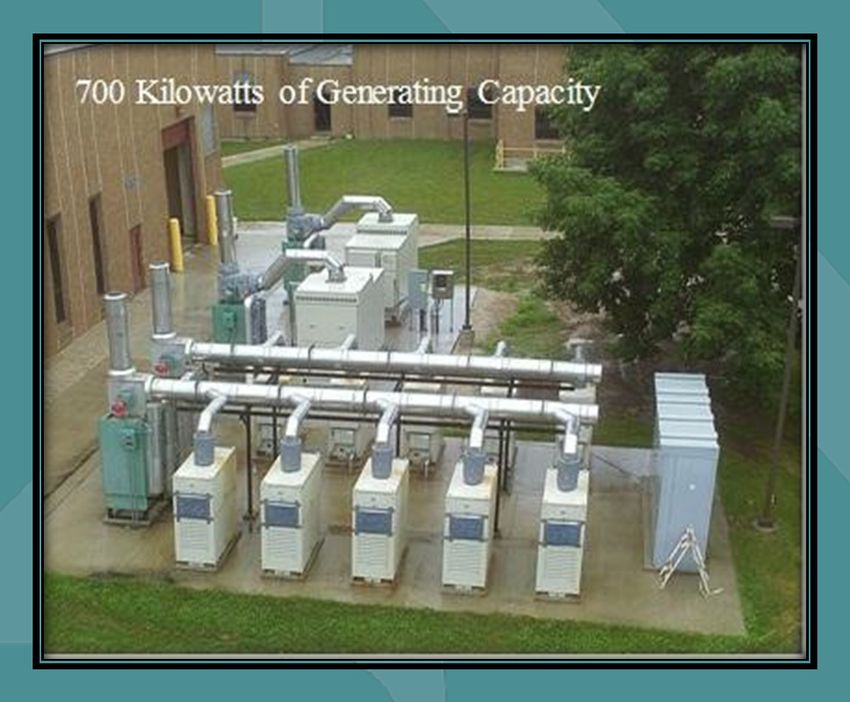
EPA/600/R-14/240
                                         September 2014

[This page intentionally left blank.]

                 ii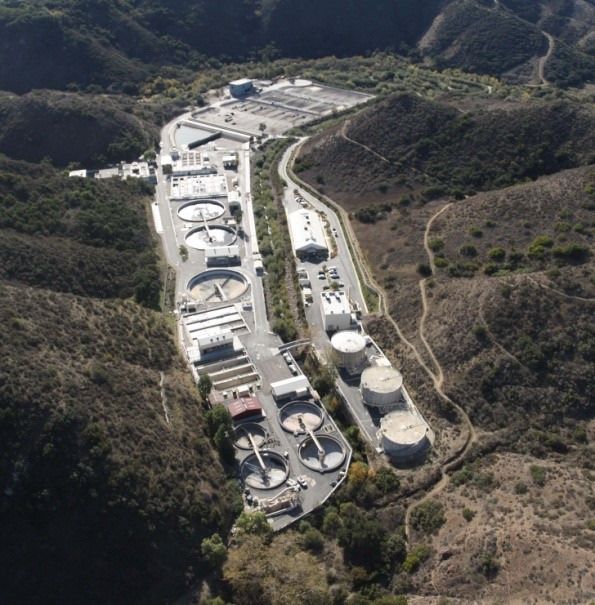
EPA/600/R-14/240
                                           September 2014

                         Food Waste to Energy:
 How Six Water Resource Recovery Facilities are
Boosting Biogas Production and the Bottom Line

                              Region 9 San Francisco, CA and

                   National Risk Management Research Lab
                       Office of Research and Development
                                            Cincinnati, OH

                        iii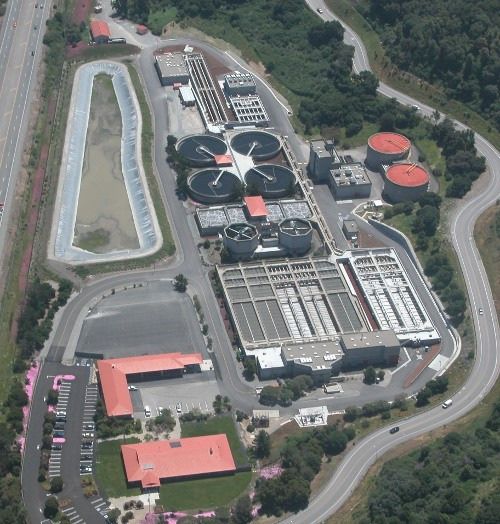
EPA/600/R-14/240
                                                                  September 2014

                                                                     Foreword

The US Environmental Protection Agency (US EPA) is charged by Congress with
protecting the Nation’s land, air, and water resources. Under a mandate of national
environmental laws, the Agency strives to formulate and implement actions leading
to a compatible balance between human activities and the ability of natural systems
to support and nurture life. To meet this mandate, US EPA’s research program is
providing data and technical support for solving environmental problems today and
building a science knowledge base necessary to manage our ecological resources
wisely, understand how pollutants affect our health, and prevent or reduce
environmental risks in the future.

The National Risk Management Research Laboratory (NRMRL) is the Agency’s
center for investigation of technological and management approaches for
preventing and reducing risks from pollution that threaten human health and the
environment. The focus of the Laboratory’s research program is on methods and
their cost-effectiveness for prevention and control of pollution to air, land, water,
and subsurface resources; protection of water quality in public water systems;
remediation of contaminated sites, sediments and ground water; prevention and
control of indoor air pollution; and restoration of ecosystems. NRMRL collaborates
with both public and private sector partners to foster technologies that reduce the
cost of compliance and to anticipate emerging problems. NRMRL’s research
provides solutions to environmental problems by: developing and promoting
technologies that protect and improve the environment; advancing scientific and
engineering information to support regulatory and policy decisions; and providing
the technical support and information transfer to ensure implementation of
environmental regulations and strategies at the national, state, and community
levels.

This publication has been produced as part of the Laboratory’s strategic long-term
research plan. It is published and made available by US EPA’s Office of Research
and Development to assist the user community and to link researchers with their
clients.

                                          Cynthia Sonich-Mullin, Director
                          National Risk Management Research Laboratory

                                         iv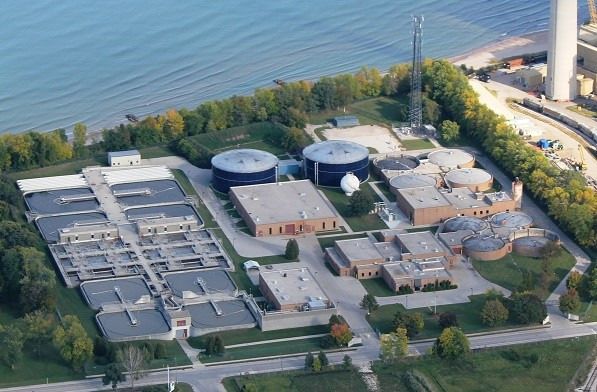
EPA/600/R-14/240
                                                           September 2014

                                                                   Abstract
Water Resource Recovery Facilities (WRRFs) with anaerobic digestion have
been harnessing biogas for heat and power since at least the 1920’s. A few are
approaching “energy neutrality” and some are becoming “energy positive”
through a combination of energy efficiency measures and the addition of
outside organic wastes. Enhancing biogas production by adding fats, oil and
grease (FOG) to digesters has become a familiar practice. Less widespread is
the addition of other types of food waste, ranging from municipally collected
food scraps to the byproducts of food processing facilities and agricultural
production. Co-digesting with food waste, however, is becoming more
common. As energy prices rise and as tighter regulations increase the cost of
compliance, WRRFs across the county are tapping excess capacity while
tempering rates. This report presents the co-digestion practices, performance,
and the experiences of six such WRRFs. The report describes the types of food
waste co-digested and the strategies—specifically, the tools, timing, and
partnerships—employed to manage the material. Additionally, the report
describes how the facilities manage wastewater solids, providing information
about power production, biosolids use, and program costs.

                                      v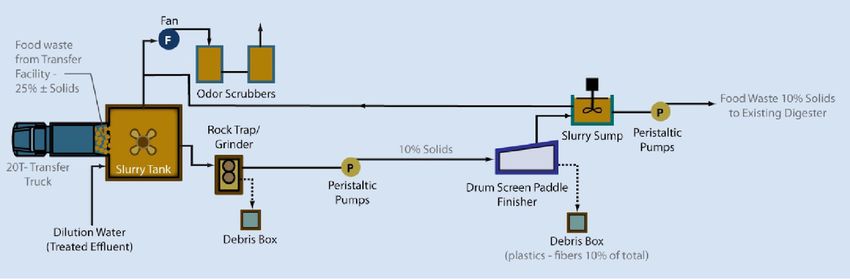
EPA/600/R-14/240
                                                             September 2014

                                   Acknowledgements and Notice
We are very thankful to the six interviewed Water Resource Recovery Facilities.
Staff generously contributed their time and expertise. Jason Dow, Sophia Skoda,
John Hake, Chuck Rogers, Joe Zakovec, Sharon Thieszen, and David S. Henderson
not only participated in the original interviews, but continued to work with EPA
over the last year. Thank you Jason, Sophia, John, Chuck, Joe, Sharon and David
for sharing your facility’s story with EPA, and for allowing us to share it with
communities across the country.

Lauren Fillmore (Senior Program Director, Water Environment Research
Foundation, Alexandria, VA), Robert B. Williams (Development Engineer, UC
Davis California Biomass Collaborative, Davis, CA), Greg Kester (Director of
Renewable Resource Programs, California Association of Sanitation Agencies,
Sacramento, CA) and Jason Turgeon (Physical Scientist, EPA Region 1, Boston,
MA) peer-reviewed the report. Thank you, Lauren, Rob, Greg, and Jason for your
suggestions and corrections.

Charlotte Ely led the team to produce the report with Sarah Hardy, Andrea Sproul,
Suzanne Maher, and Steve Rock.

This report has been peer reviewed by the U.S. Environmental Protection Agency
Office of Research and Development and approved for publication. Mention of
trade names or commercial products does not constitute endorsement or
recommendation by EPA for use.

                                        vi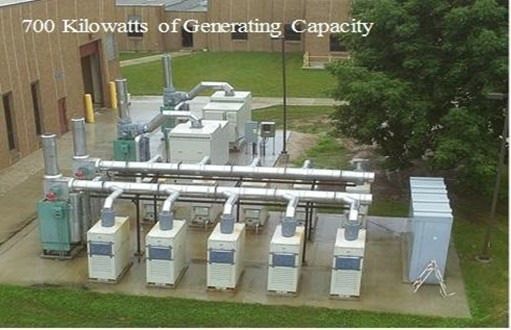
EPA/600/R-14/240
                                                                                                              September 2014

Table of Contents
Table of Contents .......................................................................................................................... vii
List of Figures ............................................................................................................................... vii
List of Tables ................................................................................................................................ vii
List of Appendices ....................................................................................................................... viii
List of Abbreviations, Acronyms, and Initialisms ......................................................................... ix
1      Introduction .......................................................................................................................... 1
   1.1       Managing Waste More Sustainably .............................................................................................. 1
   1.2       Generating Renewable Energy...................................................................................................... 2
   1.3       Ensuring Affordable Rates ............................................................................................................ 3
   1.4       Celebrating Success: Six examples of WRRF co-digestion projects ............................................ 4
2         What is co-digested? ............................................................................................................ 8
3         How much is co-digested, and when? How is it delivered? ............................................. 10
4         How much is stored? What processing is required? .......................................................... 12
5         How much is biogas is produced? How is it used? ............................................................ 16
6         How much biosolids are produced? How are they managed? ........................................... 20
7         How much did the facilities invest in co-digestion infrastructure? ................................... 22
8         Summary & Conclusions ................................................................................................... 26
9         Appendices ......................................................................................................................... 29
10        References .......................................................................................................................... 36

List of Figures
Figure 1: Total MSW waste by percentage after recycling and composting .................................. 1
Figure 2: Comparing the carbon footprint of several food waste disposal options ........................ 2
Figure 3: Description of a 1922 biogas to energy project ............................................................... 3
Figure 4: Wastewater treatment facility photos .............................................................................. 6
Figure 5: EBMUD process schematic........................................................................................... 12
Figure 6: Marin Sanitation Service process schematic ................................................................. 13
Figure 7: Central Marin Sanitation Agency process schematic ................................................... 13
Figure 8: West Lafayette WRRF’s partnership with Purdue University ...................................... 14
Figure 9: Microturbines at the Sheboygan WRRF ....................................................................... 17

List of Tables
Table 1: Basic facility descriptions ................................................................................................. 5
Table 2: Types of co-digested food waste ...................................................................................... 9
Table 3: Food waste (FW): Volume and delivery process ........................................................... 11
Table 4: Food waste storage and processing................................................................................. 15
Table 5: 2013 Renewable Volume Obligations (U.S. EPA 2013, U.S. EPA 2014e). .................. 18
Table 6: Biogas production, storage, and use at interviewed facilities ......................................... 19
Table 7: Biosolids management .................................................................................................... 21
Table 8: FY13-14 rates for EBMUD tipping fees ........................................................................ 23
Table 9: Cost, savings, and revenue.............................................................................................. 25

                                                                        vii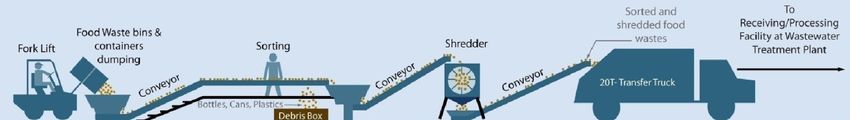
EPA/600/R-14/240
                                                                                           September 2014

List of Appendices
Appendix A: Survey questions for WRRFs .................................................................................. 29
Appendix B: Example Standard Operating Prodecures ................................................................ 31

                                                            viii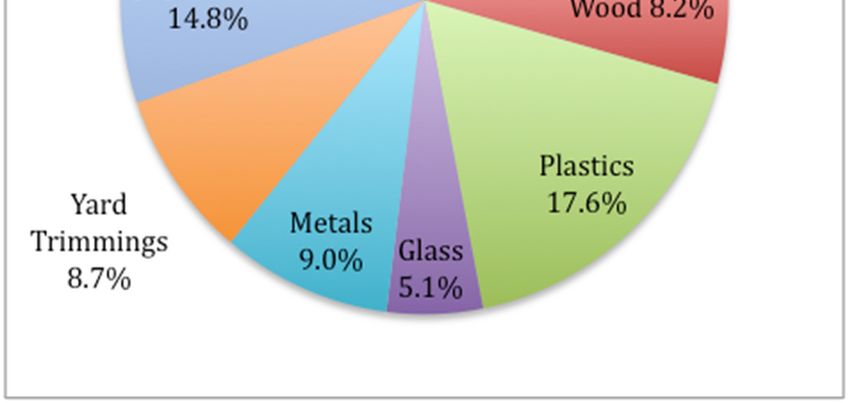
EPA/600/R-14/240
                                                                             September 2014

List of Abbreviations, Acronyms, and Initialisms
AD                    Anaerobic digester
ADC                   Alternative daily cover
ADM                   Anaerobically digested materials
ADWF                  Average dry weather flow
ARRA                  American Reinvestment and Recovery Act
BOD                   Biochemical oxygen demand
GGE                   Gallons of gasoline equivalent
CARB                  California Air Resources Board
CEC                   California Energy Commission
CHP                   Combined heat and power
CHPCE                 CHP Clean Energy
CMSA                  Central Marin Sanitation Agency
CNG                   Compressed Natural Gas
CPI                   Consumer price index
CPUC                  California Public Utilities Commission
CWSRF                 Clean Water State Revolving Fund
EA                    Enforcement Agency Notification
EBMUD                 East Bay Municipal Utility District
EPA                   Environmental Protection Agency
F2E                   Food to energy
FIT                   Feed-in Tariff
FOG                   Fats, oil, and grease
GGE                   Gallons of gasoline equivalent
HCTP                  The Hill Canyon Wastewater Treatment Plant
ICE                   Internal combustion engine
kW, kWh/MGD           Kilowatts, Kilowatt hours per million gallons a day
LCFS                  Low carbon fuel standard
MSS                   Marin Sanitation Service
MG                    Million gallons
MGD                   Million gallons per day
MSW                   Municipal Solid Waste
MW, MWh               Megawatts, Megawatt hour
NPDES                 National Pollution Discharge Elimination System
O&M                   Operations and maintenance
PG&E                  Pacific Gas and Electric
PPA                   Power purchase agreement
RFS                   Renewable Fuel Standard
RAM                   Renewable Auction Mechanism
RIN                   Renewable Identification Number
RVO                   Renewable Volume Obligations
SGIP                  Self generation incentive program
SRF                   State Revolving Fund
SWRCB                 State Water Resources Control Board
WDR                   Waste Discharge Requirement
WERF                  Water Environmental Research Foundation
WRRF                  Water Resource Recovery Facility (a.k.a WWTFs)
WWTF                  Wastewater Treatment Facilities

                                                   ix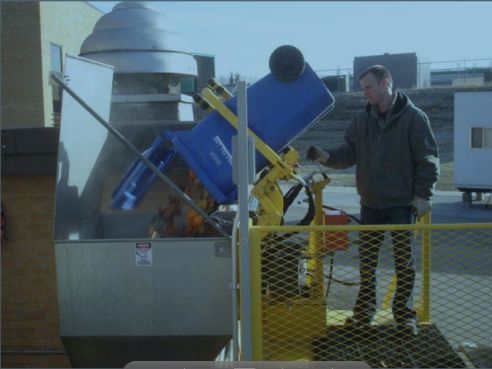
Food Waste to Energy

1 Introduction
To protect human health and the environment, communities must have adequate infrastructure to handle
waste, critically the waste we throw away (solid waste) and the waste we flush down toilets (wastewater).
Modern solid waste and wastewater management approaches have remedied many of the historically
associated aesthetic, ecological, and public health problems; but they have engendered systems that
contribute to current crises, notably climate change. By diverting energy-rich food waste from landfills to
existing anaerobic digesters at Water Resource Recovery Facilities (WRRFs), co-digestion can help
communities manage waste more sustainably, generate renewable energy, and continue to provide
essential services at affordable rates. To help communities evaluate solid waste and wastewater
management options, this report presents the co-digestion practices and performance of six WRRFs,
providing information about the food waste material, including receipt, storage and processing; biogas
and biosolids production and use; and program costs.

1.1      Managing Waste More Sustainably
Landfills are the third largest anthropogenic source of methane (CH4) emissions in the United States,
accounting for 18.1% of total emissions in 2012 (U.S. EPA 2014b). While emitted in smaller quantities
than carbon dioxide (CO2), CH4
currently contributes to more than
one-third of today’s anthropogenic
warming because its global warming
potential is 25 times greater than
CO2 (Global Methane Initiative
2014).

Figure 1: Total MSW waste by
percentage after recycling and
composting (U.S. EPA 2014a)

According to the U.S.
Environmental Protection Agency
(EPA), food waste represents 14.5%
of the municipal solid waste (MSW)
stream, and most of what’s
generated is wasted. Of the more 251
million tons of MSW Americans
generated in 2012, food waste
comprised 36.43 million tons, only
1.74 million tons (4.8%) of which
was recovered (U.S. EPA 2014a). Of
the 163 million tons of discarded MSW, food waste comprised 34.69 million tons, or 21% of total MSW
discards (Figure 1). By diverting food waste from landfills and into existing WRRF digesters,
communities can reduce greenhouse gas emissions and protect water quality.

Co-digestion at WRRFs can reduce the carbon footprint of waste management by diverting food waste
from landfills, where methane may be generated and released into the atmosphere; by capturing and
combusting CH41; by minimizing MSW hauling distances, reducing truck traffic and associated air
1
  Of the 2,400 or so currently operating or recently closed MSW landfills in the United States, only 636 have methane utilization projects (U.S.
EPA 2014c). Furthermore, landfill methane capture efficiency varies considerably—from as low as 35% to as high as 90% (Spokas et al 2006),
resulting in significant fugitive emissions. In comparison, WRRFs harness methane much more efficiently, typically capturing and combusting
99% of the biogas produced in their anaerobic digesters (WERF 2012a).

                                                                        1
Food Waste to Energy
emissions (DiStefano and Belenkey 2009); and by sequestering carbon into soil structure through the land
application of biosolids (Brown and Leonard 2004). In an evaluation of food waste disposal options, the
Water Environmental Research Foundation (WERF) identified co-digesting hauled-in food waste at
WRRFs as the only carbon negative, i.e. greenhouse gas reducing, waste management strategy (Figure 2)
(WERF 2012a).
Figure 2: Comparing the carbon footprint of several food waste disposal options:
landfilling, composting, delivering food waste to WRRFs via sewers, hauling food waste to
WRRFs via trucks, and separating food waste at a mixed materials recovery facility (MRF)
(WERF 2012a)
Diverting food waste from landfills can also protect water quality. When waste decomposes in landfills, it
creates leachate, a liquid composed primarily of dissolved organic matter, inorganic ions such as
ammonia, phosphate, and sulfate, and heavy metals (Christensen et al. 2001). Diverting food waste from
landfills reduces the volume of organic matter, correspondingly reducing not only the amount of leachate
but also the concentration of dissolved organic matter in the leachate. Leachate leaks from landfills
without adequate liners, percolating into soils and groundwater, potentially increasing biological oxygen
demand and nutrient loads in adjacent water bodies (Camargo and Alonso 2006, Diaz 2001, Kronvang et
al. 2005). By diverting food waste, landfills are less likely to contribute eutrophic and hypoxic events and
hence can help protect water quality.
1.2 Generating Renewable Energy
Delivering water and wastewater services is an energy-intensive effort, as the water is treated, pumped,
and consumed, and then the resulting wastewater is pumped to and treated at WRRFs. WRRFs in the
United States use approximately 30.2 billion kWh per year, or about 0.8% of national electricity use
(Electric Power Research Institute 2013). Water and wastewater utilities are typically the largest energy
consumers in municipalities, often accounting for 30-40% of total energy consumed by municipal
governments (U.S. EPA 2012). For WRRFs, energy bills can be ~30% of total operation and
maintenance (O&M) costs (Carns 2005), usually representing a facility’s second or third biggest expense.
2Food Waste to Energy
While WRRFs consume a lot of energy, they also have the potential to harness energy. Municipal
wastewater contains five to ten times as much chemical and thermal energy as is currently required to
treat it (WERF 2011). WRRFs with anaerobic digesters can utilize existing infrastructure to become net
producers of energy (Frijns et al. 2013).When microorganisms break down organic materials in the
absence of oxygen, they produce biogas as a byproduct. Biogas, composed primarily of CH4 (60 to 70%)
and CO2, can be used as a fuel source, much like natural gas. Fueling engines with biogas generates
electricity and heat, providing many benefits to WRRFs, such as producing power at a cost below retail
rates, displacing purchased fuels for thermal needs, and enhancing power reliability for the plant.
“Sewage gas” has been powering some WRRFs since at least the 1920s (Figure 3).
Figure 3: Description of biogas to energy project in Birmingham, England (Popular Science
Monthly 1922)
According to a 2013 study, 1,238 American WRRFs process wastewater solids with anaerobic digesters;
85% (1,054) beneficially use the biogas, and 22% (270 facilities) generate electricity (Qi, Beecher and
Finn 2013). While Combined Heat and Power (CHP) systems help facilities save money on displaced
energy needs, they also require substantial investments, both immediately (i.e. purchasing equipment) and
over the long-term (i.e. operation and maintenance costs). Even with energy savings, installing or
expanding a CHP system may not appear to be a financially viable option, particularly for smaller
WRRFs.
1.3 Ensuring Affordable Rates
WRRFs interested in CHP systems but deterred by lengthy payback periods have several options. They
could apply for a grant. They could raise rates. They could increase energy efficiency and boost biogas
3Food Waste to Energy
production. These strategies are increasingly common and increasingly necessary. To address population
change, climate change impacts, increased energy costs, deteriorating infrastructure, and stricter water
quality regulations, WRRFs must invest in repairs and upgrades.
Many cities spend more money than they take in on providing sewer services. Between 1991 and 2005,
local governments, on average, generated only 88% of the funds expended (U.S. Conference of Mayors
2007). Nationally, the wastewater “funding gap” amounts to billions of dollars. Over the next 20 years,
the country nationally faces a shortage of $298.1 billion for wastewater and stormwater needs (U.S. EPA
2008). Historically, the federal government provided about 70% of the funds needed to build and upgrade
treatment plants (U.S. EPA 2000). Today, about 25% of the public funding for water infrastructure
projects is provided by the federal government (Musick 2010).
Since the dissolution of the construction grants program, the federal government’s largest contribution to
America’s wastewater infrastructure has been through the EPA’s Clean Water State Revolving Fund
(CWSRF). Over the last two and half decades, the CWSRF provided over $100 billion in low-interest
loans. But the country’s projected wastewater infrastructure costs over the next 20 years are nearly three
times greater than what EPA has funded over the past 25. With less public funding available and
increased costs expected, creative financing is essential.
For many WRRFs, boosting biogas production by co-digesting with food waste may help bridge funding
gaps. For facilities that do not produce sufficient biogas to economically justify CHP, co-digestion can
improve project economics and, in many cases, be the tipping point for investing in CHP (WERF 2012b).
For facilities already invested in CHP, co-digestion can facilitate goals for energy independence.
Minimizing and, for an increasing number of WRRFs, eliminating energy costs conserves capital needed
for repairs and upgrades. Furthermore, FOG and food waste tipping fees can generate revenue. By saving
money on energy and earning money through tipping fees, many WRRFs can secure funding for capital
improvements that would otherwise be obtained by raising rates.
1.4 Celebrating Success: Six examples of WRRF co-digestion projects
An estimated 216 WRRFs located in the U.S. haul in food waste (primarily FOG) for co-digestion with
sewage sludge. This accounts for approximately 17% of WRRFs that process sewage sludge using
anaerobic digestion (Qi, Beecher, and Finn 2013). This report presents the experiences of six WRRFs that
are co-digesting with food waste to boost biogas production. These facilities were selected because they
were willing to share their stories. Based on published articles, webinars, and conference presentations,
numerous WRRFs were identified as potential candidates. Candidate plants were contacted and asked to
participate. Six responded. Those who responded were given a list of questions (Appendix A), the
answers of which provided a basic understanding of the operation and management of the plant. After the
plant operators compiled the requested data, interviews were conducted over the phone. While a limited
sample, they nonetheless reflect the diversity of their sector, varying in capacity and employing
management strategies suited to their unique infrastructural, geographic and economic circumstances. The
following plants were interviewed (also see Table 1, Figure 4):
The Central Marin Sanitation Agency (CMSA) is located in San Rafael, California. CMSA is a
regional wastewater agency serving about 120,000 customers. Up to six billion gallons of wastewater per
year are treated and released. The CMSA treats an average dry weather flow (ADWF) of seven million
gallons per day (MGD) with the capacity to treat 125 MGD. The WRRF has two anaerobic digesters,
with a combined capacity of approximately two million gallons (MG). The facility started their co-
digestion program in 2013 with FOG and began receiving food waste in late January 2014. Before co-
digestion, CMSA produced enough biogas to provide approximately eight hours of power. With co-
digestion, they are hoping to meet all the plant’s power needs with the biogas produced on site.
4Food Waste to Energy
The East Bay Municipal Utility District (EBMUD) serves approximately 650,000 people in an 88-
square-mile area along the east shore of the San Francisco Bay, treating wastewater from Alameda,
Albany, Berkeley, El Cerrito, Emeryville, Kensington, Oakland, Piedmont, and a part of Richmond. The
facility treats an ADWF of 60 MGD with the capacity to treat 168 MGD. It has 11 anaerobic digesters
with the combined capacity of approximately 22 MG. EBMUD began co-digesting in 2002 and, in 2012,
EBMUD became the first wastewater treatment plant in North America to produce more renewable
energy onsite than is needed to run the facility.
The Hill Canyon Wastewater Treatment Plant (HCTP) provides wastewater treatment for 90% of the
128,000 residents of Thousand Oaks in California. HCTP currently treats an ADWF of 9.5 MGD and has
the capacity to treat 14 MGD. The digester design capacity is 2.8 million gallons. Biogas produced from
digested solids and food waste fuels a 295 kW and a 630 kW engine. Hill Canyon will soon become
energy positive.
The Sheboygan Regional Wastewater Treatment Facility in Wisconsin, serves the city of Sheboygan,
Sheboygan Falls, Village of Kohler, the Town of Lima, the Town of Sheboygan, and the Town of Wilson.
The WRRF treats an average dry weather flow of 18.4 MGD and has the capacity to treat 56.8 MGD.
The WRRF has three anaerobic digesters with a capacity of 4.8 MG. The resulting biogas fuels ten 30kW
and two 200 kW microturbines, producing 2,300 megawatt hours of electricity annually. This is used to
meet 90% of the facility’s annual electrical needs and 85% of its annual heating requirements.
The West Lafayette Wastewater Treatment Utility in Indiana serves West Lafayette’s 29,000 residents
and Purdue University. The plant treats an ADWF of 7.8 MGD, and has the capacity to treat 10.5 MGD.
West Lafayette has two anaerobic digesters with a combined capacity of 1.0 MG. On average, the facility
meets 20% of its power needs using the biogas generated on-site.
The Janesville Wastewater Treatment Facility in Wisconsin serves approximately 62,000 people. The
facility’s ADWF is 12.5 MGD with a capacity of 17.75 MGD. The anaerobic digester capacity is 2.5
MG. In 2013, the facility co-digested approximately 300,000 gallons of food waste. 90% of Janesville’s
biogas is used to generate electricity that is sold to the grid, enabling the facility to meet 27% of its
electricity needs and 65% of its digester heating needs. The remaining biogas (10%) is used to produce
clean natural gas for use in facility vehicles.
Table 1: Basic facility descriptions
Facility Name Location Treatment Plant Flow Anaerobic
(MGD) Digester (MGD)
ADWF Capacity Capacity
CMSA San Rafael, CA 7.0 125.0 2.0
EBMUD Oakland, CA 60.0 168.0 22
Hill Canyon Thousand Oaks, CA 9 14 2.8
Sheboygan Sheboygan, WI 18.4 56.8 4.8
West Lafayette West Lafayette, IN 7.8 10.5 1.0
Janesville Janesville, WI 12.5 25 2.5
5Food Waste to Energy
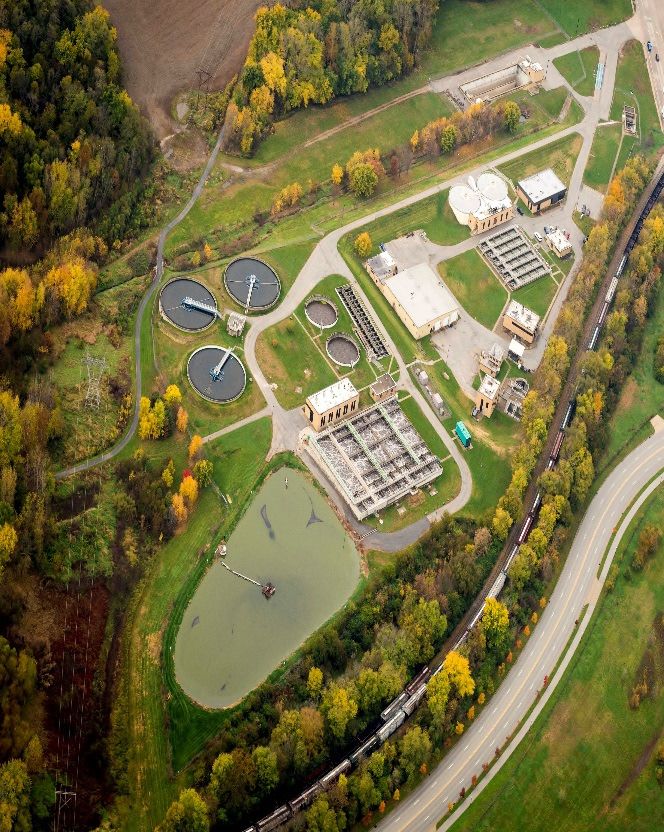
Figure 4: Wastewater treatment facility photos
Photo provided courtesy of CMSA Photo provided courtesy of EBMUD
Photo provided courtesy of Hill Canyon Photo provided courtesy of Sheboygan
6Food Waste to Energy
Photo provided courtesy of West Lafayette Photo provided courtesy of Janesville
7Food Waste to Energy
2 What is co-digested?
Increasingly, water resource recovery In 2002, EBMUD partnered with San Francisco and its
facilities (WRRFs) with excess digester waste hauler, Recology, to co-digest post-consumer food
capacity are co-digesting a variety of waste. Recology collects an average of 600 tons of
organic waste materials, especially source-separated organic material each day, 20-40 tons of
energy-rich carbohydrate, protein, and which has been preprocessed and delivered to EBMUD.
lipid wastes.
In 2014, CMSA partnered with the Marin Sanitation
• Lipid wastes include fats, oils, and Service (MSS) to launch the Central Marin Food-to-
greases (collectively referred to as Energy Program. MSS collects post-consumer food waste
FOG). from 41 commercial customers (including restaurants and
• Simple carbohydrate wastes include supermarkets), preprocesses the waste and then delivers it
bakery waste, brewery waste, and to CSMA.
sugar-based solutions such as those
Both Recology and MSS work closely with local
from confectionaries and soda pop
governments to attain aggressive zero waste goals: San
producers; more complex
Francisco aims to reach zero waste by 2020; Marin
carbohydrate wastes include fruits and
County by 2025.
vegetables as well as mixed
organics—including the organic Because food waste comprises such a large percentage of
fraction of municipal solid waste the MSW stream, both communities have heavily
stream. invested in residential and commercial organic collection
• Protein wastes include meat, poultry, programs (San Francisco Department of the Environment
and dairy waste products such as 2014, Zero Waste Marin 2014).
cheese whey.
• Other waste organic feedstocks
include glycerin from biodiesel fuel production.
For more information, WERF (2014) provides an extensive literature review summarizing the
performance of these various materials.
The interviewed facilities co-digested with various types of carbohydrate, protein, and lipid wastes. The
wastes were selected for a number of different reasons, including proximity, availability, dependability,
associated tipping fees, and biogas yield. Some food waste materials (e.g. sugary wastes) appear to
produce biogas with a relatively low percentage of methane while other food waste materials (e.g.
glycerin) produce biogas with a relatively high percentage of methane. Some food waste materials came
from relatively far sources. For example, EBMUD receives chicken blood from as far away as
California’s Central Valley. Others only accepted food waste from nearby sources. West Lafayette, for
example, receives cafeteria waste from Purdue University, which is located across the street from the
facility.
Some facilities accept a variety of wastes. The Hill Canyon operator explained that, as food waste sources
can be intermittent and inconsistent, co-digestion has required some experimentation. Other facilities co-
digest with one material. Janesville, for example, only co-digests with chocolate waste. In the past,
Janesville accepted soft drink and whey wastes, but stopped because the soft drink waste was often
contaminated with plastics, and the whey waste too high in chlorides, which can be corrosive. Other
facilities—notably EBMUD and CMSA— have forged partnerships with municipal waste haulers,
helping nearby communities to reach waste diversion goals.
8Food Waste to Energy
Almost all of the interviewed WRRFs co-digest with FOG. Most of the facilities obtain FOG from local
restaurants, groceries, and bakeries. West Lafayette also receives FOG directly from residents. Table 2
summarizes what food waste materials the facilities co-digest.
CMSA EBMUD Hill Sheboygan West Janesville
Canyon Lafayette
FOG FOG FOG FOG FOG Chocolate
waste
Post-consumer Winery waste Industrial, Industrial Purdue cafeteria
commercial including including: food scraps
Industrial liquids from fruit dairy, soda
and solids juice, frappe, processing, Agricultural
beer, and and off-spec waste from
Animal cheese beverage Purdue’s Ag.
processing & producers. Research
rendering Ethanol program
Restaurant production
Post-consumer waste: Spoiled produce
commercial Biodiesel including thin donations
waste, e.g. stillage and
Post-consumer glycerin corn syrup
residential (pilot)
Table 2 Types of co-digested food waste
9Food Waste to Energy
3 How much is co-digested, and when? How is it delivered?
The six interviewed facilities accept varying
amounts of food waste throughout the year. For EBMUD permits haulers to deliver food waste,
West Lafayette, its deliveries are seasonal. The and is permitted to accept it. To receive, process
WRRF receives an annual average of 370 gallons and co-digest solid and liquid food waste in
of food from Purdue University’s cafeteria, but California, a WRRF may hold two permits from
that material is only delivered while school is in two state agencies: A National Pollution
session. Janesville accepts 350,000 gallons of Discharge Elimination System (NPDES) permit
waste per year (i.e. 958 GPD), but greater volumes from the State Water Resources Control Board
of chocolate waste are delivered during holidays (SWRCB), and a solid waste permit from the
(Christmas, Valentine’s Day, etc.). CMSA started California Department of Resources and
co-digesting in February 2014, and the facility is Recycling (CalRecycle).
currently receiving about 10,000 gallons of FOG CalRecycle has issued EBMUD and CMSA
per day and four tons (i.e. 1,100 gallons) of food “Enforcement Agency Notifications” (EAs), the
waste per day. As more commercial customers least burdensome of the permitting tiers
(an anticipated 200) participate in MSS’s organics (CalRecycle 2014). EBMUD’s EA classifies their
collection program, CMSA may receive as much receipt of solid food waste as a “biosolids
as 20 tons per day. composting” activity and limits their intake to
EBMUD accepts food waste seven days a week, 250 tons per day (CalRecycle 2009); CMSA’s EA
365 days a year. EBMUD has daily received 20-40 classifies their receipt of solid food waste as
tons of post-consumer food waste from San “solid waste disposal” activity and limits their
Francisco’s waste hauler, Recology. Each day, intake to 15 tons per day (County of Marin
EBMUD additionally receives 100 truckloads Environmental Health Services 2012).
containing liquid- and solid wastes from 20-30 Both CMSA and EBMUD NPDES permits
industrial food processors. While EBMUD would additionally address the management of “food
not disclose the exact volume of co-digested food processing waste” (SWRCB 2012) and “food
waste, the interviewed representative did industry waste” (SWRCB 2010), respectively.
acknowledge that the facility brings in a volume of The NPDES permits do not limit the volume of
food waste equal to less than 1% of their average food waste the facilities can receive.
flow (i.e. 0.6 MGD). Because so much waste
arrives from so many different sources, EBMUD
carefully monitors deliveries.
The EBMUD Materials Management program facilitates the addition of outside liquid and solids wastes,
providing customer service to the waste generators and haulers, and ensuring that the added material is
safe (EBMUD 2012a). In order to deliver outside waste, the waste must be permitted. In addition to a
permit, EBMUD also requires the customer be insured, that appropriate analytical data and “material
safety data sheets” be provided, and that a “material acceptance agreement” is signed. Once the waste
material is reviewed and approved, deliveries to EBMUD occur as they do at the other interviewed
facilities. Haulers approach the facility and are recognized either by a guard at a guard station or through
a mechanized identification system. The haulers enter the facility and deliver the waste to the designated
area. Table 3 shows the volumes of waste accepted throughout the year and summarizes how the facilities
manage deliveries.
10Food Waste to Energy
Table 3 Food waste (FW): Volume and delivery process
CMSA EBMUD Hill Canyon Sheboygan West Janesville
Lafayette
Average FOG FW FOG FW FOG FW FOG FW FOG FW FW
Quantity 10,000 1,100 25,000 500 60,000 142 1 857
Processed
(GPD)
Delivery Monitored Monitored Monitored Permitted Monitored Monitored
entrance to entrance discharge haulers enter a and limited delivery
receiving monitored delivery and
facility Hauler Random entrance when discharge
must show sampling to open
Hauler must ID badge, ensure safety
fill out form permit, and of co- After hours,
and show tanker digested permitted
permit decal material haulers enter
number the facility via
Radio
Frequency
Identification
(RFID)
*exact sums not provided
11Food Waste to Energy
4 How much is stored? What processing is required?
Generally, the interviewed facilities add FOG and food waste into the digesters as soon as possible.
Janesville, for example, pumps half of their weekly load (i.e. ~3,000 gallons of chocolate waste) into the
digesters the day they receive it, and the rest the next day. Janesville does this because their holding tanks
do not mix the waste. As the material will settle over time, Janesville must feed the chocolate into the
digesters before it becomes too difficult to pump. Most of the interviewed facilities, however, possess the
capacity to store waste over longer periods, if needed. Table 4 summarizes the food waste storage
capacity of each facility
While FOG does not require much processing, other types of food waste do. As with wastewater entering
the headworks, the facilities remove large pieces of debris with bar screens. Food waste is then chopped
and ground before entering the digesters. Some facilities (e.g. Thousand Oaks) chop and grind food waste
on-site. EBMUD and CMSA chop and grind food waste that has also been chopped and ground
elsewhere. After receiving preprocessed source-separated commercial food waste, EBMUD further
processes the material, using a rock trap/grinder to remove larger debris and then a paddle finisher to
remove grit and fibrous material (Figure 5).
Figure 5: EBMUD process schematic
12Food Waste to Energy
CMSA follows a similar protocol to EBMUD: the MSS hauls food waste collected from commercial
customers to its transfer station, where the contaminants are manually removed and the food waste is
chopped into 1-inch solids. Then the MSS hauls the waste to CMSA (Figure 6).
Figure 6: Marin Sanitation Service process schematic
At CMSA, the food waste, at approximately 25% solids, is combined with FOG in a large, underground
storage tank. The FOG/food waste slurry is further diluted with treated effluent, and then further
processed with, as with EBMUD, a rock trap/grinder followed by a drum screen paddle finisher. The
resultant 10% solids slurry is then pumped into the digester (Figure 7).
Figure 7: Central Marin Sanitation Agency process schematic
The food waste that the West Lafayette WRRF receives from the Purdue University cafeteria is
preprocessed on campus. The University had originally purchased equipment to collect, macerate, and
transport cafeteria food waste so that it could be composted (Kennedy/Jenks Consultants). However, the
composting program never materialized. When the West Lafayette operator read about the failed compost
program in the local paper, he called the University and asked to tour the cafeteria’s new system. He
observed “baby food for the digesters” and promptly offered to take the University’s waste. The images
below show the techniques used to preprocess Purdue’s cafeteria food waste.
13Food Waste to Energy
Figure 8: West Lafayette’s partnership with Purdue University
Food waste is scraped from Water conveys food waste to an A classifier deposits ground
plates at the kitchen cafeteria. industrial grinder. food waste into a toter.
During the school year, Purdue delivers 15- At the West Lafayette WRRF, an operator stands by as
20 toters to the WRRF each day. the cart tipper empties a toter into the hopper.
To accommodate the food waste from the cafeteria, the West Lafayette WRRF constructed a receiving
station: a platform with a cart tipper that empties the University’s toters into a hopper. From the hopper,
the food waste passes through a grinder and then into repurposed wet and dry wells (now one big tank
with 16,000 gallons of storage capacity). FOG passes through a “heavy object trap” before entering the
repurposed wet and dry wells. The food waste/FOG slurry is mixed with warm sludge before being
14Food Waste to Energy
pumped to the digester. Many of the facilities mix the slurry with warm sludge to decrease viscosity. The
facilities feed the slurry into the digesters at different rates, and different solids concentrations. Table 4
summarizes the processing techniques of each of the facilities.
Table 4 Food waste storage and processing
CMSA EBMUD Hill Sheboygan West Janesville
Canyon Lafayette
Digester Mesophilic Thermophilic Mesophilic Mesophilic Mesophilic Mesophilic
conditions
Storage 20,000 40,000 for 20,000 500,000 16,000 7,000
(gallons) solid wastes; (expanding
81,000 for to 50,000)
liquid wastes
Pre- Hauler Haulers On-site On-site Campus On-site
processing Sorts & Remove large Cleaned for Screen at Food waste Mechanical
grinds into objects & contaminants unloading Separated bar screen
1-inch metals then chopped & ground
solids Grind into and mixed. Grind
~2-inch solids effluent On-site
Fed through sometimes Food waste
On-site On-site manually added to Grinder
Grinder Grinder & raked bar decrease
& Paddle screen before acidity or FOG
Paddle finisher entering chloride Heavy
finisher digester content object trap
Feed 30 550 10-20 35-55 30 25
Rate (GPM)*
% total 10% 35% 5% (FOG) 3% ~20% 4.5%
solids**
*Gallons per Minute (GPM) **Varies greatly with the material
15Food Waste to Energy
5 How much is biogas is produced? How is it used?
The interviewed facilities reported that co-digesting with food waste and FOG has greatly increased
biogas production. For at least three of the facilities, it has more than doubled biogas production. All of
the interviewed facilities would like to co-digest more. EBMUD, for example, actively seeks out new
sources of waste for their trucked waste program: a full-time business development representative
identifies and recruits potential customers.
As with the volume of food waste received (section 2), biogas production, correspondingly, varies
throughout the day and throughout the year. Table 6, row 2, shows average daily biogas production for
each of the six facilities.
Every one of the interviewed facilities uses a co-generation, or Combined Heat and Power (CHP), system
to manage their biogas. CMSA runs biogas through a 750 kW Internal Combustion Engine-generator
(ICE). Before CMSA started co-digesting, they produced enough biogas to meet 40% of the plant’s
electricity needs. If the current amounts of FOG and food waste (10,000 gallons of FOG and 1,100
gallons of food waste per day) continue to be delivered, the Agency will generate at least 60% of its
energy needs. As additional food waste is delivered, which is desired and expected, the percentage will
continue to increase. Assuming the current amounts of FOG and food waste continue to be co-digested,
CMSA expects the system will produce 3,460 MWh per year and 150,612 therms/year.
EBMUD is already energy positive. The facility currently generates about 129% of its energy needs on
on-site, using 3 ICEs—capable of producing 2 to 2.5 MW each —and a new 4.5 MW gas turbine. With a
total energy capacity of 11 MW, the ICEs and turbine can meet 100 to 200% of the facility’s demand. Of
the 52,561 MWh generated in 2013, the WRRF used 40,782 MWh. The surplus is exported and sold.
EBMUD established a Power Purchase Agreement2 (PPA) with the nearby Port of Oakland. The PPA is a
contract that guarantees EBMUD will provide the Port with a certain amount of energy at a fixed rate. If
EBMUD generates more than what the agreement stipulates and the Port declines it, that electricity can be
sold to others.
In 2013, Hill Canyon produced an average of 450,000 cubic feet of biogas per day; the biogas was
directed to two 250 kW and one 295 kW ICEs to generate 4,600 MWh of electricity and 3,000,000 therms
of heat. The electricity generated by the engines replaced what would have otherwise been drawn from
the grid. The waste heat was used to the warm the digesters and the administration building. Hill Canyon
flared about 275,000 cubic feet of biogas per day because it lacked the engine capacity to combust it.
Now, with an updated system comprised of two ICEs (the 295 kW and a new 630 kW engine), the facility
will soon meet or exceed its power needs.
At the Sheboygan WRRF, biogas is used in boilers to produce heat to warm the digesters. Biogas is also
used to power ten 30 kW microturbines and two 200 kW microturbines (Figure 9). In 2006, the facility
installed the ten 30 kW microturbines, which are capable of producing a combined 300 kW of electrical
power and recovering 10 therms of heat per hour. In 2008, the facility began co-digesting with high
strength organic wastes and biogas production jumped 150%, prompting the CHP system’s expansion. In
2010, Sheboygan installed two 200 kW microturbines. The two 200 kW microturbines are capable of
producing 400 kW of electricity and 14 therms per hour. Most of the year, the Sheboygan WRRF is
energy positive.
2
PPAs are finance contracts between the signatory (e.g. the port) and a third-party renewable energy developer (e.g. EBMUD). The third party
owns, operates, and maintains the renewable energy system. In exchange for upfront costs and maintenance, the signatory commits to buying the
energy at a predetermined rate over a predetermined time period.
16Food Waste to Energy
Figure 9: Microturbines at the Sheboygan WRRF
Source: Sheboygan Regional Wastewater Treatment Facility 2011
WRRFs can sell excess electricity to the grid. To do so, the facilities must meet interconnection
standards, which can include complex and costly technical and contractual considerations. EBMUD,
for example, spent $1.3 million to upgrade their interconnection to Pacific Gas and Electric’s (PG&E)
distribution lines. Whether a WRRF sells to a third party (e.g. EBMUD’s PPA with the Port) or to the
local electric utility, the facility must interconnect. In most states (DSIRE 2013), WRRFs can sell
electricity back to the grid by establishing a net metering agreement with their electric utility. Net
metering credits renewable energy generators that deliver to the grid. The local utility tracks each kwh
consumed and received. When a WRRF generates more electricity than it consumes, the electric utility
credits the excess delivered to the grid. These credits can, in turn, be used to offset power purchased
from the utility when the WRRF consumes more than it generates.
Different states have different interconnection and net metering policies, some more supportive than
others (Freeing the Grid 2014). In California, for example, the major electric utilities must offer net
metering to all eligible facilities (one MW or less solar, wind, fuel cell or biogas systems) until they
reach a legislated limit (DSIRE 2014). Larger capacity systems are eligible for other renewable energy
procurement programs. Systems under three MW may participate in California’s Feed-in Tariff (FIT)
program (CPUC 2014a); systems greater than three MW and less than 20 MW may participate in the
Renewable Auction Mechanism (RAM) program (CPUC 2014b). Unlike net-metering, the FIT and
RAM programs do not commit utilities to purchasing the electricity at full retail value; rather, as with
PPAs, the utilities commit to buying electricity at a predetermined rate over a predetermined time
period.
For some WRRFs, selling excess electricity back to the grid can be prohibitively burdensome — not
only because it requires familiarity with concepts heretofore peripheral to wastewater operations; but
also because interconnection costs can affect project economics. Interconnection costs can be as much
as 5-10% of the installation cost of new generation.
The West Lafayette WRRF also generates heat and electricity with microturbines and a boiler. The
facility relies on two 65 kW microturbines to produce an annual average of 679 MWh. When Purdue is in
session, the waste heat from the microturbines is used to warm the digesters; when not in session (i.e.
when the facility is not receiving cafeteria waste), biogas production drops and the digesters must also be
17Food Waste to Energy
heated with a natural-gas fired boiler. Overall, waste heat warms the digesters 90-95% of the time. The
West Lafayette CHP system meets less than 20% of the facility’s electricity needs. The facility would like
to increase biogas production, but the plant operators face two challenges: 1) the facility possesses no
biogas storage capacity (and so all excess biogas is flared) and 2) the microturbines are fully utilized
(except when school’s out). The facility is considering adding another microturbine.
The Janesville WRRF has been generating heat and power since 1985. They started with two 150 kW
ICEs, and have progressively invested in a larger, more efficient, and diverse system. Currently, biogas is
used to generate heat, power, and vehicle fuel, specifically, compressed natural gas (CNG). Using one
200 kW and four 65 kW microturbines, the facility produced 1,717 MWh in 2013, meeting 27% of its
electricity needs. Roughly 65,000 therms of waste heat were recovered from the microturbines and used
to warm the digesters. On average, Janesville produces 120,000 cubic feet per day of biogas with about
90% dedicated to the microturbines. The remaining goes to fuel (CNG) production. However, this
allocation fluctuates. As the operator explained, the relative amount of electricity and fuel produced
“…depends on demand. We adjust accordingly. During on-peak hours, we produce more electricity;
during off-peak, we produce more CNG.”
Janesville can produce as much as 275 Gallons of Gasoline Equivalent (GGE) per day of BioCNG. In
2013, the facility produced 1,982 GGE. To produce the CNG, the biogas runs through a proprietary gas
conditioning system. The CNG is stored and dispensed on-site. At the time of the interview, the CNG was
used to fuel four facility vehicles: a dual-fuel Ford F-250 truck, two dual-fuel Ford F-150 trucks, and a
dual-fuel Ford Fusion Sedan and one lawn mower, a CNG Dixie Chopper. Within the next ten years,
Janesville hopes to produce enough CNG to fuel 40 vehicles.
Table 6 summarizes how the six interviewed facilities produce, store, and use biogas.
As a producer of BioCNG, Janesville could participate in the national Renewable Fuel Standard (RFS)
program. Managed by the U.S. EPA, the RFS program mandates that 36 billion gallons of renewable fuel
be blended into the nation's transportation fuel by 2022 (U.S. EPA 2014d). The RFS obligates producers
of gasoline (including refiners, importers, and blenders) to meet the mandate, and established a trading
program to ensure compliance (U.S. EPA 2007a). The trading program allows obligated parties to comply
by producing or purchasing Renewable Identification Numbers (RINs).
A RIN is a 38-digit number generated by the production or import of one gallon of renewable fuel; it
uniquely identifies the fuel, providing, among other details, information about the fuel category (U.S.
EPA 2007b). RFS fuel categories include cellulosic biofuel, biomass based diesel, advanced biofuels, and
renewable fuel. The obligated parties must produce or purchase a specified volume of fuel in each
category. These Renewable Volume Obligations (RVOs) change each year. Table 5 shows the 2013
RVOs associated with each fuel category (U.S. EPA 2013, U.S. EPA 2014e).
Table 5 2013 Renewable Volume Obligations (U.S. EPA 2013, U.S. EPA 2014e).
Fuel category 2013 RVO Volumes 2013 RVO Percentages
(gallons) (of total U.S. fuel produced)
Cellulosic biofuels 810,185 0.0005%
Biomass based diesel 1,280,000,000 1.13%
Advanced biofuels 2,750,000,000 1.62%
Renewable fuel 16,550,000,000 9.74%
18Food Waste to Energy
WRRF biogas had been classified as an advanced biofuel, but was reclassified to be a cellulosic feedstock
in the July 2014 Pathways II Final Rule (U.S. EPA 2014f). WRRF-derived fuels and electricity used in
the transportation sector (to, for example, power an electric car) can now generate cellulosic RINs. RINs
are traded in an open marketplace, and prices are controlled by supply and demand. Cellulosic RINs may
become more valuable for two reasons: 1) They have been relatively rare, and obligated parties must meet
RVOs; and 2) Cellulosic fuels are the “one-stop-shop” of the RIN marketplace, as they can be used to
meet the RVOs of any RFS fuel category. While Janesville has not yet registered under the RFS, the
WRRF is now considering generating RINs for their BioCNG.
Table 6 Biogas production, storage, and use at interviewed facilities
Facility CMSA EBMUD Hill Sheboygan West Janesville
Canyon Lafayette
% increase 60% Over 250% 150-300% N/A** 40%
w/ co- 100%
digestion
Biogas 252,000 2,400,000 450,000 560,000 92,160 120,000
production
(cubic feet/
day,
averaged)
Biogas Use CHP CHP CHP CHP CHP CHP
ICE ICE ICE Microturbines Microturbines Microturbin
Boiler* Boiler Boiler* Boilers es CNG
Turbine
Electricity 3,460 52,000 4,600 2,300 679 1,717
(MWh/year)
Heat 150,612 2,300,000 3,000,000 84,000 Not measured >65,000
(therms/year)
Fuel N/A N/A N/A N/A N/A 1,982
(GGE/year)
Biogas Flexible Membrane Excess Minimal Excess flared Flexible
Storage membrane dome over flared storage in 1 membrane
covers 1 digester digester covers
Storage 200,000 200,000 None Negligible None 102,000
capacity
(cubic feet)
% of
electricity
demand 60% 128% 80-85% 90% 16-18% 27%
generated (soon to
on-site be 100%)
(annual
average)
* Used to heat digesters if CHP system is offline
** The facility started co-digesting as soon as the CHP system went into place. There is no baseline
which to compare it.
19Food Waste to Energy
6 How much biosolids are produced? How are they managed?
Biosolids are the nutrient-rich organic materials resulting from the treatment of domestic sewage in a
WRRF. There are several beneficial uses for biosolids, including landfill alternative daily cover (ADC),
composting, land application (to manage forests, fertilize farmland, etc.), mine reclamation, or energy
generation (e.g. gasification). Biosolids may also be incinerated, disposed of in landfills, and/or stored for
future use.
The interviewed facilities produce varying amounts of biosolids, dedicating the biosolids to a mix of uses,
depending on quality, quantity, time of year, and affecting regulations. When used for land application,
biosolids are classified as class A or class B depending on the level of treatment. Class A biosolids are
treated to inactivate pathogens and are subject to fewer regulations, while class B biosolids are treated to
remove 99 percent of pathogens and are subject to greater regulation (Water Environment Federation
2010).
In California, the land application of biosolids is heavily regulated, and, in some counties, effectively
banned. Some counties only prohibit land application at certain times of the year. CMSA, for example,
transports its class B biosolids to Sonoma County, where farmers can land apply from June to October
(the dry season); the rest of the year, CMSA sends biosolids to a landfill for use as ADC. EBMUD, on the
other hand, sends biosolids to farms for use as fertilizer and to landfills for use as ADC year-round.
In 2013, EBMUD produced 14,716 dry metric tons of class B biosolids, dedicating approximately 40% of
that to agricultural land application, 59% to use as ADC, and 1% to two stand-alone food waste digesters.
As the immediately surrounding counties have prohibited year-round application, EBMUD transported
5,942 dry metric tons of biosolids over 100-miles to Merced County, where farmers can land apply
throughout the year. By sending 8,664 dry metric tons of biosolids to local landfills for use as ADC,
EBMUD substantially reduced hauling distances and the associated costs. The two stand-alone food waste
digestion projects (Hillmar Cheese and Zero Waste) used, respectively, 100 and 10 dry metric tons of
EBMUD biosolids as a “starter,” co-digesting to develop the desired metabolic activity.
Hill Canyon is located in Ventura County, a jurisdiction which has effectively banned the land application
of biosolids. The WRRF currently sends 100% of its class B biosolids to the Toland landfill, where they
are heat dried (to meet class A standards). In the future, the landfill operators hope to sell the treated
biosolids as a soil amendment; currently, it’s used as ADC. In order to reduce the amount sent to landfills,
Hill Canyon will soon enter into “biosolids transformation” arrangement that will generate energy and
reduce hauling volumes. The facility is considering a range of technologies, including pyrolysis,
gasification, supercritical water oxidation, and hydrothermal processing.
West Lafayette land applied 348 dry metric tons of biosolids in 2013, and was able to do so year-round
because the Indiana Department of Environmental Protection permitted the land application of the
WRRF’s biosolids onto snow-covered or frozen ground. When West Lafayette cannot immediately land
apply (e.g. because farmers’ schedules unexpectedly shift), the biosolids are either stored on-site or — if
the on-site storage capacity is exceeded — sent to a regional facility, where the biosolids are stored until
they can be land applied.
Janesville land applies 100% of its class B biosolids between spring and fall (the exact timing depends on
when the growing season begins and ends). During the winter, the facility stores biosolids on-site, and
begins land applying when the growing season starts again. Similarly, Sheboygan land applies 100% of
its biosolids from April to October; as with Janesville, the WRRF stores them on-site during the winter
months.
20You can also read