Fort Peck Reservoir FISHERIES MANAGEMENT PLAN - FWP.MT.GOV - Montana FWP
←
→
Page content transcription
If your browser does not render page correctly, please read the page content below
Fort Peck Reservoir         JUNE 2012
                                             FISHERIES MANAGEMENT PLAN   MONTANA FISH, WILDLIFE & PARKS

PRODUCED BY MONTANA FISH, WILDLIFE & PARKS
1420 EAST SIXTH STREET
HELENA, MT 59620

FWP.MT.GOV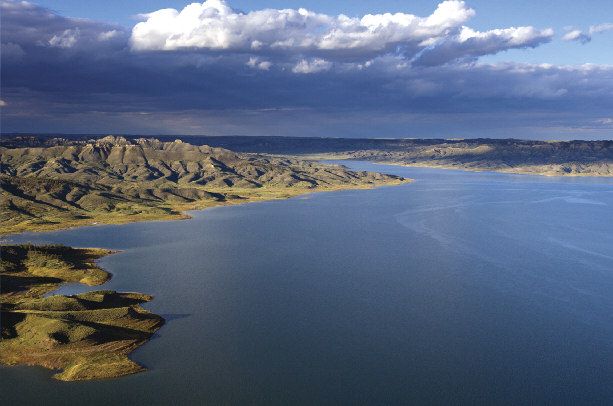
FORT PECK RESERVOIR FISHERIES
                  MANAGEMENT PLAN

                                     2012 - 2022
                            MONTANA FISH, WILDLIFE & PARKS
                                Region Six Fisheries Bureau
                                   54078 US Hwy 2 W
                                   Glasgow, MT 59230

Approved:      ____________________________________________________________________
               Joe Maurier, Director                             Date

Approved:      ____________________________________________________________________
               Bob Ream, Chairman                                Date

Prepared By:

Steve Dalbey, Fisheries Manager
R-6, Glasgow

Heath Headley, Fisheries Biologist
R-6 Glasgow

Don Skaar, Fisheries Management Section Supervisor
Helena
This page intentionally left blank
1TABLE OF CONTENTS
PAGE
I. SUMMARY OF MANAGEMENT PLAN
Brief description of the major elements of the ten-year Fisheries Management Plan ........................ 6
II. INTRODUCTION
Background into the Department's recognition of the need for Fisheries Management Plans,
importance of the Fort Peck fishery, and an overview of the planning process ............................... 11
III. PLAN ADAPTABILITY
How the Plan will guide future management of the fishery, role of citizen’s advisory group,
need for increased funding and manpower ....................................................................................... 12
IV. BACKGROUND ON FORT PECK RESERVOIR AND FISHERY
History of the reservoir and evolution of the present fishery............................................................ 12
V. MANAGEMENT AGENCIES AND AUTHORITIES
Identification of the various agencies with management authority for Fort Peck and a
description of their respective responsibilities .................................................................................. 13
VI. PUBLIC INVOLVEMENT IN THE DEVELOPMENT OF THE PLAN
Description of methods used to involve the public, identify issues, and insure the accept-
ability of the Management Plan ........................................................................................................ 15
VII. FISHERIES MANAGEMENT
Discussion of fisheries data, management options based on capabilities of the resource
matched with angler's desires, and the selected Management Plan .................................................. 16
VIII. OTHER MANAGEMENT COMPONENTS
The Department's role and relationship with agencies that have management
authority at Fort Peck ....................................................................................................................... 27
IX. APPENDICES ............................................................................................................................ 35
X. LITERATURE CITED ................................................................................................................ 59
2IX. APPENDIX PAGE
A. Meeting locations, dates, and attendance during public scoping meetings for the Fort Peck
Fisheries Management Plan .............................................................................................................. 36
B. List of introduced and native fish species found in Fort Peck Reservoir .................................... 37
C. Number of walleye eggs collected from Fort Peck Reservoir and number of fry and
fingerlings stocked in Fort Peck Reservoir from 1951-2010 ............................................................ 38
D. Maximum reservoir elevation compared to combined number of emerald, spottail,
young-of-year yellow perch, and young-of-year crappie from 1982-2010....................................... 39
E. Length structure, in terms of catch per unit effort (CPUE), of walleye collected in the standard
experimental gill net survey in Fort Peck Reservoir during, July-August, 1982-2010..................... 40
F. Mean length-at-age at time of capture (in) for walleye collected in experimental gill nets,
2006-2010, on Fort Peck Reservoir, and aged from sectioned otoliths ............................................ 41
G. Relative weights of various length categories of walleye collected in the standardized
experimental gill net series in Fort Peck Reservoir during, July-August, 1982-2010 ...................... 42
H. Summary of walleye catch and harvest rates from other water bodies ........................................ 43
I. Length structure, in terms of catch per unit effort (CPUE), of northern pike collected in the
standard experimental gill net survey in Fort Peck Reservoir during, July-August, 1984-2010 ...... 44
J. Mean CPUE of northern pike and smallmouth bass young-of-year collected in during annual
seine surveys in Fort Peck Reservoir during, July-August, 1984-2010 ............................................ 45
K. Number of northern pike fry and fingerlings stocked in Fort Peck Reservoir from 1951-2010 .. 46
L. Number of smallmouth bass fingerlings stocked in Fort Peck Reservoir from 1981-2010 ......... 47
M. Mean CPUE of smallmouth bass collected in standard experimental gill net survey in Fort
Peck Reservoir during, July-August, 1982-2010 ............................................................................. 48
N. Mean CPUE of sauger collected in standard experimental gill net survey in the upper
Missouri arm of Fort Peck Reservoir during, July-August, 1984-2010............................................ 49
O. Lake trout stocked by number and size in Fort Peck Reservoir, 1954-2004 ............................... 50
P. Chinook salmon stocked by number, size, and location in Fort Peck Reservoir, 2001-2010 ...... 51
Q. Annual comparison of female salmon spawned and eggs collected from Fort Peck Reservoir,
1994-2010 ......................................................................................................................................... 52
R. Percent frequency of occurrence for various forage items found in stomach contents of walleye,
northern pike, sauger, and smallmouth bass captured in experimental gill nets in 2010 .................. 53
3S. Change in reservoir elevation from December (high) to March (low) compared to mean
CPUE of young-of-year cisco in Fort Peck Reservoir, 1986-2010................................................... 54
T. Methods of sampling, sampling period, target species, and biological information collected
on Fort Peck Reservoir...................................................................................................................... 55
U. Responses to public comments during the open comment period (June 6th-July 31st, 2011)...... 56
4I. SUMMARY OF MANAGEMENT PLAN
FISHERIES MANAGEMENT
Management program for walleye:
1. Place the primary management emphasis on walleye. Continue ongoing large-scale hatchery
program with the goal of producing a three-year running average of 3.6 walleye per net
during late summer gillnetting series.
2. Achieve angler catch rates of 0.4 walleye per hour during periods of the summer creel. This
catch rate will likely not occur throughout the reservoir but seasonally in regions of the
reservoir. (reservoir-wide angler creel surveys will be conducted every 2-3 years depending
on funding)
3. Stock a minimum of 3.0 million fingerlings annually. Fingerling production will depend on
quality and quantity of eggs collected, egg hatching success and pond production (spring
weather conditions). If fingerling production exceeds 3 million, biological and
environmental conditions (reservoir water level, predator/prey densities, and walleye
condition factors) will be reviewed to determine if stocking more walleyes is justified.
Stocking rates may be reduced if these conditions are unfavorable to maintaining a
sustainable, high quality walleye fishery. Continue to evaluate walleye fry contribution to
the fishery and augment fingerling stocking with fry as conditions and availability allow.
4. Walleye Limits: 5 daily and 10 in possession
Management program for northern pike:
1. Monitor population relative abundance and production through annual field surveys.
Maintain a three-year running average of 2 northern pike per net in late summer gillnetting
series.
2. Rely on variable natural reproduction and survival to determine population levels. If relative
abundance falls below 2 northern pike per net for two consecutive years, evaluate stocking
northern pike.
3. Northern Pike Limits: 10 daily and in possession.
Management targets for smallmouth bass:
1. Monitor smallmouth bass during annual netting and seining surveys. Investigate survey
techniques that provide better insight of smallmouth bass population dynamics.
2. Rely on variable natural reproduction and survival to determine population levels.
3. Bass Limits: 5 daily and in possession.
5Management targets for sauger:
1. Rely on variable natural reproduction and survival of sauger to determine population levels
in Fort Peck Reservoir. Sauger populations typically increase when Missouri River flows are
average or above average and conversely, decrease during prolong periods of below average
river flows.
2. Continue to monitor sauger populations in the reservoir through annual gill netting and
seining surveys.
3. Ensure angler harvest on sauger populations is sustainable. Continue to monitor reservoir
and river populations to gain better understanding of how environmental variables in the two
habitats are related.
4. Sauger Limits: 1 daily and 2 in possession.
Management targets for lake trout:
1. Initiate standardized annual surveys (i.e., netting and/or creel surveys) to determine lake
trout abundance and population dynamics; establish a sustainable relative abundance
management target by 2013.
2. Utilize fisheries computer models to evaluate the impacts of angler exploitation on the lake
trout population.
3. Rely on variable natural reproduction and survival to determine population levels. Reservoir
management guidelines that benefit lake trout populations will be submitted annually to the
USACE.
4. In the event that lake trout relative abundance shows significant decline, supplemental
stocking will be considered. Number of lake trout stocked will be guided by historical
stocking rates, availability of spawning stock, habitat and forage availability.
5. Lake Trout Limits: 3 daily and in possession.
Management targets for chinook salmon:
1. Implement standardized annual surveys (i.e., netting and/or creel surveys) to determine
chinook salmon survival and recruitment. Although salmon catch rates vary widely from
year to year, determine stocking thresholds and strategies required to produce acceptable
angler harvest rates.
2. Collect eggs from Fort Peck Reservoir chinook salmon annually using the most efficient
methods available.
3. Stock a minimum of 200,000 fingerlings (4-5 inches) or equivalent variations during June.
Stock 50,000 advanced fingerlings (8 inches) during September-October. This stocking will
continue to be evaluated to determine survival and contribution of these late release fish to
6the fishery. This stocking strategy will be discontinued if survival estimates demonstrate
poor survival. Stocking targets will be adaptive depending on survival estimates, spawning
stock strength, habitat and forage availability.
4. Continue working with the Tri-State Salmon Group to maintain and improve the disease-free
chinook salmon populations of the Missouri River Reservoirs.
5. Chinook salmon Limits: 5 daily and 10 in possession.
Management targets for shoreline forage fish:
1. Make annual water level recommendations to the USACE; specifically, a rising pool
beginning in early April will provide the greatest benefit for shoreline spawning species.
2. Monitor littoral forage fish populations through standardized annual beach seining surveys
conducted in late summer. Shoreline forage abundance estimates will be used to guide
predator stocking rates.
3. Attempt to maintain a three-year running average of at least 100 shoreline forage fish
(combined young-of-yellow perch, young-of-year crappie, spottail shiners, and emerald
shiners) per seine haul.
Management targets for coldwater forage fish (cisco):
1. Make annual water level recommendations to the USACE; specifically, stable reservoir
elevations during December through March.
2. Monitor cisco populations through standardized vertical gill net surveys to determine year
class strength, influence of reservoir operation on spawning success and survival. Relative
abundance of cisco will be used to guide predator stocking rates.
3. Maintain a three-year running average of 20 young-of-year cisco per net in standardized late
summer vertical gillnet series.
Management program for burbot, channel catfish and paddlefish:
1. Monitor relative abundance of these native species through a variety of gear types.
2. In concert with upstream Missouri River biologist, determine need to establish annual
relative abundance trend sampling for these species.
3. Make annual reservoir operation recommendations to USACE that are suitable for
management of these species.
Management program for pallid sturgeon:
71. Make annual reservoir operation recommendations to USACE that are suitable for
management of this riverine species.
2. Determine impacts of reservoir operations on recovery of pallid sturgeon.
Management program for fishing tournaments:
1. A maximum of 16 tournaments will be permitted per calendar year.
a. No more than 12 open water and 4 ice tournament will be permitted per calendar year.
b. No more than 6 tournaments will be permitted from June 1st through July 30th.
c. No tournaments will be permitted for the weekends of Memorial Day, Father’s Day,
Fourth of July, or Labor Day.
d. Only one tournament per weekend will be permitted.
e. Established Fort Peck tournaments of 10 consecutive years or more will be given
preference.
f. Applicants will be required to list first, second and third choice tournament dates on
applications.
g. In years where more applications are received than available tournament dates will be
entered in a lottery.
h. Unsuccessful applicants will receive one bonus point. Tournament applications will
be entered into the lottery in subsequent years and bonus points will be applied (e.g. If
an applicant has accumulated one bonus point, that application will be entered into the
lottery two times).
2. Tournaments will be reviewed on an individual basis. Evaluation of proposed tournaments
will include potential biological and social impacts. Proposed tournaments will undergo a 30-
day public review and comment period.
3. All catch and release tournaments with weigh-in type format will be limited to cool weather
periods: May-June 15th, or after September 15th.
4. Tournament boundaries must be clearly defined in the application. Proposed boundary size
should be minimized in an effort to reduce tournament related fish mortality caused by fish
being held in live-wells for extended periods of time and/or traveling long distances.
5. Tournament directors will be required to report post-tournament catch rate information in a
standardized format.
Management actions for water quality and zooplankton monitoring programs:
1. Pursue USACE funding to investigate impacts associated with water level management on
water quality and zooplankton communities of Fort Peck Reservoir.
2. Implement seasonal limnological monitoring program to determine seasonal and annual
reservoir productivity trends.
3. Utilize seasonal zooplankton data to guide fish stocking schedules.
Aquatic Invasive Species
81. Reduce the risk of spreading Aquatic Invasive Species (AIS) by coordinating with FWP’s
Fish Health staff to conduct disease testing during any egg take operations.
2. Clean, inspect and dry sampling gear to reduce the spread of AIS during FWP sampling.
3. Assist with education efforts to reduce the spread of AIS by participating in the Eurasian
Water Milfoil taskforce (USACE, Department of Agriculture, USFWS, local county weed
districts, etc.)
4. Work with FWP Aquatic Nuisance Species Coordinator to coordinate annual water testing in
Fort Peck Reservoir and boat-check and boat washing stations during periods of high angler
use.
9II. INTRODUCTION
Montana Fish, Wildlife & Parks (FWP) understands the public is highly invested in natural resource
management issues and has a strong desire to be involved in decision making processes that relate to
Montana’s fish and wildlife resources. Throughout the development of this plan, the Department made
extensive effort to facilitate public involvement and collect as much input as possible. The Department,
through numerous press releases, web-based notices, radio and television announcements alerted the
public to a host of opportunities that provided easy access to the plan and comment options.
The previous management plan guided fisheries management activities on Fort Peck Reservoir over a
ten-year period (2001-2011). During this time fish communities in Fort Peck Reservoir fluctuated in
response to variable reservoir elevations. Drought conditions, which began in the late 1990’s and
persisted through 2007, adversely affected the reservoir biota. Conversely, reservoir elevations
increased beginning in 2008 continuing through 2011. These increases in reservoir elevation combined
with strategic stocking of sport fish have led to improvements in the fishery.
The Department recognizes the importance of the Fort Peck Reservoir fishery to the local and regional
economies. Angler use and the economics associated with a high quality fishery are directly correlated
with reservoir water level management. For example, following several years of increasing reservoir
water levels angler use peaked in 2001 at 109,564 angler days resulting in a total angling-related
revenue of approximately $15,606,296. Conversely when reservoir elevations declined to the record
lows in 2007 angling pressure declined by more than 50% to 44,946 days. The resultant economic
impact of reduced reservoir levels was significant, declining to an estimated $7,500,000. Angler use
has nearly doubled since 2007 with 2009 levels of use increasing to 81,036 angler days (Montana Fish,
Wildlife & Parks 2009).
This plan modifies components of the previous management plan that were identified as in need of
change during initial scoping while retaining aspects of the previous plan where there was general
satisfaction. Additionally, this plan reflects and incorporates biological data that has been collected
during the previous 10-year period. Changes made to the previous plan were highlighted throughout
the draft process to direct the reader to areas where public comment and/or technical information was
incorporated.
The planning process used to develop this document involved multiple stages. An on-line scoping
survey was used as an initial barometer to gauge the level of satisfaction with the previous plan and
determine the number and magnitude of issues. In addition, 1,500 survey cards were sent out to
randomly selected Warm Water stamp holders. Survey results were used to identify specific areas of
the plan where the public wanted to see a change in the management direction on Fort Peck Reservoir.
The Department drafted a plan which was vetted internally as well as with agency cooperators. The
draft plan was then released electronically on the Department website and presented at eight public
scoping meetings throughout central and eastern Montana. This formal comment period was open
from June 6, 2011 through July 31, 2011. Written and oral comments received during this period were
evaluated and incorporated into the plan or addressed based on biological or social merit. Management
plan targets were developed using public comment in tandem with the Department's technical expertise
of the limiting factors of the fishery. The tentative plan was approved by the FWP Commission on
October 13, 2011 which was followed by a 30-day comment period (October 17-November 17, 2011).
The plan was presented to the FWP Commission at critical junctures of development. Initially, the
plan was presented to inform the Commission of the proposed planning process and timeline to
10completion. In addition the Commission was alert to components of the plan that were deemed to be
potentially contentious. The draft plan was presented to the Commission three times during
development; June 9, October 13 and December 8, 2011. The goal of the planning schedule is to
complete and published the revised plan by January 1, 2012.
III. PLAN ADAPTABILITY
This plan will guide fisheries management on Fort Peck Reservoir for a ten-year period (2012-2022).
Throughout the life of this plan FWP will host annual Fort Peck Reservoir fisheries status update
meetings in late winter/early spring. The goal of these meetings is to provide an opportunity for
interested parties to be involved in the management of the fishery though information sharing. In the
event that conditions require revisions or change to a particular component of the Plan during this
period, the document may be amended. Any significant changes will comply with MEPA requirements
for public notice, and be presented to the Region 6 Citizen Advisory Committee (CAC) and the FWP
Commission.
The CAC is comprised of interested citizens representing a variety of interests across Region 6. The
advisory group, chaired by FWP, will monitor implementation of the Fort Peck Fisheries Management
Plan. Periodic updates of the Plan will be presented to the CAC to ensure the management actions
reflect the goals and objectives presented in the Plan.
The Plan reflects the public’s desire for a high quality, cost effective, multi-species fishery in Fort Peck
Reservoir. Additionally, this plan represents the next step in the on-going evolution of fisheries
management on Fort Peck Reservoir. Of principal importance over the next 10-year period is to
efficiently develop scientifically sound sampling methods that quantify the essential metrics needed to
gain insight into the Fort Peck Reservoir fishery.
IV. BACKGROUND ON FORT PECK RESERVOIR AND FISHERY
Fort Peck Reservoir is formed by a large earth-filled dam located on the Missouri River in the
northeastern part of Montana. Completed in 1937, it is the largest body of water in the state, with
240,000 surface acres and 1,500 miles of shoreline at full pool. The reservoir is 130 miles in length
and has a maximum depth of 220 feet when full. Administration of all land and water within the
executive boundary of the Charles M. Russell National Wildlife Refuge is shared by the U.S. Fish &
Wildlife Service and the U.S. Army Corps of Engineers (USACE) in accordance with Memorandum
of Agreement No. DACW 45-9-97-6039. The reservoir is operated by the Corp of Engineers to provide
water for power, flood control, irrigation, navigation and recreation.
In the reservoir's early years, little was recorded regarding the quality of its fishery. Scattered reports
indicate sauger, yellow perch, crappie, freshwater drum, catfish and goldeye comprised the bulk of the
fishery. Sixteen species, mostly game fish, have been introduced to develop sport-fishing opportunities.
Walleyes and northern pike were both introduced in 1951 followed by lake trout in the mid 1950’s.
Smallmouth bass were introduced in 1981 and chinook salmon in 1983. During the 1980's spottail
shiners and cisco were also introduced to supplement the existing forage base.
During the late l950's and early 1960's rising water levels inundated vegetation and produced an
outstanding fishery for northern pike, crappie, and yellow perch. Management efforts to maintain this
11high quality fishery were continued with additional stocking. Efforts to direct the ACOE to provide
suitable water level management were not successful. Current reservoir operations are defined by
significant interannual water level variability which has been shown to have deleterious effects on the
Fort Peck Reservoir fish community.
Attempts to improve habitat to enhance the fishery have been undertaken by local sportsman's groups
over the years, in the form of spawning fences and Christmas tree reefs. However, due to the vastness
of the reservoir, no measurable benefits to the fishery have been realized. Cobble or rock spawning
reefs have been considered to aid natural reproduction of walleye, but cost is prohibitive. Even if
walleye spawning reefs could be constructed, long-term effectiveness is uncertain, due to significant
siltation in some areas and water level fluctuations. A prime example is the rock breakwater at the Fort
Peck Marina. It was initially constructed in 1996 when reservoir elevations were at an all time high.
However, drought conditions and declining reservoir elevations beginning in the early 2000’s persisted
for several years leaving this cobble structure severely dewatered.
The quality multi-species fishery found in the reservoir today is the result of the ongoing management
efforts by the Department. Key to this effort has been an understanding by the Department of the
variable nature of fish populations. Specifically, natural reproduction is largely influenced by
reservoir water levels and environmental conditions at time of spawn. As a result, extensive stocking
programs for walleye and chinook salmon are in place to reduce population variability. The
management history of Fort Peck Reservoir includes two forage fish introductions. These
introductions were carefully analyzed to determine the long-term benefits to the fishery. Additionally,
potential negative food-web interactions are reviewed prior to introduction. Final evaluation of
management success is done through the standardized monitoring combined with angler surveys. This
basic monitoring program allows estimates of catch rates, average size of the fish, and overall angler
satisfaction with the fishery.
V. MANAGEMENT AGENCIES AND AUTHORITIES
The following agencies are involved in the management of the Fort Peck Dam and Reservoir. A brief
description of their management authorities and activities is provided.
Corps of Engineers
The United States Army Corps of Engineers (USACE) was responsible for the original construction of
Fort Peck Dam and Reservoir and continues to operate the facility under authority of the Flood Control
Act of 1944. Fort Peck is one of six main stem dams on the Missouri River operated by the USACE in
accordance with guidelines contained in the Missouri River Master Water Control Manual. Drought
conditions within the upper basin during the late 1980's/early 1990's and again during the period of
2002 though 2008 resulted in substantial drawdown of Fort Peck Reservoir and other upper reservoirs
in order to meet navigational and other authorized purposes. This affected the fishery and recreational
uses of Fort Peck. In response to the drawdown, the USACE extended boat ramps at Fort Peck to
maintain recreational use.
In August 2008, the USACE completed the update of Fort Peck Lake Master Plan, Design
Memorandum MFP-105D, for Fort Peck Dam and Reservoir. This Plan represents overall policy and
management concepts applicable to Fort Peck. The broad intent of the Plan is to document policies
which do the following:
121) Determine appropriate uses and levels of recreation development of Fort Peck's resources;
2) Provide a framework within which the Operational Management Plan and Annual Management
Plan can be developed and implemented;
3) Establish a basis on which outgrants and recreational development proposals can be evaluated.
Fish and Wildlife Service
The U. S. Fish and Wildlife Service (FWS) manage the 1.1 million acre Charles M. Russell National
Wildlife Refuge which encompasses the entire Fort Peck project area. Refuge specific goals and
objectives outline habitat and population levels for a variety of species. Upland and shoreline
vegetation is managed through the administration of livestock grazing and prescribed fire program. To
the extent possible, the refuge will manage riparian and shoreline vegetation to benefit fish habitat that
develops as the result of fluctuating reservoir levels. The Fish and Wildlife Service refuge management
plan is set forth in a Final Environmental Impact Statement, which was finalized 1985. This plan is
currently being rewritten and, when published (target year of 2012), will be known as the Charles M.
Russell NWR Comprehensive Conservation Plan. The FWS and the Corps of Engineers cooperatively
developed the Fort Peck Lake Master Plan (Design Memorandum MFP-105D), which specifically
identifies recreation facilities and development on the lake.
Local Agencies
The Corps of Engineers occasionally issues permits to other agencies and private individuals to manage
recreation sites on the lake. Recreation facilities such as camping areas, marina and boat docks are
operated by a concessionaire. Leases are issued for up to twenty years and can be revoked at any time
by the Secretary of the Army.
Montana Fish, Wildlife & Parks
The Fort Peck Reservoir fishery is managed by the Montana Department of Fish, Wildlife & Parks
(FWP) through the Region Six Fisheries Division. The Department also manages State Parks and State
Recreation Areas located on lands leased from the Federal Government. Specific recreation sites
managed by the department include Duck Creek Fishing Access Site, Rock Creek Fishing Access Site
on the Big Dry Arm of the reservoir, and Hell Creek Recreation Area north of Jordan which is managed
out of FWP Miles City Parks division (Region 7).
Joint Agency Efforts
Various projects have been implemented over the years to improve access to Fort Peck Reservoir
through the joint efforts of five counties, federal agencies, and the Department. Various local, state and
federal funds were used to accomplish this work. The projects included work on access roads and boat
ramp facilities at the Duck Creek FAS, Pines recreation area, Hell Creek, Crooked Creek, Flat
Lake/Spillway, and Nelson Creek Recreation areas. Efforts by six surrounding counties, Fish and
Wildlife Service, USACE, BLM, and FWP resulted in additional improvements on access routes to
Hell Creek, Crooked Creek, McGuire Creek, the Pines, Fourchette Bay, Slippery Ann, and Rock Creek
(west end).
VI. PUBLIC INVOLVEMENT IN THE DEVELOPMENT OF THE PLAN
13Public involvement components are detailed below in chronological order.
Fort Peck Management Plan on-line survey
An on-line scoping survey was conducted from November 2010 to January 2011to gain public input
about the existing Fort Peck Reservoir management plan. Two press releases were issued to ensure
recreational users were aware of the on-line survey. The survey was followed by 1,500 postcards that
were mailed to a random sample of warm water stamp holders to encourage response to the on-line
survey. A total of 88 respondents submitted comments to the survey. Respondents were asked what
they liked, disliked, and what changes (if any) they would recommend to the existing Fort Peck
Reservoir Management plan.
According to the survey, most respondents (39%) liked the current management plan and that the
primary emphasis was placed on walleye. Respondents also liked the stocking program for walleye
but also liked the stocking of other fish species (i.e., chinook salmon) and the opportunity to fish for
them.
A majority of the respondents (17%) disliked there were not enough walleye fingerlings being stocked.
Some respondents also disliked the current number of tournaments allowed on Fort Peck.
When survey participants were asked what changes they would recommend to the current plan, a
majority of the respondents suggested increased stocking rates of larger walleye (fingerlings) and
limiting the number of tournaments. Respondents stated they wanted FWP to have a larger role in
water level management on Fort Peck Reservoir.
Scoping Meetings
Eight public scoping meetings were hosted during the initial public comment period. Meetings were
held in the evening in the following communities: Great Falls (6/29), Havre (6/22), Glasgow (6/21),
Wolf Point (6/20), Glendive (6/7), Miles City (6/6), Billings (6/28), and Lewistown(6/27) (Appendix
A). The draft plan was presented at these meetings and all changes made from the previous
management plan were highlighted.
Public Review of Draft Plans
Public comments on the draft Fort Peck Reservoir Fisheries Management Plan were accepted during
the open comment period from June 6 to July 31, 2011. During this time, the public had a variety of
comment opportunities including email, written (prepared comment cards or general letter format) and
oral. Those comments are addressed in Appendix U. The public was made aware of these through
numerous press releases, radio and television announcements. Links were also provided on FWP’s
website to the draft Management Plan, a Summary of Changes that were made to the previous
Management Plan, and meeting dates and locations of public scoping meetings.
Additional opportunity for public comment was through an on-line survey which was posted on FWP’s
website. These comments were in response to proposed changes to the previous management plan that
were highlighted in the draft plan. The on-line survey was scheduled to run from June 22 to July 22,
2011 (30-day public comment period) but was extended twice (July 25 and July 31) due to glitches
with Survey Monkey software. The survey officially ended July 31, 2011.
14Final Plan
The tentative plan was presented and approved by the FWP Commission on October 13, 2011. A final
round of public comment ran from October 17 through November 18, 2011. No comments were
received during this period. The final Plan will be presented for approval to the FWP Commission at
the December, 2011 meeting.
VII. FISHERIES MANAGEMENT
The fishery in Fort Peck is diverse with 47 different fish species, most of which are native to the
Missouri River (Appendix B). Sixteen species, mostly game fish, have been introduced to develop
sport-fishing opportunities. Methods for sampling, sampling periods and measures of sampling for
these species are outlined in Appendix T. Fish populations and management efforts cannot be expanded
indefinitely, both are finite resources. Increasing effort and funding for one species often results in
reduced effort and funds directed for another. The Department will strive to maintain the unique
diversity of the Fort Peck fishery. Management of game fish species will be prioritized on angler
preference. In turn, the Department will allocate resources proportionally.
The Fort Peck fishery is a complex and dynamic biological ecosystem that is defined by population
fluctuations, where changing environmental conditions may favor a species or group of species over
other species. As an example, attempting to maximize abundance of one predator by stocking without
consideration of other game species and/or forage fish populations could result in severe declines in
abundance of these species. This approach could lead to unintended decreases in growth and survival
of several sport or forage species from which recovery can be slow. To date the Fort Peck Reservoir
fishery has not experienced a forage base collapse, but biologists remain aware of this possibility.
Throughout this plan fisheries information is analyzed and presented on a species by species basis.
Each section will first address: 1) fisheries data and the resource capability, 2) angler's desires, 3)
management options, and 4) recommended management actions.
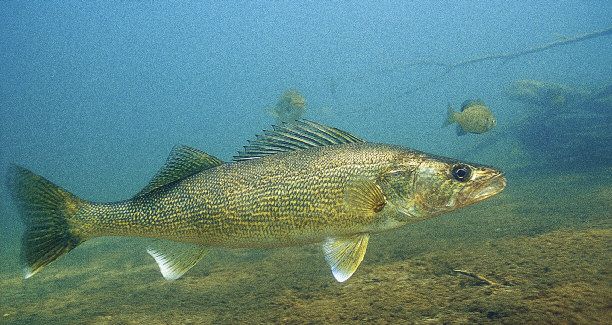
Walleye
Walleye were first introduced into Fort Peck Reservoir in 1951 by FWP. During the late 1960's and
early 1970's, a walleye fishery developed in the Big Dry Arm of the reservoir which was attributed to
favorable spawning conditions in the Big Dry Creek. Unfortunately, these conditions occur
infrequently when flows are sufficient and reservoir elevations allow spawning fish access to gravel in
the creek (Liebelt 1979). The reservoir has very little suitable walleye spawning habitat, which consists
of gravel and cobble substrate, along its shoreline (Benson 1980). Annual shoreline seining in the upper
reservoir indicates that natural reproduction also occurs on a limited basis in the Missouri River above
Fort Peck.
The walleye fishery fared poorly in the late 1970's and early 1980's due to lack of natural reproduction
and a decline in forage fish abundance. Stocking was resumed in 1977 to address the declining walleye
population (Wiedenheft 1983). Since 1977, fry and fingerling plants have totaled more than 659 million
and 42.1 million, respectively by 2010 (Appendix C). Spottail shiners and cisco were introduced during
the 1980’s to augment the existing forage base and improve the growth and condition of walleye. Both
15species reproduced well and expanded their populations throughout the reservoir. As a result, average
weight, and condition factors of walleye have improved (Wiedenheft 1989).
Drought conditions began in the late 1990’s and continued through 2007. In 2007, Fort Peck Reservoir
reached a record low elevation of 2196.23 feet resulting in loss of over 50 feet of reservoir elevation
and nearly a 100,000 surface acres. The impacts of this drawdown were severe as shoreline and
submerged vegetation were greatly reduced for both shoreline forage and game fish species. This
coincided with a 57% decrease in relative abundance of walleyes caught during annual gill netting
surveys (Appendix E). During this time, walleye growth and relative weights for most length groups
decreased indicating forage limitations (Appendix F and G). Conversely, when reservoir elevations
began to increase in 2008, walleye relative weights and growth improved.
Fisheries efforts have been devoted primarily to walleye management based on angler preference and
biological capabilities of the reservoir. Public scoping comments and creel surveys have indicated that
the majority of anglers want the Department to continue management efforts on walleye. Walleye were
ranked first in preference in both the 1990 and 1997 creel surveys. Similarly, walleye were the primary
species fished for during the 2004 and 2008 creel survey at 71% and 79%, respectively.
Angler catch rates for walleyes were a major component of the 2001 plan. Anglers requested that
Department achieve a walleye catch rate of 0.5 fish per hour. Since the previous plan, two reservoir-
wide creel surveys have been implemented. Both of these creel surveys take into account walleye
catch rates of all anglers ranging from novice to expert. The highest documented angler catch rate for
walleye on the reservoir occurred in 2008, with 0.28 fish per hour, which was slightly higher than 1997
catch rate of 0.27 fish per hour. Angler catch rate during the 2004 creel survey was 0.16 walleye per
hour. Walleye fisheries in surrounding states and provinces and throughout the Midwest, which have
limited natural reproduction, like Fort Peck, consistently have lower catch rates. Furthermore, a survey
of over 1,000 walleye waters revealed that only 13.7% of walleye fisheries reported a catch rate of 0.4
walleye per hour or greater (Appendix H). Walleye catch rates exceeding 0.3 fish per hour are
generally considered excellent (Colby et al. 1979). It should be noted that walleye catch rates of 0.4
fish per hour were met and exceeded in the month July during the 2008 Fort Peck creel survey (Brooks
and Headley 2009). This is due to water temperatures increasing during the summer month which
increases the metabolic activity of predatory fish and limited numbers of small forage items during this
time.
Fisheries investigations have consistently documented that angler catch rates of walleyes are not
related to abundance but rather most closely tied to growth rates and food availability. On Oneida
Lake, New York over several decades of study it was determined that during years when walleyes were
most abundant, angler catch rates were the lowest. Furthermore, as walleye numbers decreased,
anglers caught more walleye masking population declines. This relationship points to food supply as
the primary factor in walleye catchability (Van DeValk et al. 2005; Kaufman et al. 2009).
Management program for walleye:
1. Place the primary management emphasis on walleye. Continue ongoing large-scale hatchery
program designed to produce a three-year running average of 3.6 walleye per net during late
summer gillnetting series.
a. Maintain a three-year running average of 3.6 walleye per net during summer
gillnetting series
16b. Maintain a proportional stock density (PSD) between 40 and 65 during summer gill
netting series. PSD is the proportion of all walleye greater than 15” divided by the
total number of walleye greater than 10”.
2. Achieve angler catch rates of 0.4 walleye per hour during periods of the summer creel. This
catch rates will likely not occur throughout the reservoir but seasonally in regions of the
reservoir. (reservoir-wide angler creel surveys will be conducted every 2-3 years depending
on funding)
3. Stock a minimum of 3.0 million fingerlings annually. Fingerling production will depend on
quality of eggs collected, egg hatching success and pond production (spring weather
conditions). If fingerling production exceeds 3 million, biological and environmental
conditions (listed below) will be reviewed to determine if stocking additional walleyes is
justified. Stocking rates may be reduced if biological and environmental conditions are
unfavorable to maintaining a high quality walleye fishery. Continue to evaluate walleye
fingerling and fry survival and recruitment. Augment fingerling stocking with fry as
conditions and availability allow.
The following criteria will be used to guide walleye stocking rates. If conditions in these
criteria are met, walleye may be stocked at rates greater than 3 million.
a. Physical Condition of Existing Walleye Population
i. Relative weights should be a minimum of 90 for walleye greater than
preferred length (>20”), and a minimum of 80 for walleye less than quality
length (and limited shoreline cover for juveniles. Over the years, fluctuating water levels have provided
intermittent northern pike spawning conditions resulting in large fluctuations in relative abundance.
In response to declining northern pike populations, stocking was increased in the early 1970's to
improve the fishery. Most stocking occurred in the lower portion of the reservoir from the spillway
area to Duck Creek. Stocking in the Big Dry Arm was eliminated when the walleye fishery developed
in this region of the reservoir. Stocking was resumed on a very limited basis in 1990-1993 due to
reduced natural reproduction. Stocking was resumed again during the most recent drought (2001-2007)
when a total of 589,172 were stocked during this seven year period (Appendix K). Despite these
limited stocking efforts, relative abundance of northern pike captured during annual gill netting and
seining surveys remained relatively constant.
Angler catch rates for northern pike increased from 0.01 per hour in 2004 to 0.03 per hour in 2008.
Angler catch rates are similar to those observed during the 1997 creel survey when catch rates were
0.04 fish per hour. This was a period of high reservoir elevations and also coincided with increasing
relative abundance. Northern pike were the fourth most sought after species during the 2004 and 2008
creel surveys behind walleye, chinook salmon, and lake trout.
Management targets for northern pike:
1. Monitor population abundance and production through annual field surveys. Maintain a
three-year running average of 2 northern pike per late summer/fall gill net.
2. Rely on variable natural reproduction and survival to determine population abundance.
3. If relative abundance falls below 2 northern pike per net for two consecutive years, evaluate
stocking northern pike.
4. Northern Pike Limits: 10 daily and in possession.
Smallmouth Bass
Smallmouth bass were first introduced into Fort Peck Reservoir in 1981 with fingerling stocking
occurring in 1982 and 1983. Stocking was resumed in 1993, and continued on an annual basis through
2001. More than 280,000 fingerlings have been planted during this period (Appendix L). Smallmouth
bass have survived well with natural reproduction increasing steadily over the years (Appendix J).
Successful natural reproduction has made smallmouth bass young-of-year the most common game fish
observed during annual seining surveys.
Interest in the smallmouth bass fishery has increased as the population has expanded and angler catch
rates have increased. Smallmouth bass tournaments are gaining in popularity with three proposed for
Fort Peck during the 2011 open water season. The catch rate in 1997 was 0.02 fish per hour, nearly
double that of the catch rate in 1991. This slight upward trend has continued into 2004 and 2008 with
a catch rate of 0.03 fish per hour and 0.04 fish per hour, respectively. In addition, lake-wide gillnetting
surveys since 1985 have indicated a gradual increase in the number of smallmouth bass captured per
net (Appendix M). The current Montana state record smallmouth bass was caught in Fort Peck
Reservoir in 2002 weighing 6.7 pounds.
18Smallmouth bass were ranked fifth in terms of species targeted by anglers during the 2004 and 2008
creel surveys. Anglers caught over 3,000 smallmouth bass during the creel in 1997, an increase of over
1,000 from the 1991 reservoir-wide creel. This trend continued into the 2004 and 2008 creel survey
when approximately 3,933 and 4,890 were caught. The current creel limit of five fish per day has been
shown to be sustainable. Fort Peck Reservoir receives low angling pressure relative reservoir size.
Management targets for smallmouth bass:
1. Monitor smallmouth bass during annual netting and seining surveys. Investigate survey
techniques that may provide better insight of smallmouth bass population dynamics.
2. Rely on variable natural reproduction and survival to determine population abundance.
3. Bass Limits: 5 daily and in possession.
Sauger
Sauger are native to Montana and are found in the mainstem Missouri and Musselshell and Marias
River drainages of the Missouri River above Fort Peck Reservoir. Populations have shown declines
following the prolonged drought of the 2000’s (McMahon and Gardner 2001). Portions of the mid-
Missouri River and areas upstream of Fort Peck Reservoir have suffered drought related population
reductions (Appendix N). Following a state-wide status review of the species, sauger were added to
Montana’s list of Species of Special Concern in 2000. Sauger are distributed throughout Fort Peck
Reservoir with a majority captured in the upper Missouri arm of Fort Peck Reservoir. Young-of-year
sauger are collected exclusively in this area during annual beach seining surveys. Undoubtedly, adult
and young sauger drift downstream from the Missouri River above the reservoir where more suitable
riverine-type habitat is available for spawning (Bellgraph et al. 2008).
Anglers are aware and concerned about declining sauger numbers in the reservoir and in the Missouri
River above Fort Peck. In general, this has led to more restrictive limits. During the previous planning
process, anglers suggested stocking sauger into Fort Peck Reservoir to augment the existing
population. If stocking sauger fingerling and fry is determined to be necessary to augment wild
populations, enhancement efforts are more likely to be sustained by populations upstream in native
habitat. Sauger prefer more turbid lakes and rivers than walleye (Carlander 1997). Waters with secchi
disc readings less than 0.9 meters are better suited for walleye and those with readings of 0.9 to 3.0
meters are better suited for sauger (Schlick 1978).
Management targets for sauger:
1. Rely on variable natural reproduction and survival of sauger to determine population
abundance in Fort Peck Reservoir. Sauger populations typically increase when Missouri
River flows are average or above average and conversely, decrease during prolong periods of
below average river flows.
2. Continue to monitor sauger populations in the reservoir through annual gill netting and
seining surveys.
193. Ensure angler harvest on sauger populations is sustainable. Continue to monitor reservoir
and river populations to gain better understanding of how environmental variables in the two
habitats are related.
4. Sauger Limits: 1 daily and 2 in possession.
Lake Trout
Lake trout were first introduced into Fort Peck Reservoir by FWP in 1953 to diversify the fishery and
utilize the cold water habitat of the reservoir. Follow-up stockings occurred in 1954, 1955, 1956, and
1957. Since this time, stocking has occurred in 1978, 1991, 1992, and 2004 with plants totaling
241,324 fingerlings (Appendix O). When reservoir levels declined during drought years, lake trout
were stocked to supplement limited natural reproduction.
According to the previous Fort Peck Reservoir Fisheries Management Plan, lake trout should be
captured and spawned when the reservoir elevation falls below 2225 msl. At this elevation, there are
approximately 51.4 acres of suitable lake trout spawning habitat along the face of the dam, which is
62% of the total spawning area when the reservoir elevation is at 2246 msl (data provided by USACE).
The face of the dam is characteristic of lake trout spawning habitat because it contains cobble and
boulder substrates that have deep interstitial spaces that lack fine sediments (Nester and Poe 1987; Dux
2005). Additional spawning areas may exist in Fort Peck Reservoir; however, this is the only known
lake trout spawning location. Therefore, decreases in reservoir elevation could pose a problem by
limiting the amount of spawning habitat and ultimately recruitment into the population. Severe
decreases in reservoir elevation could also limit the lake trout population by decreasing the amount of
suitable cold water habitat.
In an effort to better monitor the lake trout population, netting and tagging studies have been ongoing
from 2004 to 2010 during the spawning period. Netting takes place from the end of October to the
first of November when water temperatures decline from 57°F to 46°F which is within the desired
spawning range for lake trout (Gunn 1995). Only spawning adults are collected during this sampling
period. Periodic reservoir-wide creel surveys are the only other sampling effort directed at monitoring
lake trout populations. Creel surveys were conducted near the dam from 1985 to 2000 but were
discontinued due to redirection of staff to walleye and chinook salmon spawning programs.
Lake trout age and growth information collected from fall netting surveys and angler harvested fish
show numerous age classes present with some individuals up to 30 years old (Headley 2010). Annual
angler exploitation rates ranged from a low of 0.9% in 2007 to a high of 4.8% in 2008 based on tag
returns. Creel surveys conducted on Fort Peck Reservoir have shown that lake trout harvest is
relatively low with an estimated 0.05 kg/ha (Brooks and Headley 2009). Healey (1978) reported that
exploitation rates of lake trout should not exceed 0.5 kg/ha. An abundance of older fish in the
population and a low harvest rate suggest that angling exploitation is not having a significant impact
on the population in Fort Peck Reservoir. A conservative daily and possession limit of three is also in
place to reduce the potential for overharvest.
In the past, fishing activity for lake trout occurred during spring and fall in the vicinity of Fort Peck
dam. However, other fishing opportunities for lake trout are being realized by anglers during summer
as more sophisticated equipment is being utilized. Lake trout were the third most targeted fish species
during the 2004 and 2008 angler creel surveys. Lake trout catch rates were 0.17 fish per hour in 2004
and 0.11 during the 2008 lake wide summer creel surveys.
20Management targets for lake trout:
1. Initiate standardized annual surveys (i.e., netting and/or creel surveys) to determine lake trout
abundance and population dynamics; establish a sustainable relative abundance management
target by 2013.
2. Utilize fisheries computer models to evaluate the impacts of angler exploitation on the lake
trout population.
3. Rely on variable natural reproduction and survival to determine population abundance.
Reservoir management guidelines that benefit lake trout populations will be submitted
annually to the USACE.
4. In the event that lake trout relative abundance shows significant decline, supplemental
stocking will be implemented. Number of lake trout stocked will be guided by historical
stocking rates, availability of spawning stock, habitat and forage availability.
5. Lake Trout Limits: 3 daily and in possession.
Chinook Salmon
Chinook salmon were first introduced into Fort Peck Reservoir by FWP in 1983 to add diversity, utilize
the coldwater habitat of the reservoir, and provide a trophy component to the existing sport fishery.
Fort Peck Reservoir is the only chinook salmon fishery in the state of Montana. These landlocked
chinook salmon do not reproduce naturally in the reservoir because there is no suitable spawning
habitat and require annual stocking efforts to maintain the population. Initial chinook salmon
fingerlings stocked into Fort Peck were from eggs collected in Lake Michigan.
Introductory chinook salmon stocking took a conservative approach to prevent undue pressure on the
developing cisco population. Initial stocking rates averaged 15,000 fingerlings per year from 1983 to
1985. Numbers increased from 1986 to 1988 averaging 100,000 each year; however stocking numbers
were largely dependent on surplus eggs from surrounding states. Stocking efforts became variable in
the late 1980’s and 1990’s due to problems in obtaining disease-free eggs. The only source for disease-
free chinook salmon in the lower 48 states are located in the Missouri mainstem reservoirs of Oahe,
Sakakawea, and Fort Peck. From 2008 to 2010 chinook salmon stocking numbers have averaged
160,000 and sizes have increased to 30 per pound and 8 per pound for spring and fall released fish,
respectively (Appendix P).
Return of adult chinook salmon has been variable over the years. Number of adults captured and eggs
collected during the annual spawning operation increased in 2009 and 2010 (Appendix Q). The number
of female chinook salmon spawned and eggs collected in 2010 was the most since the spawning
operation was initiated in 1994. Prior to 2006, most adult salmon were collected through the use of a
portable fish ladder which was set up in the marina bay. This approach was extremely labor intensive
and numbers of returning adults were variable. Since 2007, salmon have been collected using boat
mounted electrofishing gear. Electrofishing collections have located adult salmon in several areas near
the face of the dam. This approach has proven to be more efficient and cost effective.
21Biological information has been collected from adult chinook salmon during the spawning operation
to provide more information on growth, age, and stocking-and-rearing history. Chinook salmon in Fort
Peck typically mature at age three and four with males maturing earlier than females. Age at maturity
has been shown to be influenced by growth rates and sizes at release (Lott et al.1997). Increased
growth was observed from 2008 to 2010 which is attributed to strong cisco production (Headley 2010).
Chinook salmon, like other large predator species, are utilizing cisco as their primary forage (Brunsing
1998). The average weight of age-4 female chinook collected in the fall of 2010 was 17 pounds
compared to 14 pounds in 2008. The current state record chinook salmon was caught in 1991 from
Fort Peck Reservoir weighing 31 pounds 2 ounces.
Most fishing activity for chinook salmon occurs during late summer and fall near the dam. Anglers
typically begin using downriggers in July and continue through September. A snagging season begins
October 1 and runs through November 30 which provides opportunities for shoreline anglers. Angler
catch rates have been relatively low since their introduction but it is hypothesized that poor survival
during the drought limited population size. Despite this, chinook salmon were the second most targeted
species during the 2004 and 2008 angler creel surveys. During these creel survey periods, the number
of chinook salmon caught per hour increased slightly from less than 0.01 in 2004 to 0.02 in 2008.
Management targets for chinook salmon:
1. Initiate standardized annual surveys (i.e., netting and/or creel surveys) to determine chinook
salmon survival and recruitment. Determine stocking thresholds required to produce
consistent angler harvest rates.
2. Collect eggs from Fort Peck Reservoir chinook salmon annually using the most efficient
methods available.
3. Stock a minimum of 200,000 fingerlings (4-5 inches) or equivalent variations during June.
Stock 50,000 advanced fingerlings (8 inches) during September-October. This stocking
strategy will continue to be evaluated to determine survival and contribution to the fishery.
This stocking strategy will be discontinued if survival estimates demonstrate consistently
poor survival. Stocking targets will be adaptive depending on survival estimates, spawning
stock strength, habitat and forage availability.
4. Continue working with the Tri-State Salmon Group to maintain and improve the disease-free
chinook salmon populations of the Missouri River Reservoirs.
5. Chinook Salmon Limits: 5 daily and 10 in possession.
Shoreline forage
The shoreline forage fish community consists of nearly 14 fish species that occupy the littoral areas of
Fort Peck Reservoir. Typically, the most abundant species captured during the annual seining surveys
are young-of-year yellow perch, young-of-year crappie, emerald shiners and spottail shiners. The
littoral area is comprised of the zone that extends from the shoreline to where light is insufficient for
growth of rooted aquatic vegetation. This area can be highly variable due to fluctuations in reservoir
elevations.
22You can also read