Freight Plan Draft South Island - JULY 2015 - Waka Kotahi NZ ...
←
→
Page content transcription
If your browser does not render page correctly, please read the page content below

Draft South Island
Freight Plan
             JULY 2015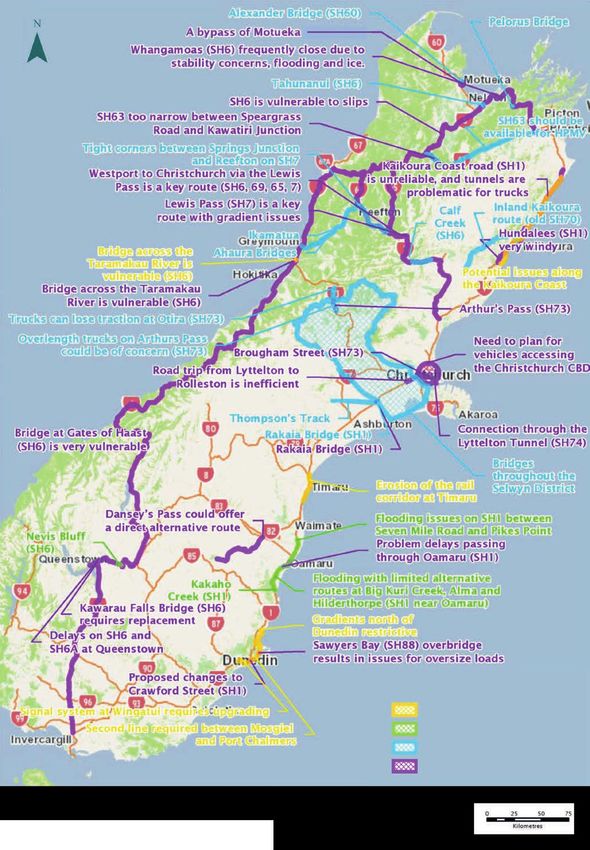
Draft South Island Freight Plan

This draft plan has been developed collaboratively and sets out a
common view of what we can do now and into the future to improve
the way freight is moved across the South Island and beyond.

It sets out the major challenges and constraints within the freight
sector and proposes actions to address them.

The draft plan is intended as a starting point for conversations about
how all those with an interest in the freight network in the South
Island can improve our competitiveness and efficiency.
JULY 2015

Contents
Foreword................................................................................................................................................................. 2

Executive summary................................................................................................................................................. 3

1. Introduction...................................................................................................................................................... 5
     1.1       Purpose.................................................................................................................................................... 6
     1.2       Approach................................................................................................................................................. 6
     1.3       Technical analysis undertaken................................................................................................................... 7
     1.4       Structure................................................................................................................................................... 7
2. The South Island freight story......................................................................................................................... 8
     2.1       The current freight task............................................................................................................................ 9
     2.2       The demand for freight in the future...................................................................................................... 10
     2.3       Key drivers of this demand..................................................................................................................... 12
     2.4       The South Island Transport Network....................................................................................................... 14
     2.5       South Island summary............................................................................................................................ 15
     2.6       Tasman/Nelson/Marlborough.................................................................................................................. 16
     2.7       West Coast............................................................................................................................................. 19
     2.8       Canterbury............................................................................................................................................. 21
     2.9       Otago..................................................................................................................................................... 24
     2.10      Southland............................................................................................................................................... 26
3. Key freight journeys....................................................................................................................................... 30
     3.1       State highway freight journeys............................................................................................................... 31
     3.2       Local road freight journeys..................................................................................................................... 33
     3.3       Imports and exports from ports.............................................................................................................. 33
4. Priority areas and outcomes.......................................................................................................................... 37
     4.1       Key outcomes......................................................................................................................................... 39
5. Action plan...................................................................................................................................................... 41

6. Next steps........................................................................................................................................................ 45

Appendix one – reference documents............................................................................................................... 46

Appendix two – group memberships................................................................................................................. 48

Appendix three – the regional freight context................................................................................................. 49
     Canterbury........................................................................................................................................................ 51
     Nelson/Tasman.................................................................................................................................................. 52
     West Coast........................................................................................................................................................ 52
     Southland.......................................................................................................................................................... 53
     Otago................................................................................................................................................................ 53
     Relevant district plan and policy reviews............................................................................................................ 54
     KiwiRail turnaround plan................................................................................................................................... 55

                                                                                                                                                                                            Page 1
Draft South Island Freight Plan

            Foreword
            One of the Government’s objectives is to lift transport sector productivity to enhance New Zealand’s economic growth. As an export nation
            relying on trade with distant markets, to do this New Zealand needs to ensure that our freight sector remains competitive and that our
            freight supply chains are efficient. Considerable investment and cooperation from a wide range of partners has already been made to
            improve the productivity of the land transport network. For example approximately 2,680km (60%) of the strategic High Productivity Motor
            Vehicle (HPMV) network has been approved for 44 to 62 tonne HPMV use. This has required considerable investment ($45million) and effort
            to strengthen bridges and structures across New Zealand. There has been uptake by the industry of HPMVs, reducing ordinary heavy vehicle
            trips and moving more freight with fewer truck trips. It is expected that the freight sector will reach a 25% uptake of HPMVs during 2015.
            The rail network also has an important role to play in supporting the freight supply chain from plant to Port. Rail plays a significant part in
            moving large volumes of export products for key commodities within the South Island.

            Freight forecasts are predicting substantial growth in the volume of freight moved by 2042. This growth will place pressure across the freight
            system as more trips are needed to move more goods. More will need to be done to meet this growth and keep lifting productivity. The
            South Island freight sector has an important role to play in this. Both the public and private sector need to make investment decisions in the
            right place and at the right time. This will require leadership, integration, working together and looking to the future.

            This draft plan has been developed collaboratively and sets out a common view of what we can do now and into the future to improve
            the way freight is moved across the South Island and beyond. It sets out the major challenges and constraints within the freight sector and
            proposes actions to address them. The draft plan is intended as a starting point for conversations about how all those with an interest in the
            freight network in the South Island can improve our competitiveness and efficiency.

            We are committed to delivering the best possible freight transport solutions for the people and businesses of the South Island. This draft plan
            sets out some actions to achieve this and we want to hear your views on these before the Plan is finalised.

            Jim Harland

            Governance Group Chair
            On behalf of the Governance Group1

             Appendix Two lists the membership of the Governance Group.
             1

Page 2
JULY 2015

Executive summary
To ensure New Zealand has a prosperous future we need to lift productivity, reduce transport costs, and increase our earnings from exports,
tourism and other industries. New Zealand relies on trade with distant markets with the cost of freight transport added to the price of our
exports and imports. To overcome our geographical disadvantage, and ensure our goods are competitive both within New Zealand and
internationally, we need more efficient freight supply chains.

Today’s freight supply chains are also changing, with private and public sector decision-makers looking for ways to better plan for the future
and address the challenges ahead. This plan has been prepared to help decision-makers improve their coordination and dialogue across the
South Island’s freight system. Better coordination will ensure we can more effectively address the challenges and opportunities facing us in
moving freight more efficiently for the benefit of South Island and all New Zealanders.

To enable the movement of freight the South Island transport network comprises of:

      A State Highway network with 4,921km of roads (making up 12% of the South Island network) and 35,456km of local roads (making
      up 88% of the South Island network).
      1,661km of rail lines, consisting of two main lines, two secondary lines and a few branch lines.
      One long distance international airport at Christchurch, two short haul international airports at Dunedin and Queenstown and eight
      domestic airports.
      Two major container ports, one at Lyttelton in Christchurch and one at Port Chalmers in Dunedin plus six regional ports (Nelson,
      Picton, Westport, Greymouth, Timaru and Bluff)
      Direct connections to the North Island via Coastal Shipping and Road/Rail Ferries
      Connections to international markets through direct vessel calls to Australia, Asia, North America and Europe.

The strategic freight network is the parts of the transport network that support the movement of high volumes and values of freight, allows
transfers to other modes and provides access to national and international markets. The strategic freight network extends over regional
boundaries, in the South Island it includes freight supply connections to both Stewart Island and the Chatham Islands and can include
infrastructure and services that are the responsibiltiy of either the public or private sectors.

In summary the freight being moved in the South Island is characterised by:
      A majority of freight (by weight) travelling within the South Island’s regions rather than across them.
      Canterbury accounting for approximately half of the total freight moved, and this will continue into the future.
      The majority of freight in the South Island being moved by road, with a small percentage moved by rail, coastal shipping or air; with
      this forecast to continue.
      Substantial projected freight growth with an extra 47.7m tonnes of freight being carried in 2042 compared with 2012. This equates
      to an additional 1.7m truck trips in 2042 compared with 2012. This means an additional 4,667 truck trips (based on 44 tonne trucks)
      per day across the network.
      Freight demand in the South Island being driven by a mix of primary sector and export growth, and population growth and change.
      The greatest growth in freight demand is forecast for between 2012 and 2027, with the rate of growth then slowing.

                      47.7                                                                             Greatest growth
                   million extra                                4,667                                    in demand
                 tonnes of freight                          Additional truck                              between
                  will be carried                            trips per day                                2012 and
                      in 2042                                                                               2027

                                                                                                                                                      Page 3
South Island Freight Plan

                  The plan has identified four priority areas to focus on, what we want to achieve (success) and what is stopping us (constraints and
                  challenges).

                   Priority area                      Future state                                   Constraints and challenges
                                                      (What success looks like)
                   Leadership and partnerships        The South Island has a strong and                     Insufficient funding
                                                      unified group representing all key freight            No industry forum to put issues forward and
                                                      stakeholders that can talk with one voice             monitor developments
                                                      about the agreed freight needs for the                Blockages in key decision making
                                                      South Island.
                   Network                            The South Island freight transport network            Resilience, including Alpine Passes
                                                      is efficient, safe, resilient, utilises the           Journey time unreliability
                                                      optimal mix of modes and supports South               Bottlenecks to/at freight hubs
                                                      Island economic productivity.
                                                                                                            Inappropriate land use adjacent to key freight
                                                                                                            hubs and corridors
                                                                                                            Risks to network availability
                                                                                                            Increasing journey times
                                                                                                            Bridge capacity
                                                                                                            Communication of network unavailability
                                                                                                            during weather and other events.
                   Infrastructure investment          Investment in the South Island freight                Increasing journey times
                                                      transport network is the right investment             Journey time unreliability
                                                      in the right place at the right time.                 HPMV improvements
                   Economic efficiency and            The South Island has efficient and                    Limited uptake of technology
                   effectiveness                      effective freight supply chains that                  Uncertain supply of skilled workforce
                                                      contribute to a thriving South Island and             Sub-optimal logistics practices
                                                      New Zealand economy.

                  To overcome these constraints and challenges and achieve success an action plan has been developed that includes South Island
                  wide actions targeted at each of the four priority areas and region specific actions. Each of the actions proposed has been assessed
                  against its ability to contribute to the outcomes necessary to achieve success in each of the priority areas. The Action Plan is included
                  in Section 5 of the document.

                  The governance group is undertaking a series of regional workshops around the South Island and inviting local government, ports and
                  operators to attend and discuss this draft plan.

                  If you cannot make it to a regional workshop please direct your comments on this draft plan by Friday 28 August to:

                  Email: southislandfreightplan@nzta.govt.nz

                  or

                  Postal Address: New Zealand Transport Agency
                  		              Attn: South Island Freight Plan
                  		              PO Box 1479
                  		Russley
                  		Christchurch 8140

                  After the regional workshops comments and feedback received will be collated, summarised and analysed. This will be used to
                  develop the final South Island Freight Plan that will be endorsed by the governance group and made publically available.

Page 4
JULY 2015

1. Introduction

To ensure New Zealand has a prosperous future we need to lift productivity, reduce transport costs,
and increase our earnings from exports, tourism and other industries. New Zealand relies on trade
with distant markets with the cost of freight transport added to the price of our exports and imports.
To overcome our geographical disadvantage, and ensure our goods are competitive both within New
Zealand and internationally, we need more efficient freight supply chains.
Today’s freight supply chains are also changing, with private and public sector decision-makers looking for ways to better plan for the future
and address the challenges ahead. In the South Island these challenges include:

      Canterbury earthquake recovery impacts and recovery
      Projected 68% increase in freight volumes by 2042
      Uncertainty concerning fuel price volatility
      Changes to international shipping movements
      Increasing consumer demand for more sustainable, low CO2 supply chains
      Quickening the uptake of new beneficial technologies (new vehicles and intelligent transport systems)
      Work force scarcity and skill shortages

To meet the challenge ahead the Government has identified improving the efficiency of freight supply chains as a priority area of work.
Key initiatives include refocusing land transport investment towards significant network improvements to lift freight efficiency, investing in
KiwiRail’s Turnaround Plan, reviewing the vehicle licensing system (including transport services licensing) and consideration of any actions
required from the Productivity Commission’s inquiry into International freight transport services. The Transport Agency has five priorities.
Priority three is “moving more freight on fewer trucks”. Moving more freight with fewer truck trips has economic, safety and environmental
benefits.

The Productivity Commission’s report noted that while New Zealand’s freight transport sector performs well, there are still efficiency
improvements that could be achieved. The Commission recommended that to better identify these opportunities there needed to be more
coordination and discussion between the public and private sectors around investing and planning for improved freight efficiency. This
includes improving communication and information sharing between public and private sector decision-makers. This improved dialogue
would allow the development of a common view on future planning and investment priorities and other opportunities to realise efficiency
improvements. The Commission recommended that this process of engagement should involve decision-makers from across the freight
system, such as freight producers, transport operators, ports and network infrastructure providers. To achieve this, the public and private
sector have come together to develop this coordinated Draft South Island Freight Plan as a basis for discussion.

                                                                                                                                                      Page 5
South Island Freight Plan

            1.1 Purpose
            The purpose of this Draft South Island Freight Plan is to develop a common view of what everyone involved in the freight sector should be
            doing now and into the future to improve the way freight is moved across the South Island and beyond. This draft plan sets out the major
            freight questions in the South Island today and proposes some actions to address them. It invites consideration of the questions raised and
            discussion of them with the key players in the freight transport sector.

            During the process to develop this draft plan, the various sector partners have borne in mind that both the public and private sectors will
            benefit from solid information and greater planning certainty, to enable better investment decisions. Through the development of a common
            view of the challenges and opportunities ahead, a South Island Freight Plan can improve the movement of freight throughout the South
            Island and potentially New Zealand as a whole.

            From the outset the objectives of this draft plan have been to:

                   Maximise the value of infrastructure investments (both public and private)
                   Better integrate freight transport and land use planning
                   Identify constraints and opportunities to improve network connections
                   Prepare for the growing freight task and future trends
                   Make better use of the existing freight network
                   Ensure freight is not overlooked in wider transport planning

            1.2 Approach
            To meet the strategic freight challenges of the future we need to plan for them. As recommended by the Productivity Commission, to
            be effective this planning needs to take into account the views and needs of the key decision-makers working across the freight system.
            This includes those that own and produce the freight, those that move, store and distribute it, and the companies, agencies and public
            organisations that provide the infrastructure it travels on.

            To address the challenge identified by the Productivity Commission, this Draft South Island Freight Plan has been developed using a
            coordinated public/private approach. The role of the Transport Agency in this process has been as a facilitator and co-ordinator. All of the
            partners involved have worked together and have a role to play in addressing the issues raised. The partners agreed to:

                   Work as a partnership
                   Take a South Island view
                   Engage with a wide range of stakeholders
                   Encourage and develop bold solutions

            From October 2012 to March 2013 the Transport Agency hosted a series of regional workshops around the South Island to provide a forum
            for stakeholders to share and discuss their concerns and ideas. As a result of these workshops the Transport Agency and the South Island
            Strategic Alliance (SISA2) agreed to convene a representative Governance Group3 to continue the development of this Draft South Island
            Freight Plan.

            2
             The SISA is a grouping of the Mayors/Chairs, supported by the CEO’s, of the combined Local Government NZ Zone 5 and 6 groups. The purpose of SISA is to provide for
            collaboration at a senior level responding to and managing a range of common and mutual interests to South Island local authority. Appendix Two lists the members of the
            SISA.

            3
             The Governance Group included the SISA, the NZ Transport Agency and representatives of freight stakeholders in the South Island. The Governance Group’s role was to
            take shared responsibility and oversee the development of this Draft South Island Freight Plan. The Governance Group was supported by a working group that advised and
            support. In turn the Governance Group provided guidance and direction to the working group and confirmed key milestones and deliverables. Appendix Two lists the
            membership of the Governance Group and the Working Group.

Page 6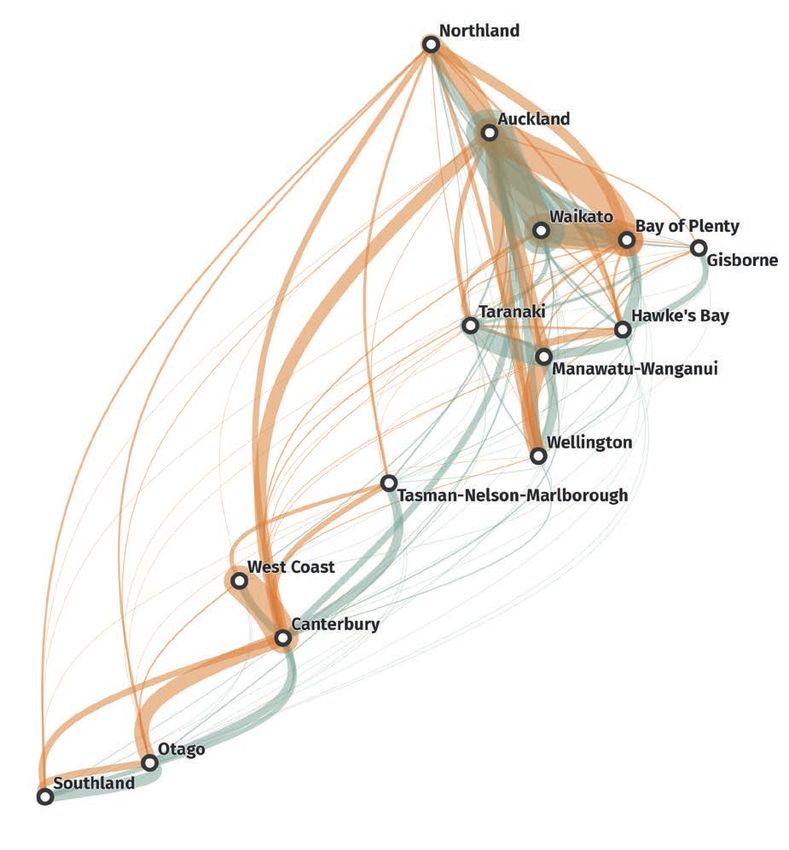
JULY 2015

1.3 Technical analysis undertaken
In preparation of this draft plan technical analysis was considered or undertaken, a complete list of which is included in Appendix One.

The Transport Agency has also been working with industry partners, local government and other stakeholders in the upper North Island to
prepare an Upper North Island Freight Story and Upper North Island Freight Accord, which focuses on reducing the freight transport costs
through an Upper North Island lens4. Additionally, the Transport Agency is working with the freight sector in the central and lower North
Island to prepare a Central New Zealand Freight Story.

This Draft South Island Freight Plan completes the picture for the whole of New Zealand. As one size does not fit all, this draft plan
represents a South Island view and has been developed by partners from across the freight sector in the South Island. It is now available for
comment and discussion to all those who have an interest in the movement of freight across and beyond the South Island.

1.4 Structure
This draft plan comprises five parts:
Part 1: Introduction

Part 2: The South Island freight story

Part 3: Key freight journeys

Part 4: Priority areas and outcomes

Part 5: Action plan

This document is a starting point for conversations by those with an interest in the freight network in the South Island. As such it does not
provide all the answers and is likely to change.

www.nzta.govt.nz/planning/process/freight-north-island.html
4

                                                                                                                                                       Page 7
South Island Freight Plan

            2. The South Island freight story

            The movement of freight plays a vital role in a modern economy. The freight task in New Zealand is
            substantial, moving the equivalent of about 50 tonnes per year for each member of the population.
            Given the size of the freight task and its importance throughout the economy especially in
            supporting the movement of exports where the costs and quality of freight transport services may be
            particularly critical, effective planning is important to ensure that the freight sector is able to deliver
            effective support of the wide range of activities in the agricultural, industrial and commercial sectors.
            This planning needs to be supported by an understanding of the sector and of the different activities
            which it encompasses.
            Source: The National Freight Demand Study, MoT, 2014.

            The South Island is critical to New Zealand’s economic success. In 2013 it accounted for nearly a quarter of New Zealand’s GDP (23.3%).
            The South Island is a large producer of bulk and containerised products that make a significant contribution to New Zealand’s economy.
            This economic activity is dominated by large volumes (and values) of dairy products, fruit and vegetables, logs, processed wood products,
            minerals, aggregates, seafood, livestock and meat, wine and general freight (including imports transported down through the North Island).
            The South Island provides goods for the North Island economy (for consumption, further processing and export). The South Island also
            contributes significantly to New Zealand’s economy through tourism, which itself is a significant generator of freight and transport demand.

            The South Island ports handle 30.2% of New Zealand’s exports traded through ports by dollar value and 12.4% of New Zealand’s imports
            traded through ports by dollar value. The freight task in the South Island is complicated due to its long thin geographic shape and low
            population densities, coupled with the largely lineal nature of the South Island’s infrastructure.

            Over the next thirty years the South Island’s freight transport demand is expected to grow by approximately 68%. The challenge for the
            sector is to identify whereabouts within the transport network this demand will most likely occur and to identify the challenges this will
            present to the network.

Page 8
JULY 2015
2.1 The current freight task
In 2012 the freight task for the South Island was 69.6m tonnes, with the majority of this moving by road and most of it travelling within
regions. Only a small percentage of South Island freight moves by rail and coastal shipping and an even smaller percentage is transported by
air, however this approximately 120,000 tonnes of air freight per annum is mostly high value and time sensitive goods.
2012 modal shares
Mode
Rail 6.8%
Shipping 1.8%
Road 91.4%
Canterbury has the largest population centre in the South Island, an international airport and a container port. It represents a significant part
of the South Island’s freight task, accounting for 48% of the total freight move around the South Island. Current freight flows across the
South Island are dominated by shorter distance movements within regions. There are substantial flows into Canterbury from the West Coast,
reflecting the movement of coal and smaller movements from other regions highlighting the role of Canterbury as a distribution centre and
significant market. There are also large flows outbound from Canterbury, demonstrating its role as a distribution hub for the entire South
Island.
2012 freight task by region
100
Million Tonnes
69.6
33.1
8.9 8.9
11 11.3 3.6
0
48% 16% 16% 5% 13% 3.6
South Island Otago West Coast
Canterbury Southland Nelson/Marlborough
33.1
11
11.3
Figures shown in millions of tonnes
Page 9South Island Freight Plan
2.2 The demand for freight in the future
Based on forecasts outlined in The National Freight Demand Study, the South Island’s freight task between 2012 and 2042 is predicted to
increase by 68%, by 47.7m tonnes to a total of 117.3m tonnes. The greatest growth period is predicted to be between 2012 and 2027 with
the growth rate slowing in the years after that.
South Island freight task (MT) 2012 to 2042
120 117.2
110.9
106.5
99.9
91.6
Million Tonnes
78.6
69.6
0
2012 2017 2022 2027 2032 2037 2042
The modal share is forecast to change slightly in the future to 92% of freight moved by road, 6% by rail 1.6% by coastal shipping and a
very small amount (by weight) by air freight. Generally the freight modes that perform the task today are forecast to largely perform similar
roles into the future, albeit carrying higher total volumes of freight.
2042 modal shares
Mode
Rail 6%
Shipping 1.6%
Road 92%
91.4%
The regional share of the freight task in 2042 is forecast to be more or less the same as the current freight task but Canterbury’s share of
total freight movements increases slightly from 48% to 52% over the period 2012 to 2042.
Page 10JULY 2015
2042 Freight task by region
120 117.3
Million Tonnes
61.2
18 17.1 5.8 13
13
0
52% 15% 15% 5% 11% 5.8
South Island Otago West Coast
Canterbury Southland Nelson/Marlborough
61.2
18
17.1
Figures shown in millions of tonnes
The freight task will increase in terms of tonnage carried in all the regions over the period 2012 to 2042. There will also be an increase in the
distances travelled from supplier, to production faciltiy to market as patterns of farming change and increased farmland is under irrigation.
Canterbury will continue to play a central role. Freight growth in Canterbury will account for around 60% of all the growth forecast to occur
in the South Island over this period. To put this growth into perspective, an additional 47.7m tonnes of freight means the need for around
1.7m additional truck trips made in the South Island in 2042 compared with 2012. This equates to an additional 4,667 truck trips per day
across the South Island network.
Page 11South Island Freight Plan
2.3 Key drivers of this demand
Overview
Freight growth in the South Island is driven by export demand and area specific population growth. Twelve commodities will account for
approximately 90% of the forecast demand, with liquid milk, manufactured dairy, general freight, aggregate limestone/fertilizer/cement and
concrete the commodities forecast to consistenly account for the greatest growth in freight demand across all of the regions. Of the top
two commodities, only liquid milk, manufactured dairy and coal are driven by export demand while the others are tied to those regions with
population growth.
Forecast freight growth for the South Island by commodity (million tonnes)
30 Year % of
Commodity 2012 2017 2022 2027 2032 2037 2042 Growth Total
(MT) Growth
Liquid Milk 7.97 9.98 12.7 13.59 14.48 15.43 16.45 8.48 17.8%
Aggregate 6.84 8.06 9.21 10.38 11.51 12.66 13.79 6.95 14.6%
General Freight 14.6 15.78 17.03 18.17 19.28 20.34 21.38 6.78 14.2%
Limestone, Cement, Fertiliser 4.33 5.5 6.61 7.84 8.6 9.37 10.11 5.78 12.1%
Concrete 1.86 2.45 3.02 3.57 4.11 4.66 5.15 3.29 6.9%
Manufactured Dairy 2.21 2.79 3.62 3.87 4.19 4.46 4.77 2.56 5.4%
Logs to Sawmills 2.01 2.29 2.61 2.94 3.26 3.58 3.89 1.88 3.9%
Coal 3.16 3.45 3.61 3.76 4 4.34 4.67 1.51 3.2%
Livestock 3 3.3 3.75 3.93 4.1 4.32 4.5 1.5 3.1%
Other Retail 1.3 1.4 1.8 2 2.2 2.61 2.8 1.5 3.1%
Inputs to panel making 1.4 1.58 1.8 2.02 2.23 2.44 2.65 1.25 2.6%
Waste 1.73 1.95 2.12 2.33 2.51 2.7 2.87 1.14 2.4%
Horticulture 1.67 1.66 2.07 2.41 2.57 2.64 2.71 1.04 2.2%
Sawn timber 1.11 1.26 1.43 1.59 1.8 1.97 2.14 1.03 2.2%
Grain 0.85 1 1.13 1.27 1.42 1.57 1.72 0.87 1.8%
Supermarkets & Food Goods 2 2.2 2.2 2.3 2.4 2.69 2.8 0.8 1.7%
Panels 0.69 0.79 0.9 1.01 1.14 1.23 1.35 0.66 1.4%
Other Agriculture 0.58 0.69 0.84 0.88 0.93 0.98 1.06 0.48 1.0%
Petroleum 1.68 1.73 1.78 1.81 1.86 1.92 1.97 0.29 0.6%
Other Minerals 0.21 0.25 0.29 0.3 0.37 0.4 0.43 0.22 0.5%
Fish 0.63 0.65 0.69 0.7 0.72 0.74 0.77 0.14 0.3%
Couriers and Post 0.106 0.106 0.125 0.141 0.157 0.175 0.195 0.089 0.2%
Pulp and paper 0.17 0.17 0.17 0.18 0.18 0.19 0.21 0.04 0.1%
Steel and Aluminium 1.3 1.32 1.32 1.33 1.32 1.32 1.31 0.01 0.0%
Imported Vehicles 0.032 0.032 0.033 0.034 0.035 0.035 0.036 0.004 0.0%
Manufactured Goods 4.2 4.2 4.6 4.6 4.8 4.2 4.2 0 0.0%
Wool 0.111 0.111 0.111 0.111 0.111 0.111 0.111 0 0.0%
Meat and Meat Byproducts 0.45 0.39 0.37 0.39 0.4 0.41 0.42 -0.03 -0.1%
Export Logs 2.84 2.75 5.18 5.64 5.09 2.43 1.68 -1.16 -2.4%
Total 69.6 78.6 91.6 99.9 106.9 110.9 117.3 47.7 100.0%
The long term outlook for New Zealand’s dairy sector is positive, with steady growth in domestic production and firm demand from
emerging markets. The Ministry for Primary Industries (MPI) expects production to increase by 3% per year from 2015 to 2017 as cow
numbers and milk solids per cow increase gradually. The OECD-FAO expects New Zealand milk production to average 2.3% annual growth
between 2011 and 2020, while Fonterra estimates New Zealand milk production will be able to grow at around 3% per annum, through
growth in herd size and productivity gains. Fonterra expects that global milk production can grow at around 2% per annum (slightly slower
than New Zealand’s production) until 2020, not sufficient to keep up with growing global demand of around 3%. This is mainly driven by
China’s 7% annual demand growth outstripping its 4% supply growth.
Wood availability forecasts from MPI suggest there is potential for New Zealand to increase harvesting in the longer term. In 2015 around
24 million cubic metres (m3) of radiata pine will be harvested. These volumes are predicted to increase by 10 million m3 between 2015 and
2025. Forestry prices are also predicted to remain high owing to China’s forestry deficit impacting the world market. The MPI forecasts
log prices to increase from their 2013 level of $119 per m3 to $140 in 2017, an approximately 18% increase, while other processed wood
products are expected to have similar increases over the forecast period.
Page 12JULY 2015
Domestic freight
Rock used for roading makes up the bulk of aggregate use in New Zealand. The forecast increase in demand for aggregate is tied to the
growth in construction activity in the South Island.
As a grouping of industries, limestone, cement and fertiliser are extremely varied. Limestone is used in the production of lime which makes
its way into agricultural uses, cement and construction. Fertiliser is used in agricultural production while cement is used in the production of
concrete. As a result the forecast growth is based on a weighted average of the growth forecasts for dairy (60%) and concrete (40%).
The forecast growth for concrete has been developed in a very similar manner to that for aggregate for roading use. The historical
relationship between the use of concrete and GDP growth was analysed based on data from 1992 to 2012. This analysis indicates that
historically a 1% increase in GDP has been associated with a 2.2% increase in the use of concrete.
The forecast growth for the general freight commodities is based on a weighted average forecast of the growth rates of manufacutred
goods, supermarket and food goods and other retail goods. These industries were selected because general freight movements are most
likely to be relatively short-distance intra-regional movements and most likely consists of manufactured or retail goods.
The other driver of freight demand in the South Island is tourism. International and domestic visitor numbers are expected to increase
stongly. Places and routes in the South Island that will see large increases in visitors are most likely to be those already orientated towards
international visitors, such as Queenstown and it surrounds, including the journey to Te Anau and Milford Sound. Tourism growth increases
freight transport demand via the increase in the movement of goods to service visitor destinations and activities.
International freight
Currently there are a number of business developments taking place which are going to shape the way freight will be traded with overseas
markets. Fonterra and other major exporters are pushing for bigger container ships to call at a number of primary ports with regional ports
acting as feeders. The first businsess agreement in place is the 10 year deal between Maersk, Kotahi and Ports of Tauranga to invest in
infrustructure to handle container ships up to 6,500 TEU within the next few years. In this deal Maersk has committed a weekly service into
Timaru port and Kotahi has committed significant export cargo through Timaru for the next 10 years commencing 1 August 2014.
There are a number of external influences that determine the routing of international container cargo within the South Island. History has
shown that shipping lines from time to time alter their vessel schedules to either exclude or include ports. These decisions are driven by global
companies and trends and at relatively short notice can place additional pressure on the local logistics network as international trade volumes
shift to different areas and modes. This means that infrastructure can go through periods of both high and low utilisation as these volumes
come and go.
Only a small percentage of freight, by weight, is transported by air. However, given the type of goods transported and the time constraints
attached to these movements,the role air transport plays can be important to the South Island economy. The majority of this airfreight is
carried in the holds of domestic and international passenger air services. Christchurch International Airport provides import and export
services for high value and time sensitive freight and also operates as an airbase for New Zealand and international governments to supply
food and materials for Antartic scientific research. The airport operates 24 hours a day, seven days per week with no current restrictions for
aircraft take-off and landing.
Recently there has been a growing trend for trans-Tasman air services to be provided using narrow body aircraft. The reduction in the number
of wide body aircraft has a significant effect on the volume of freight that can be exported directly by air.
Page 13Draft South Island Freight Plan
2.4 The South Island transport network (as at August 2014)
Asia North
Australia Island
North
America/
Europe
State Highways
Rail Network
Airport (International/Domestic)
Nelson Picton
Airport (Domestic only)
Port
Blenheim
Westport
Rail (Passenger/Freight)
Rail (Freight only)
Road Freight Greymouth
Hokitika North
Island
CHRISTCHURCH
Timaru
Wanaka
Queenstown Oamaru
Dunedin
Invercargill Chatham Islands
Bluff
Stewart Island
The South Island transport network comprises of:
A State Highway network with 4,921km of roads (making up 12% of the South Island network) and 35,456km of local roads
(making up 88% of the South Island network).
1,661km of rail lines, consisting of two main lines, two secondary lines and a few branch lines.
One long distance international airport at Christchurch, two short haul international airports at Dunedin and Queenstown and eight
domestic airports.
Two major container ports, one at Lyttelton in Christchurch and one at Port Chalmers in Dunedin plus six regional ports (Nelson,
Picton, Westport, Greymouth, Timaru and Bluff)
Direct connections to the North Island via coastal shipping and road/rail ferries
Connections to international markets through direct vessel calls to Australia, Asia, North America and Europe.
The strategic freight network is the parts of the transport network that support the movement of high volumes (and/or values) of freight,
allow transfer to other modes and provide access to national and international markets. The strategic freight network extends over regional
boundaries, includes connections to both Stewart Island and the Chatham Islands and can include infrastructure and services that are the
responsibiltiy of either the public or private sectors. A key step in the development of this draft plan was the identification of the strategic
freight network and ways to improve its function.
Page 14JULY 2015
2.5 South Island summary
While the majority of freight (by weight) travels within the South Island’s regions rather than across them, freight movement across the
regions is critical to the South Island’s economy.
Canterbury has a significant portion of the South Island freight task; accounting for approximately half of the total freight moved and
this will continue into the future. It is predicted that just over half of the freight growth in the South Island to 2042 will take place in
Canterbury.
The majority of freight in the South Island is moved by road, and only a small percentage moves by rail, coastal shipping or air. The
freight modes that perform the task today are forecast to largely perform similar roles into the future.
The projected freight growth in the South Island is substantial, with an extra 47.7m tonnes of freight being carried in 2042 compared
with 2012. This increase equates to an additional 1.7m truck trips made in 2042 compared with 2012. This means an additional 4,667
truck trips (based on 44 tonne trucks) per day across the network.
Freight demand in the South Island is driven by a mix of primary sector and export growth, and population growth and change.
Demand is dominated by 12 commodities which account for 90% of the forecast freight demand. Of these commodities, only
liquid milk, manufactured dairy and coal will be driven by export demand while the others are driven by population growth and
demographic change.
Other business developments are shaping international freight in the South Island, such as the move to bigger ships, changing
commercial arrangements between ports and shipping lines, and changes to the availability of long haul aircraft.
The greatest growth in freight demand is forecast to occur between 2012 and 2027, with the rate of growth slowing beyond then.
Growth in the freight task needs skilled drivers (of which there is a current shortage) and skilled employees throughout the logistics
supply change.
47.7 Greatest growth
4,667 in demand
million extra between
tonnes of freight Additional truck
2012 and
will be carried trips per day
2027
in 2042
The remainder of this part of the report, provides more detail about the transport network, the current freight task and the predicted task in
the future for each of the regions:
Tasman/Nelson/Marlborough
West Coast
Canterbury
Otago
Southland
Page 15Draft South Island Freight Plan
2.6 Tasman/Nelson/Marlborough
The population of Tasman/Nelson/Marlborough is 140,700, which is 3.2% of the total population of New Zealand. This is forecast to grow
by 1.5% per annum between 2012 and 2031. Marlborough on its own makes up just over 1% of the New Zealand economy (measured by
GDP). It is a highly export focussed producer of primary products. A fifth of Marlborough’s workforce is employed in the primary sector. Over
the last decade the region has successfully converted most of the land formerly dedicated to cropping and stone fruit orchards to viticulture
so that Marlborough is now New Zealand’s largest wine-growing region. It has also diversified into manufacturing and services businesses
that leverage off primary sector activities. There has been an increase in technology-based and consultancy businesses providing services to
farming and forestry processing. Aquaculture, aviation and tourism are also important sectors in Marlborough.
Nelson/Tasman makes up almost 2% of the New Zealand economy. Nelson is predominantly urban while Tasman is predominantly rural.
Tasman is highly export focussed and relies on the factories, manufacturing and ports in both Nelson and Tasman for export. Over half of
Tasman’s primary sector employment is in horticulture and fruit growing, with forestry and fishing also being important. The Nelson region
is the smallest of New Zealand’s regions (by population and land area). It is really a city with Tasman and Marlborough regions providing its
hinterland. Although it is small, Nelson has developed economic activity in diverse sectors as well as some specialisations. It has particular
strengths in marine construction and aircraft interiors manufacturing and is home to almost one-third of New Zealand’s fishing and
aquaculture.
To service this region, Tasman/Nelson/Marlborough has 1,290km of State Highways and 2,063km of local roads. Marlborough has
approximately 115km of rail network and the region is home to Nelson and Marlborough airports. It has two ports, Port Nelson is a major
port for log exports from Nelson/Marlborough forests and Port Marlborough at Picton is the main link between the South and North Islands,
with scheduled ferry services across Cook Strait carrying both passengers and freight and also has a dedicated deep water berth for log
exports.
Tasman/Nelson/Marlborough Freight Infrastructure
Key Infrastructure TNM NZ
Road density (length per 1000km2 area, 2010) 181 215
Heavy Vehicle km travelled per km of network (2011) 131 329 97 686
International Connections
Cargo traded through regional ports ($m) – Exports 929 48 076
Cargo traded through regional ports ($m) – Imports 286 47 037
State Highways
Rail Network
Airport (Domestic only)
Port Nelson Picton
Rail (Passenger/Freight)
Rail (Freight only) Blenheim
The bulk of the freight originating from the region moves within the region. Of the 9.3 million tonnes moved in 2012, 86% moved intra-
regionally, 4% moved north and 10% moved south. This reflects Tasman/Nelson/Marlborough’s critical role as a through point for freight
moving across the Cook Strait and travelling south. There are also strong volumes moving to and through the region, increasing the total
freight moved to 14.6 million tonnes.
Page 16JULY 2015
Tasman/Nelson/Marlborough’s freight movements for 2012
86
Within region
North
South 4 10
Over the thirty years between 2012 and 2042 the freight task for Tasman/Nelson/Marlborough is forecast to grow by 4.7 million tonnes. The
bulk of this demand is expected to be driven by the following commodities; aggregate, general freight, logs to sawmills and port for export,
concrete and increased volumes of general freight moving south over the Cook Strait. The largest amount of cargo moving long distances is
the general freight component moving between Auckland and Canterbury and this is likely to increase by 2042.
Freight growth in Tasman/Nelson/Marlborough
40
Million Tonnes
13.1 13.8 13.5 14
11.8
9.3 10
0
2012 2017 2022 2027 2032 2037 2042
Page 17Draft South Island Freight Plan
Tasman/Nelson/Marlborough’s freight movements for 2042
86
Within region
North
South
3 11
Based on forecasts Tasman/Nelson/Marlborough’s freight demand picture in 2042 is predicted to be 14 million tonnes with 86% being
moved intra-regionally, 3% moving north and 11% heading south. This increase in demand is equivalent to an additional 157,000 (44
tonne) truck trips per year across Tasman/Nelson/Marlborough by 2042. Over the same time rail freight is forecast to increase by 0.21 million
tonnes, which equates to an extra 2,000 wagon movements per year placing an extra 0.28 million tonnes of demand on Tasman/Nelson/
Marlborough’s rail infrastructure.
2.7 West Coast
The population of the West Coast is 33,000, which is 0.7% of the total population of New Zealand. This is forecast to grow by 0.1% per
annum between 2012 and 2031. The region spans the greatest length of any region in New Zealand, equivalent to the distance from
Auckland to Wellington. Of its land area 85% is part of the National Conservation Estate and not available generally for primary production.
Over the last decade, average household incomes on the West Coast have grown so that they are now among the highest in New Zealand.
The region has experienced significantly higher than average growth in jobs but this growth has declined in recent years. The West Coasts’s
GDP was $1,535m in 2013, a decline of roughy 6% over the 2012-13 year. The region’s economy is dominated by agriculture and mining
and is highly export oriented. Mining directly employs about 10% of the region’s workforce and dairying about six%, but together, these
high-value, capital-intensive activities generate over half of the region’s income. These businesses make the West Coast highly export
orientated.
Coal is the primary mineral extracted and relies on local roads and state highways within the region for transport of material to rail heads,
and the rail network for export to markets through Lyttelton. Agriculture is dominated by dairying. It has a heavy reliance on the roading
network for the transport of milk product from farms and factories spread throughout the region. Westland has one dairy plant at Hokitika,
processing around 500 million litres of milk annually. The industry has experienced rapid growth over the past 10 years. Finished product is
railed out of the region to be exported from Lyttelton. Forestry has declined in recent years but still remains an important industry on the
West Coast. Local roads and state highways provide important linkages between forests, mills, and to market (or rail heads) throughout the
region.
To service this region, the West Coast has 871km of State Highway and 1,640km of local roads. It also has 370km rail network which
includes the Midland Line from Arthur’s Pass to Stillwater, the Stillwater Ngakawau line, the Rapahoe line from Greymouth to Rapahoe and
the Hokitika line from Greymouth to Hokitka. There are also regional ports at Westport and Greymouth and a regional airport at Hokitika.
Page 18JULY 2015
West Coast’s freight infrastructure
Key Infrastructure West Coast NZ
Road density (length per 1000km area, 2010)
2 104 215
Heavy Vehicle km travelled per km of network (2011) 131 329 97 686
International Connections
Cargo traded through regional ports ($m) – Exports 0 48 076
Cargo traded through regional ports ($m) – Imports 0 47 037
State Highways
Rail Network
Airport (Domestic only)
Port
Rail (Passenger/Freight) Westport
Rail (Freight only)
Greymouth
Hokitika
The bulk of the West Coast’s freight moves east to Canterbury. Of the 5.54m tonnes moved in 2012, 47% moved intra-regionally, 2%
moved north and 51% moved east.
Page 19Draft South Island Freight Plan
West Coast’s freight movements for 2012
51
47
2
Within region
North
East
Between 2012 and 2042 the freight task for the West Coast is forecast to grow by 2.7m tonnes. The bulk of this demand is expected to
be driven by three commodities; liquid milk, aggregate and limestone/cement/fertiliser. However the movement of coal will depend on the
international demand and price for the type of coal that the West Coast produces.
Freight growth in West Coast
40
Million Tonnes
7.1 7.4 7.8 8.2
5.5 6.2 6.3
0
2012 2017 2022 2027 2032 2037 2042
Page 20JULY 2015
West Coast’s freight movements for 2042
48
50
2
Within region
North
East
Based on forecasts the West Coast’s freight demand picture in 2042 is predicted to be 8.19m tonnes with 50% being moved intra-regionally,
2% moving north and 48% moving east. This increase in demand is equivalent to an additional 89,000 (44 tonne) truck trips per year across
the West Coast by 2042. Over the same time rail freight is forecast to have a minimal increase of 0.11m tonnes, which will not impact on
the West Coast’s rail infrastructure.
2.8 Canterbury
The population of Canterbury is 558,000, which is 12.6% of New Zealand’s population. This is forecast to increase by 0.8% per annum
between 2012 and 2031. Canterbury is New Zealand’s largest region by area. Christchurch is home to nearly three quarters of the region’s
people and a transport hub for the whole of the South Island. The Christchurch earthquakes rebuild, which is estimated to cost $30bn, has
stimulated economic activity and transport demand both regionally and nationally. Canterbury is New Zealand’s second biggest economy at
13.2% of GDP with economic activity evenly distributed between the agriculture, manufacturing and services sectors. There has been a rapid
conversion of land to dairy farming in the region over the last decade and Canterbury now has the highest average dairy herd size in New
Zealand and correspondingly high productivity levels.
To service the region Canterbury has 1,330km of State Highways, 14,220km of local roads and approximately 650km of rail network. The
region has a deep water port at Lyttelton and another port at Timaru. Lyttelton currently handles approximately 50% of the South Island’s
container cargo. Canterbury is also the home of the South Island’s only long haul international airport at Christchurch which also operates as
the base for the supply of food, materials and personnel to Antarctica.
Page 21Draft South Island Freight Plan
Canterbury’s freight infrastructure
Key infrastructure Canterbury NZ
Road density (length per 1000km area, 2010
2 338 215
Heavy Vehicle km travelled per km of network (2011) 177 300 97 686
International connections
Cargo traded through regional ports ($m) – Exports 8 727 48 076
Cargo traded through regional ports ($m) – Imports 4 383 47 037
State Highways
Rail Network
Airport (International/Domestic)
Airport (Domestic only)
Port
Rail (Passenger/Freight)
Rail (Freight only) CHRISTCHURCH
Timaru
The bulk of freight in Canterbury moves within the region. Of the 33 million tonnes moved in 2012, 87% moved intra-regionally. Of the
13% of line haul freight, 5% move north, 6% moved south and 2% moved west.
Canterbury’s freight movements for 2012
87
5 6
2
Within region South
North West
Over the thirty years between 2012 and 2042 the freight task for Canterbury is forecast to grow by approximately 28.2 million tonnes to
61.2 million tonnes. The bulk of this demand is expected to be driven by six commodities; liquid milk, manufactured dairy, general freight,
aggregate limestone/cement/fertiliser and concrete.
Page 22JULY 2015
Freight growth in Canterbury
80
Million Tonnes
61.2
57.1
53.1
49.1
45
37.8
33
0
2012 2017 2022 2027 2032 2037 2042
Of the 12% being line hauled, 5% will move north, 5% will move south and 2% will move west.
Canterbury’s freight movements for 2042
88
5 5 2
Within region South
North West
Canterbury’s total freight demand in 2042 is predicted to be 61.2m tonnes. This increase is equivalent to an additional 940,000 (44 tonne)
truck trips per year across Canterbury. Over the same time rail freight is forecast to increase by 1.4 million tonnes, which equates to an
extra 10,000 wagon movements per year placing an extra 1.9 million tonnes of demand on Canterbury’s rail infrastructure. Any increase in
passenger rail in the future could put pressure on the rail network to accommodate increasing freight movements.
Page 23Draft South Island Freight Plan
2.9 Otago
The population of Otago is 211,300, which is 4.8% of the total population of New Zealand. This is forecast to grow by 0.5% per annum
between 2012 and 2031.
Otago contributes 4.3% to GDP and provides 5% of national employment. The region has a diverse economy with strengths in agriculture,
tourism, and education . The three major contributors to GDP are business services, social services and manufacturing. Manufacturing is
significant in Waitaki and Clutha Districts, while sheep, dairy, beef and grain farming, are primarily concentrated in Clutha, Central Otago
and North Otago. Central Otago has strengths in stone and pip fruit production, plus grape growing and wine production.
Around 50% of the region’s workers live in Dunedin, which accounts for approximately 50% of the regions GDP. Professional, scientific and
technical services experienced 4% annual average employment growth over the last decade, while education and training employment grew
2.1% over the same period, reflecting strong tertiary education and research activity in Dunedin.
Tourism is important in each of Otago’s districts, particularly Queenstown Lakes, and has shown solid growth over the last five years. Over
the last 10 years, population growth in Queenstown Lakes and Central Otago has been amongst the highest in New Zealand, reflecting
both growth in tourism and people moving into this area for lifestyle reasons. Population growth in the rest of the region has been much
slower.
To service this region, Otago has 1,304km of State Highways and 9,260km of local roads. There are two railway lines totalling 285km of
main trunk line and 65km of branch line, the later used primarily as tourist railways. The region also has two short haul international airports
at Dunedin and Queenstown, a number of regional airports and New Zealand’s deepest container port at Port Chalmers (primarily for freight
export).
Otago’s freight infrastructure
Key Infrastructure Otago NZ
Road density (length per 1000km2 area, 2010) 310 215
Heavy Vehicle km travelled per km of network (2011) 60 850 97 686
International Connections
Cargo traded through regional ports ($m) – Exports 3 854 48 076
Cargo traded through regional ports ($m) – Imports 356 47 037
Wanaka
Queenstown Oamaru
State Highways
Rail Network
Airport (International/Domestic) Dunedin
Airport (Domestic only)
Port
Rail (Passenger/Freight)
Rail (Freight only)
Page 24You can also read