From PES to PDSA: A guide to using the patient experience survey portal for quality improvement - New Zealand Doctor
←
→
Page content transcription
If your browser does not render page correctly, please read the page content below
From PES to PDSA:
A guide to using the patient experience
survey portal for quality improvement

                               www.hqsc.govt.nz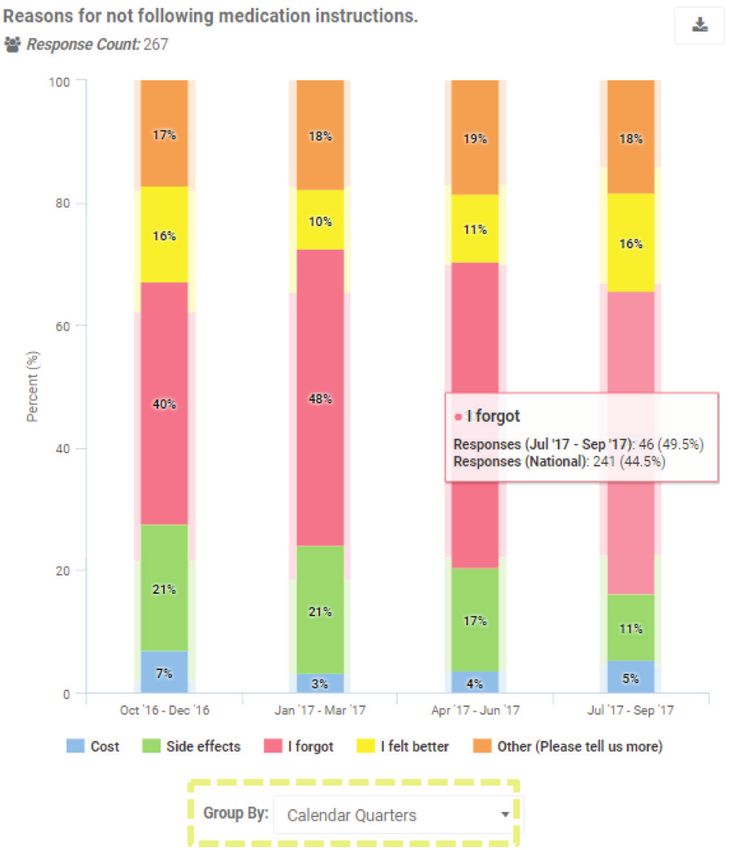
Contents
Introduction.................................................................................................................................................1

Finding your QI opportunity .....................................................................................................................2

PDSA – plan................................................................................................................................................5

PDSA – do...................................................................................................................................................7

PDSA – study..............................................................................................................................................8

PDSA – act..................................................................................................................................................8

© Health Quality & Safety Commission 2018
Published in March 2018 by the Health Quality & Safety Commission,
PO Box 25496, Wellington 6146, New Zealand
This document is available on the Health Quality & Safety Commission’s website: www.hqsc.govt.nz
Introduction
The primary care patient experience survey (PES) and its reporting portal were designed by the Health
Quality & Safety Commission to empower your organisation to engage in quality improvement (QI)
initiatives that are both meaningful to patients and whānau, and relevant to your primary health
organisation (PHO) and practice.

The survey and the adult in-hospital survey make up the ‘Patient experience of care’ System Level
Measure, and support the system goals for people-centred and whānau-owned care. Engaging in a
quality improvement activity using the survey meets indicator 9, ‘the practice includes patients’ input
into service planning’ of the Royal New Zealand College of General Practitioner’s Aiming for Excellence
standard.

This manual is designed to help you both meet indicator 9 and conduct quality improvement initiatives
in your district alliance System Level Measure improvement plan. We will show you how to use the
reporting portal for QI activities and track progress through following an example QI initiative. We
will show you how to engage with the portal while using a plan–do–study–act (PDSA) cycle. You
may choose to mirror this initiative as a way to ‘get to know’ the portal’s functions and use it more
efficiently when the time comes to run your own improvement activity..

From PES to PDSA: A guide to using the patient experience survey portal for quality improvement           1
Finding your QI opportunity
You may already know of an area your PHO or practice might wish to focus
on. You might also know that unless you take the time to stop and look at TIP: If you’re not sure
the problem, nothing will change. Luckily, the reporting portal is designed to of your PES portal login
lessen the burden of time. So, let’s log in. details, use the ‘forgot
password’ functionality
The portal’s dashboard (Figure 1) gives you an immediate snapshot of where
on the landing page.
to focus. You can quickly see the areas where your PHO or practice is doing
well and areas to work on. Topics for improvement can come in many forms:
you could look at variation between groups of people (eg, Māori reporting worse coordination of care
compared with non-Māori), variation among your practices (if you are a PHO), or perhaps just a low-
scoring question.
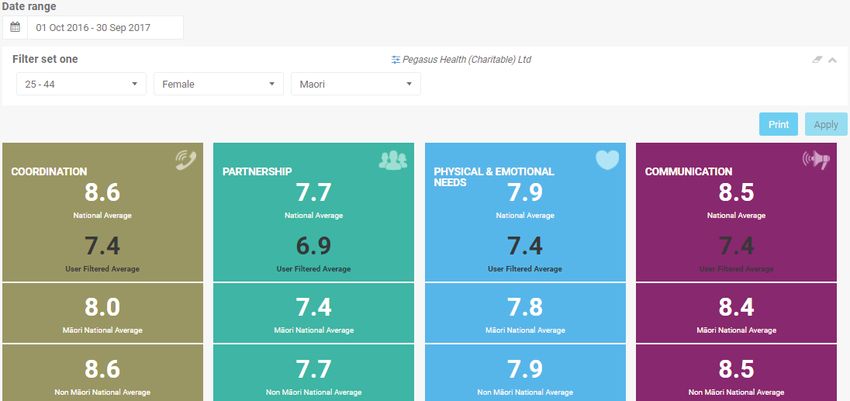
Figure 1: Example of portal dashboard
GET THE LOOK TIP: The black number shows the
group of people you have filtered by.
1. Date range: 01 Oct 2016–30 Sep 2017
Here, we can see Māori women aged
2. Filters: 25–44; Female; Māori 25–44 report receiving worse care
across all domains.
As an example, say, as a practice, you have noticed patients and whānau not responding to their
medication as expected, and you think it may be because they are not taking the medication as
prescribed.
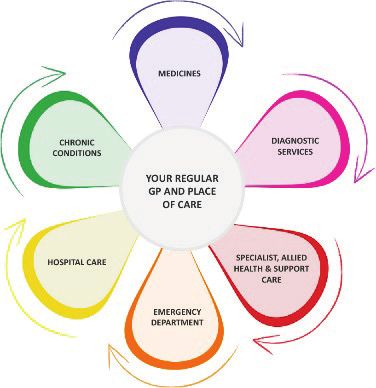
Using the navigation bar on the left side of the portal, select ‘Medicines’ and you will be taken to all of
the survey questions that relate to medicines. Start by testing whether you and your team’s hypothesis
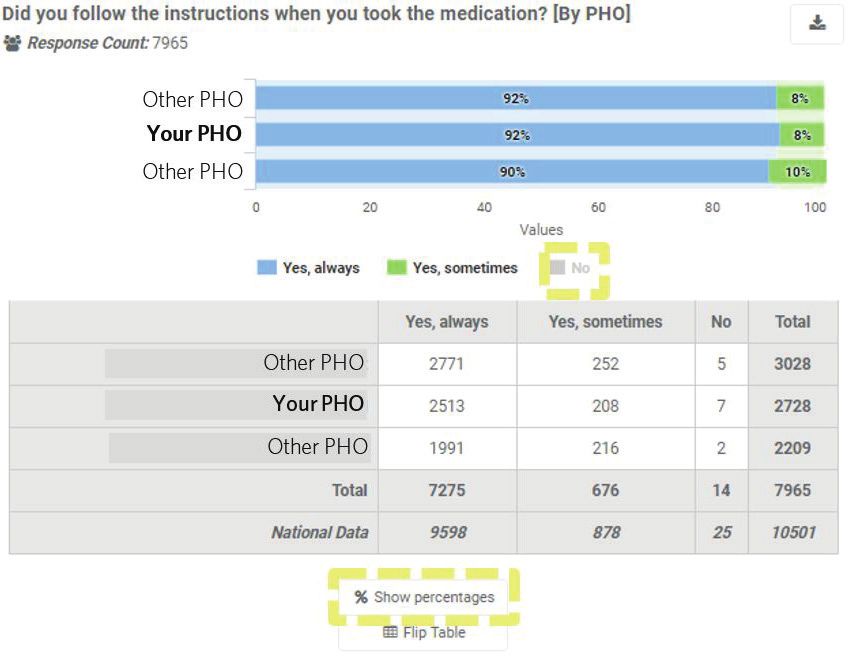
is right by clicking on ‘Followed instructions’ (Figure 2).
From PES to PDSA: A guide to using the patient experience survey portal for quality improvement 2Figure 2: Example ‘Followed instructions’ screen
GET THE LOOK TIP: The shaded area behind the
bars shows the national proportional
1. Date range: 01 Oct 2016–30 Sep 2017
response to the question.
2. Chart configuration: by PHO
3. Filter: selected PHOs with similar
response numbers
4. Select ‘No’ to remove from and tidy graph
5. Select ‘Hide percentages’
Looking at the graph at the top of Figure 2 you can see that since October 2016, 8 percent of people
have reported ‘Yes, sometimes’ they follow instructions when taking their medication. Looking at
the table at the bottom of Figure 2, you can see this is 208 of people and an additional seven who
responded ‘No’. Let’s see if we can find out why.
Start by exploring the reasons for people not taking their medication as instructed. Click on ‘Why not
following instructions’. You can see in Figure 3 that in July–September 2017, 46 people (49.5 percent
of your responders) reported not following medication instructions because they forgot.
Looking over the previous quarters, you can quickly see there is a pattern to this response because
the proportion of ‘I forgot’ responses has remained consistent since October 2016. This suggests you
will keep getting the same result unless you make a change to the system.
From PES to PDSA: A guide to using the patient experience survey portal for quality improvement 3You can continue to explore the other questions within the portal to get a better picture of why your
patients might be forgetting to take their medication as prescribed. Through exploring the responses
to these questions, you’re already on your way to incorporating patient feedback into improving your
services.
Figure 3: Example graph showing medication use
GET THE LOOK
1. Date range: 01 Oct
2016–30 Sep 2017
2. Chart configuration:
trend results
3. Group by: calendar
quarters
4. Hover over each section
of the bar to show the
numbers that make up
the percentage
TIP: As rule of thumb,
check for a minimum
response count of 30
to a question as a good
starting point before
making any changes. For
comments, a smaller
number is sufficient to
start taking note, eg,
three or more people
noting a similar issue.
From PES to PDSA: A guide to using the patient experience survey portal for quality improvement 4PDSA – plan
Gather your team
Now you have clearly identified a problem and found data to support it,
the next step is to gather together a team to help you understand and People to consider for your
solve the problem. team:
Patient/consumer/whānau
The size of the team will reflect the size of your practice and the breadth
Māori advisor/patient/
of the issue you are working to improve. Make sure everyone in the team
whānau
has a job, as this means there are not ‘too many cooks in the kitchen’ and
Health care assistant
that each person is lending a helping hand to the team.
Registered nurse
If you have a patient or whānau willing to be involved, their perspective General practitioner
will add a lot of value. If your problem disproportionately affects Manager
Māori, consider getting a Māori patient or whānau to join the team. Medical doctor
Alternatively, if your PHO has a Māori health advisor, ask if they can help. Pharmacist
Physiotherapist
If no patient or whānau is able to join the team, you can ensure the Dietician
consumer voice is heard by using the comments section of the portal. Nurse practitioner
When used in tandem with the demographic information survey
respondents provide, comments allow you to collect feedback across Tool A in this toolkit offers
age, gender and ethnic groups. Later, we discuss how to do this. more information on other
roles you might look for.
Finally, assign a leader or driver to your project to ensure follow-up and
check in on progress. This may be you.
Define your aim
Next, clearly define what you are hoping to accomplish by creating an aim statement. The aim
statement will answer the following four questions:
Elements of aim Example
1. For whom? Who? Population in target
Enrolled adults (15 years and over) who
Where? Location
respond to PES questions on prescribed
During what part of the medication
When?
process
2. What? Decreasing the number of people who forget
What it is about?
to take their medication as prescribed.
3. How much? Baseline 49.5%
Target 25%
Metric used Eg, percentage, average, etc Percentage
4. When? Timeline One year from start of project
Following our example, our aim statement would be:
To decrease, from 49.5 percent to 25 percent over a period of one year starting on 1 July
2018, the number of patients/consumers/whānau who cite ‘I forgot’ as the reason for not
taking their medication as prescribed.
From PES to PDSA: A guide to using the patient experience survey portal for quality improvement 5Measuring your progress
Now you and your team are clear about your aim, you will need to answer the question ‘How will we
know a change is an improvement?’
We can follow the trend graph in Figure 3 to see whether there are any changes to the baseline of
49.5 percent from quarter to quarter. Take a screen shot of this and put it into your practice action
plan. It can be used as evidence of your practice meeting indictor 9.
Next, determine what your intervention is going to be, ie, what you are going to do differently to try
and achieve your aim. Try brainstorming ideas with your team or ask other people outside who might
provide valuable insight. For now, let’s start by looking at patient comments for any helpful clues as to
why patients/whānau are forgetting to take their medication as prescribed.
The bottle from I need to have good
pharmacy had different Eating for one and explanation because
instructions from what not for the other first of reading – I get
the doctor said thing in the morning frustrated quickly
is impossible
I misread the
My pharmacy always texts me Didn’t like instructions
to pick up my repeats – this is taking the
excellent, as I may forget! large tablets
You can narrow your search by looking at responses only to certain questions (see Figure 4) or
searching by a particular word you are interested in. You can also use this as an opportunity to
identify the voice of a particular age, gender or ethnic group.
Figure 4: Example of responses to specific questions
From PES to PDSA: A guide to using the patient experience survey portal for quality improvement 6What changes can you make that will result in improvement?
Now you have a couple of ideas on some of the issues patients/whānau
are experiencing. You even have some recommendations made by your TIP: For a more in-depth
patients/whānau about what would make a difference for them. look to find the underlying
causes of a problem, try
In this example, say you take one of the patient’s/whānau’s using a process map or a
recommendations and implement a process where your practice cause and effect diagram
will begin to send emails to patients/whānau with new prescriptions with your team. Use tools
summarising: G and I in this toolkit.
• their new medication
• the doctor’s instructions TIP: If you are doing a
• a link to a reputable source (eg, Health Navigator or Health Info) for project involving health
more information. literacy, the Commission
has a number of
At a minimum, you decide the email should tell the patient/whānau resources your practice
that if they receive any conflicting information about their medication or PHO might find useful,
or are confused by any information given, not to hesitate to ring a staff such as the Let’s PLAN for
member at the practice. There may be other people within the practice better care flyer.
who have roles to play and actions to take. Make sure everyone is aware
of who is doing what, where and when, and if possible why.
PDSA – do
As you implement an intervention, ie, what it is you will be doing
differently, you will want to make sure the change is actually occurring. TIP: If possible, avoid
making a large number
Because the survey runs quarterly, the intervention your practice chooses of changes at once, or
will need to be implemented over a period of three months before the you will not know which
results show in the portal. change is responsible for
To make sure the change is occurring, look at what is happening. Is the the success or failure of
new procedure being followed? Does everyone know what they are the intervention.
meant to be doing?
Try scheduling regular meetings with the people involved to see how the QI activity is going. It could be
quite demotivating to find out three months down the track that the intervention had unintentionally
been forgotten within the first two weeks. Changing process isn’t always easy.
Tell everyone!
Once you have reached a point where you know what you are going to do and perhaps have started
doing it, let your patients/whānau and other practice staff know the service changes your practice
is incorporating as a direct result of feedback collected by the primary care PES. Telling them what
you are doing may even prompt them to talk to their GP and help to embed the change. You can
communicate via posters throughout your practice, email, flyers on the waiting room table and/or
telling patients and whānau what to look out for when they first come into your practice.
Highlighting the work you are doing will signal to patients and whānau who have already completed the
PES their voice is being heard, and for those who have not taken the survey that their voice will be heard.
File any notices with your practice action plan to support the meeting of indicator 9.
From PES to PDSA: A guide to using the patient experience survey portal for quality improvement 7PDSA – study
At the end of each survey round, once you have received the results, gather your team together for a
short informal meeting. Analyse your data and any other information gathered. Compare what you
thought might happen against what actually happened.
1. What happened? Check in with your GPs to see how the new system is going. Are they remembering to
note who has a new prescription and how best to send a medication reminder and summary?
2. What is the information telling us? Did any patients or whānau talk about the new system? Did they
provide any extra feedback?
3. Is the latest survey information telling us different things for different people? Have the number of
people who respond ‘I forgot’ decreased?
4. What worked and what didn’t work? Did this work for all groups of people or just for some? Was the
intervention too difficult to implement?
5. What should be adopted, adapted or abandoned? Would it be an option to provide the details of a
reputable website such as Health Navigator/Health Info for patients/whānau who have easy internet
access?
As you look to improve your practice’s services you will try to identify any changes from quarter to
quarter. If you don’t notice any improvement, you may want review what your intervention is and see
if there is something else you could try.
PDSA – act
At the end of each survey quarter, act on the results by deciding whether you will continue to
implement the intervention as you were doing previously, or whether some modifications are needed
(for example, reminders to staff to implement the change).
The very end of your QI activity is also a key point to determine the next step. Imagine you have
reached the end of the trial period of our example QI activity. You and your team have completed
four survey cycles and it is now 30 June 2019. There are two possible outcomes:
It worked!
The survey results showed, at first, a small increase from 49.5 percent TIP: A test that didn’t
to 53 percent in the percentage of respondents who cited ‘I forgot’ as work is not a failure. You
the reason for not following their medication instruction. However, by will have learned just as
1 July 2019, the number of patients and whānau who were told what much, and perhaps more,
to do if they experienced side effects decreased to 24.6 percent! by identifying what doesn’t
work as you do from a
It didn’t work... success. While discussing
The survey results showed, at first, a small increase from 49.5 percent a new invention with a
to 53 percent in the percentage of respondents who cited ‘I forgot’ as reporter, Thomas Edison is
the reason for not following their medication instruction. However, by said to have replied: ‘I didn’t
1 July 2019, the number stayed fairly similar to previous quarters. fail 1,000 times. The light
bulb was an invention with
1,000 steps.’
From PES to PDSA: A guide to using the patient experience survey portal for quality improvement 8In both instances, consider the following questions with your team: 1. Did your action plan achieve its desired results? 2. Are you going to embed the new practice into long-term business as usual? 3. Summarise changes that took place and how they are a result of patient feedback. Whatever happens, let your patients, whānau and colleagues know you will/will not be implementing the changes as a result of the previous year trial period. Let everyone know the changes to the services within the practice are a direct result of patient and whānau feedback. From PES to PDSA: A guide to using the patient experience survey portal for quality improvement 9
www.hqsc.govt.nz
You can also read