Fruits and vegetables - MARCELA VILLARREAL, PH.D. DIRECTOR, PARTNERSHIPS AND UN COLLABORATION DIVISION FAO
←
→
Page content transcription
If your browser does not render page correctly, please read the page content below
Fruits and
vegetables
MARCELA VILLARREAL, PH.D.
DIRECTOR, PARTNERSHIPS AND UN COLLABORATION DIVISION
FAO
A BrokenWorld Food System
Hunger and malnourishment -definitions
690m undernourished
135m acute food insecurity
1.8 bn adults overweight
+672 m obese
2 bn persons micronutrient defficient
Food loss and waste
About 1/3 of all food produced
Food production: Enough food produced in the world
for all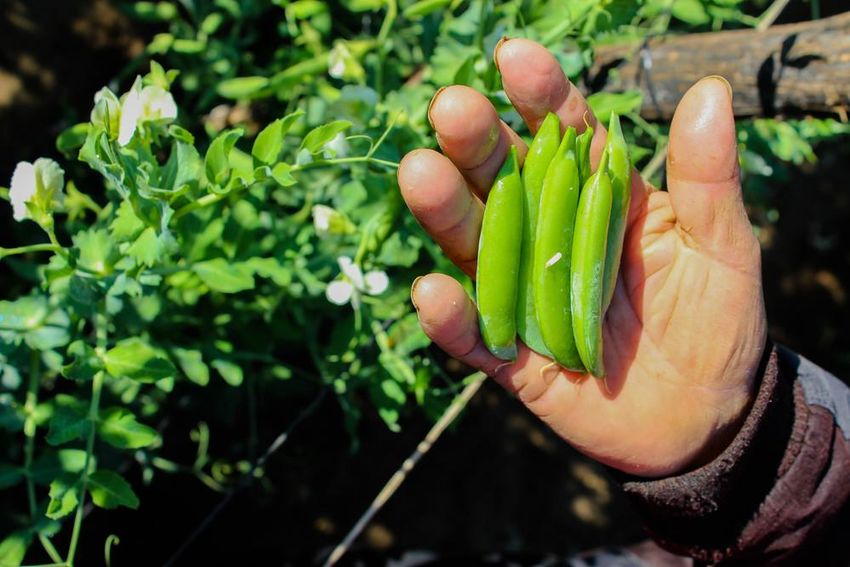
5
Hunger (chronic undernourishment) is on the rise

                                              2 / 11

                                                       Source: FAO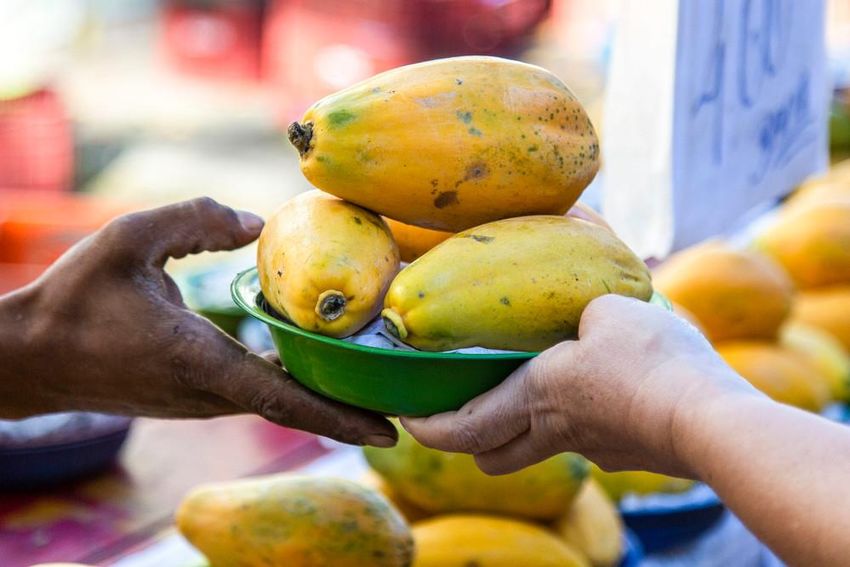
Undernourished

Latin America
and Caribbean

South
Eastern Asia    Southern Asia

 Eastern Asia
                Sub-Saharan
                Africa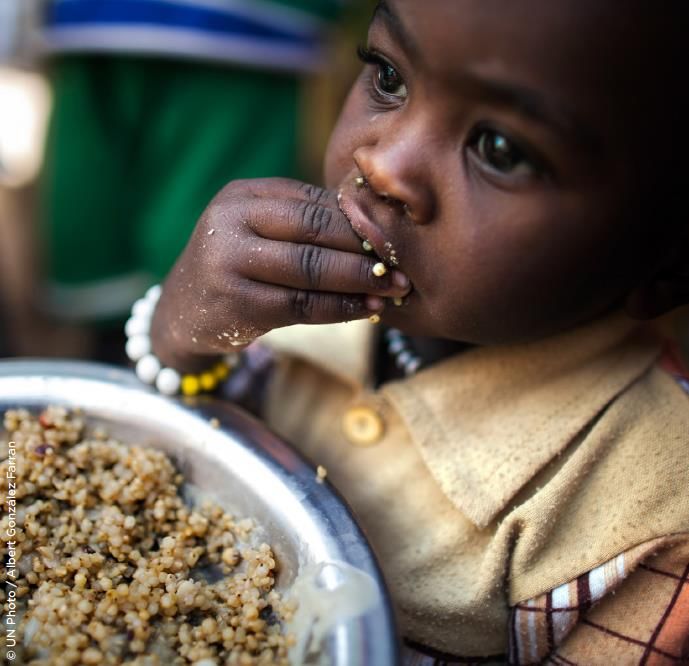
Proportion of obese adults in the
world

                                         13,2

                                  12,8
Percentage

                           12,4

                    12,1

             11,7

             2012   2013   2014   2015   2016
31/05/2018 FRUITS AND VEGETABLES YOUR DIETARY ESSENTIALS
International Year of Fruits and Vegetables 2021

 DESIGNATED BY THE UN GENERAL ASSEMBLY

 FAO IS THE LEAD AGENCY IN COLLABORATION WITH OTHER ORGANIZATIONS AND BODIES OF THE
 UNITED NATIONS SYSTEM

 UNIQUE OPPORTUNITY TO RAISE AWARENESS ON THE IMPORTANT ROLE OF FRUITS AND VEGETABLES IN
 HUMAN NUTRITION, FOOD SECURITY AND HEALTH AND AS WELL IN ACHIEVING UN SUSTAINABLE
 DEVELOPMENT GOALS.
31/05/2018
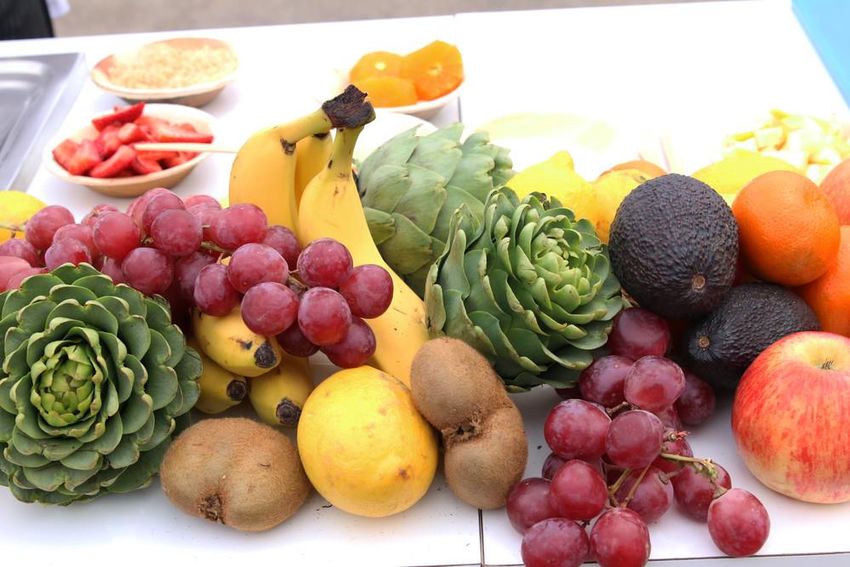
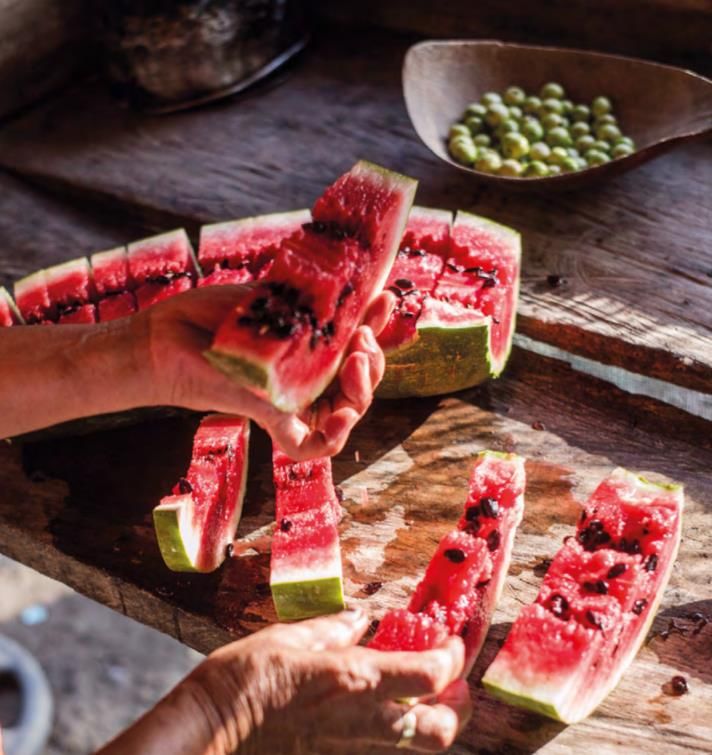
What are Fruits and Vegetables
(This Definition is for the purpose of the IYFV)
Fruits and vegetables are considered edible parts of plants (seed bearing structures, flowers, buds,
leaves, stems, shoots and roots) either cultivated or harvested wild, in their raw state or in a
minimally processed form
EXCLUDED FROM THIS DEFINITION ARE:
• Nuts, seeds and oilseeds such as coconuts, walnuts,
• Starchy roots and tubers such as cassava, sunflower seeds
potato, sweet potato and yams (although • Medicinal, herbal plants and spices, unless used as
leaves of these plants are consumed as vegetables
vegetables) • Stimulants such as tea, cacao, coffee
• Dry grain legumes (pulses) unless harvested • Processed and ultra-processed products made from
when immature fruits and vegetables such as alcoholic beverages (e.g.
• Cereals including corn, unless harvested wine, spirits), plant-based meat substitutes, or fruit and
when immature vegetable products with added ingredients (e.g.
packed fruit juices, ketchup)Objectives of the IYFV 2021
1. RAISING AWARENESS OF AN DIRECTING POLICY
ATTENTION TO THE NUTRITION AND HEALTH BENEFITS
OF FRUITS AND VEGETABLE CONSUMPTION;
2. PROMOTING DIVERSIFIED, BALANCED AND HEALTHY
DIETS AND LIFESTYLES THROUGH FRUITS AND
VEGETABLES CONSUMPTION;
3. REDUCING LOSSES AND WASTE IN FRUITS AND
VEGETABLES FOOD SYSTEMS;
4. SHARING OF BEST PRACTICES.Key Messages Harness the goodness Fruits and vegetables have multiple health benefits, including the strengthening of the immune system, that are essential for combating malnutrition in all its forms and overall prevention of non- communicable diseases Live by it, a diverse diet Fruits and vegetables should be consumed in adequate amounts daily as part of a diversified and healthy diet. Respect food from farm to table The high perishability of fruits and vegetables needs special attention to maintain their quality and safety through appropriate treatment and handling across the supply chain from production to consumption in order to minimize loss and waste.
Key Messages
Innovate, cultivate, reduce food loss and waste
Innovation, improved technologies and infrastructure are
critical to increase the efficiency and productivity within fruits
and vegetables supply chains to reduce loss and waste.
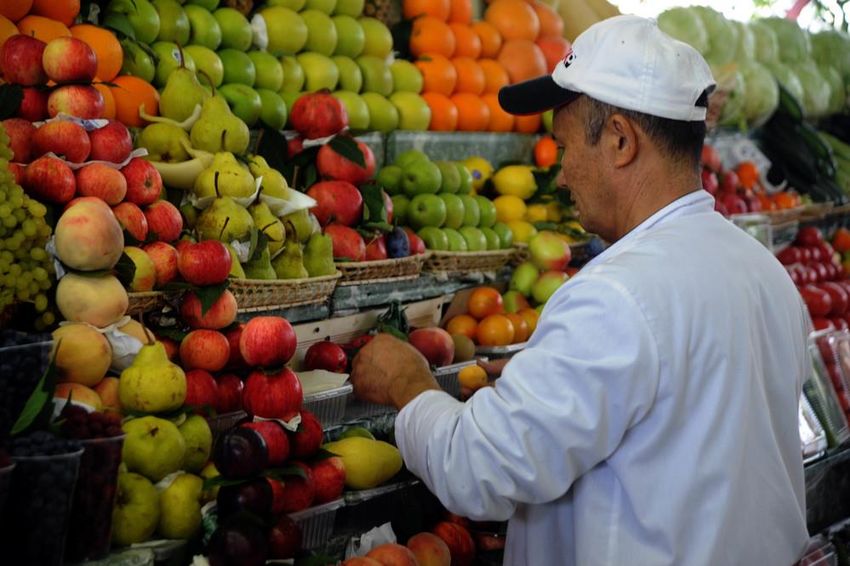
Foster sustainability
Sustainable and inclusive value chains can help increase
production, help to enhance the availability, safety,
affordability and equitable access to fruits and vegetables to
foster economic, social, and environmental sustainability.
Growing prosperity
Cultivating fruits and vegetables can contribute to a better
quality of life for family farmers and their communities. It
generates income, creates livelihoods, improves food security
and nutrition, and enhances resilience through sustainably
managed local resources and increased agrobiodiversity.Key Facts Digital innovations make it possible to track and trace fresh produce from production to consumption. This broadens market opportunities, reduces losses and waste and makes the value chain more transparent. Fruits and vegetables are good sources of dietary fiber, vitamins and minerals, (e.g. folate, vitamin A and C, potassium) and beneficial phytochemicals. As part of a healthy diet, fruits and vegetables can help lower risk factors for non- communicable diseases, such as overweight/obesity, chronic inflammation, high blood pressure, and high cholesterol
Key Facts
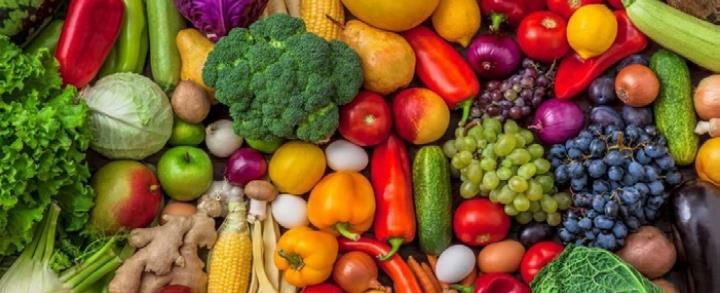
A minimum amount of 400g
per day or five portions of
fruits and vegetables is
beneficial for health.
Introduce fruits and
vegetables at as early as 6
months of age and keep
them as regular parts of a
healthy diet throughout life.Key Facts
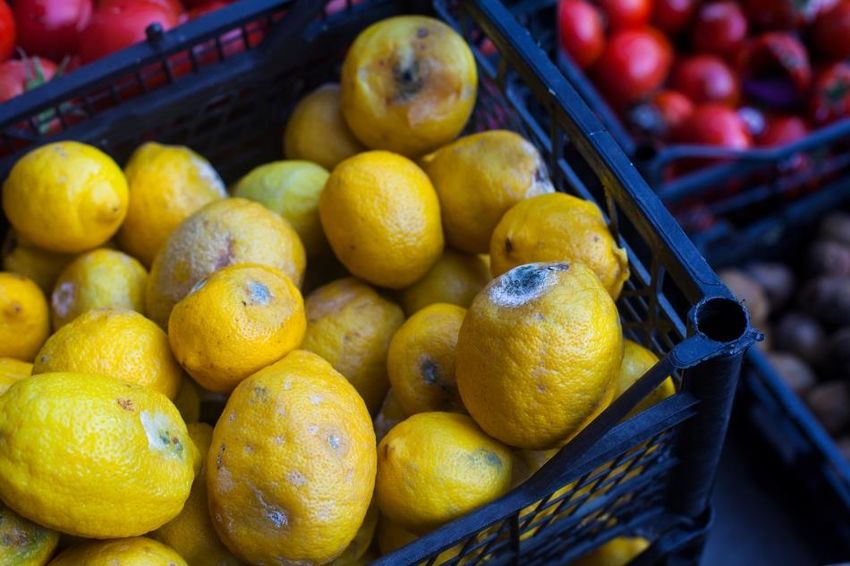
Up to 50 percent of fruits and vegetables
produced in developing countries are lost in the
supply chain between harvest and consumption.
It can take up to 50 litres of water to produce an
orange. Losses in fruits and vegetables represent
a waste of increasingly scarce resources such as
soil and water.
Significant quantities of fruits and vegetables that
are perfectly fit for consumption are wasted
along the food system because of aesthetic or
physical irregularities.Food losses and waste About 1/3 food produced is lost or wasted 1.3 billion tonnes per year One trillion USD per year Resources used to produce it are lost Much higher waste per capita in industrialized countries 95-115 kg/year in Europe and North America 6-11 kg/year in Sub-Saharan Africa, S SE Asia
SDG 12.3 By2030, halve per capita global food waste at the retail and consumer levels and reduce food losses along production and supply chains, including post-harvest losses.
FAO. 2011. Global food losses and food waste – Extent, causes and prevention. Rome
FAO. 2011. Global food losses and food waste – Extent, causes and prevention. Rome
Food loss and waste by region:
from production to consumption
                         Production              Handling and Storage    Processing             Distribution and Marketing            Consumption

                                                                                                                                                              5
                                                                                                                                     13
                                                                                                                                                             12
                                                                                                            28
                                                                                 34
                                                                                                                                     14                       7
                                      45
                                                             52
         61                                                                                                                           4
                                                                                                            16
                                                                                 18                                                                          37
                                                                                                            6
                                      12                                                                                             37
                                                             9                   4
                                       3
                                                             5                                              22
          7                                                                      21
          9                           23                     12
          6                                                                                                                                                  39
                                                                                                            28                       32
                                                             23                  23
         17                           17

N O R T H AM E R I C A     I N D U S T R I AL I Z E D     EUROPE        N O R T H AF R I C A,      L AT I N AM E R I C A   S O U T H AN D S O U T H   S U B - S AH AR AN
 AN D O C E AN I A                  AS I A                                 W E S T AN D                                          E AS T AS I A             AF R I C A
                                                                         C E N T R AL AS I A

                                                                                                    FAO. 2011. Global food losses and food waste – Extent, causes and prevention. Rome
Percentage of food lost or wasted
by region
42
25
22 23
19
17
15
NORTH AMERICA INDUSTRIALIZED EUROPE NORTH AFRICA, LATIN AMERICA SOUTH AND SOUTH SUB-SAHARAN
OCEANIA ASIA WEST AND CENTRAL EAST ASIA AFRICA
ASIACauses
Food losses
financial, managerial, technical limitations in
harvesting techniques, storage, cooling facilities,
infrastructure, packaging and marketing systems
Food waste
Consumer behavior, quality standards, bad purchase
planning, relatively low priceFood loss from post-harvest to
distribution in 2016
Source: FAO, SOFA 2019Causes of pre-harvest losses,
selected crops and countries
Source: FAO, SOFA 2019POST-HARVEST LOSSES IN BULK-PACKAGED FRUITS
AND VEGETABLES TRANSPORTED FROM RURAL TO
URBAN CENTRES IN SOUTHERN ASIAN COUNTRIES
Source: FAO, SOFA 2019PERCENTAGE OF VITAMIN A-DEFICIENT CHILDREN UNDER FIVE
WHOSE DEFICIENCY COULD THEORETICALLY BE SATISFIED
THROUGH FOOD LOSS REDUCTIONS, BY COUNTRY AND FOOD
PRODUCT
Source: FAO, SOFA 2019Environmental footprint of food loss
and waste: carbon, water, land
Source: FAO, SOFA 2019
Tonnes CO2 emitted Cubic meters HectaresMAIN RESULTS OF FAO’S FOOD
WASTAGE FOOTPRINT STUDY, 2013
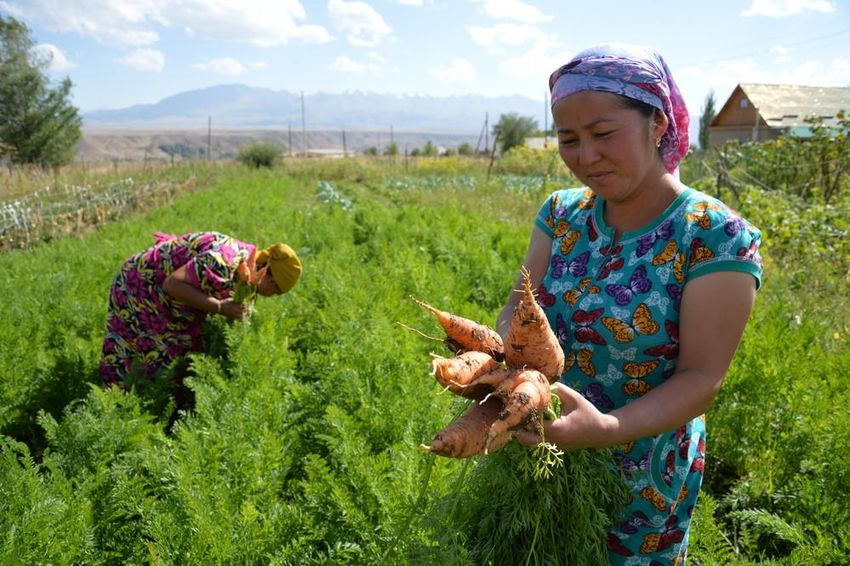
Source: FAO, SOFA 2019Neglected and underused crops
(orphan, underutilized, niche)
Domesticated plant species used for centuries or more for their
food, fibre, fodder, oil or medicinal properties
little attention from research and conservation initiatives and are
poorly documented by production statistics
limited germplasm available;
lack of technical information;
lack of national policy;
lack of interest by researchers, agriculturists and extension workers;
lack of producer interest.
Source: FAO, SOFA 2019 three crops - maize, wheat and rice - account for about 50% of the
world's consumption of calories and protein
95% of the world's food needs are provided by just 30 species of
plants
at least 12,650 species names have been compiled as edible
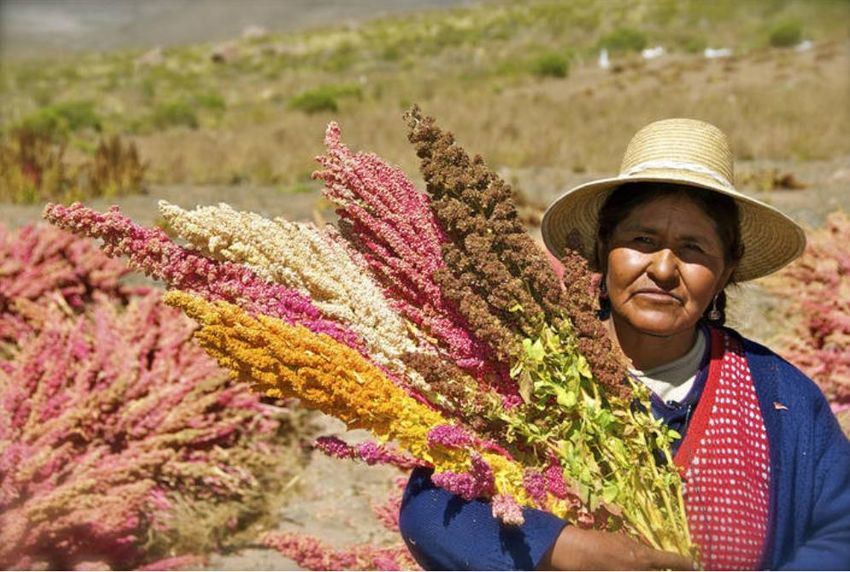
Source: FAO, SOFA 2019Forgotten Foods
1,097 vegetable species, with a great variety of uses and growth
forms, are cultivated worldwide. We are familiar with < 7% of these
Many traditional vegetables are known to have higher nutritional
value than their commercial counterparts, and are well-adapted to
local conditions, exhibiting resistance to drought, pests, diseases
and marginal soil conditions. For example, the Mesoamerican shrub,
the Mayan spinach (Cnidoscolus aconitifolius) contains exceptional
levels of protein, vitamin C and iron, and provides leaves year-round
with little water and in poor soil conditions
Source: FAO, SOFA 2019Thank you
Source: FAO, SOFA 2019
You can also read