Future-oriented Transmission Concepts for E-Mobility - How PM can advance NVH behavior and Efficiency in modern E-Mobility transmissions - IKA ...
←
→
Page content transcription
If your browser does not render page correctly, please read the page content below
Future-oriented Transmission Concepts for
                   E-Mobility
How PM can advance NVH behavior and Efficiency in modern E-Mobility transmissions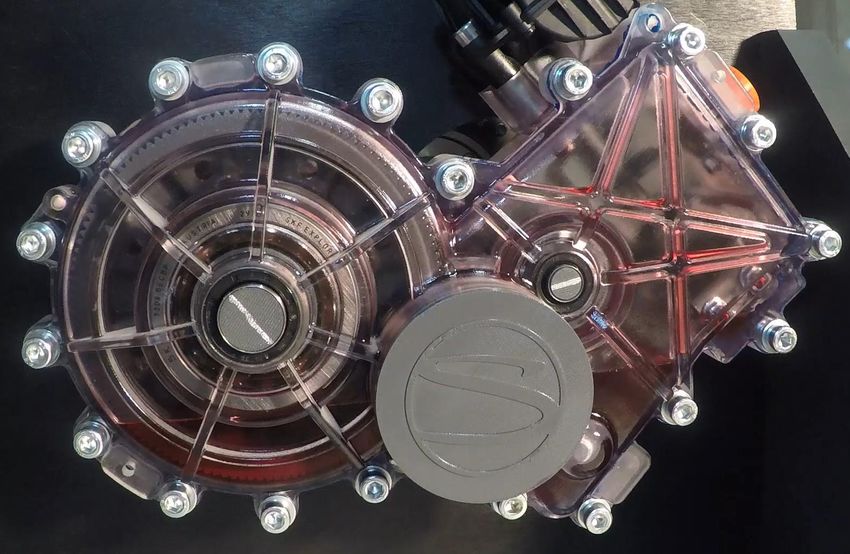
What is Happening to E-Mobility?

Page | 2
What is Happening to E-Mobility?
What about the E-Mobility-Hype?
   What is the current status of E-Mobility?   Why E-Mobility in the first place?

                           TODAY

   Challenges                                  Alternatives to E-Mobility

Page | 3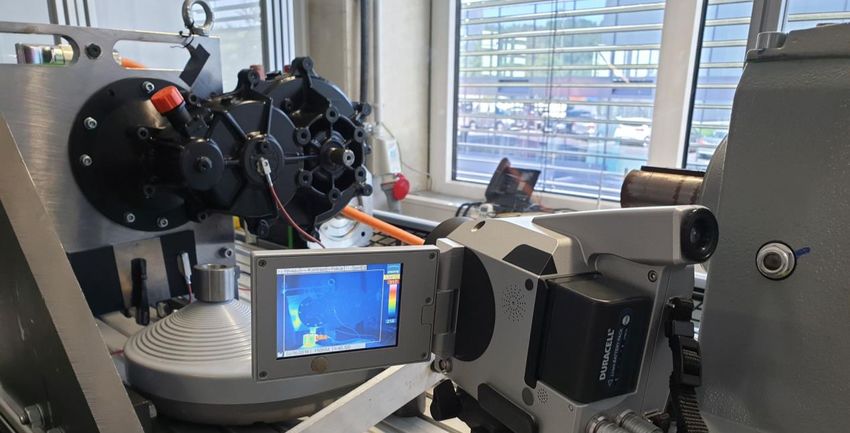
What is Happening to E-Mobility?
What about the E-Mobility-Hype?
What is the current status of E-Mobility? Why E-Mobility in first place?
Volkswagen seems fully invested in quick
transition to E-Mobility solutions (33 billion
Euros investment into E-Mobility between
2020 and 2024)
TODAY
Challenges Alternatives to E-Mobility
Geely “sees the need for co-existence of BMW is banking on plug-in Hybrids rather
electrified ICE and EV for the coming than full-electric vehicles
decades”
Source: drivetrain-symposium, auto-motor-und-sport, Spiegel
Page | 4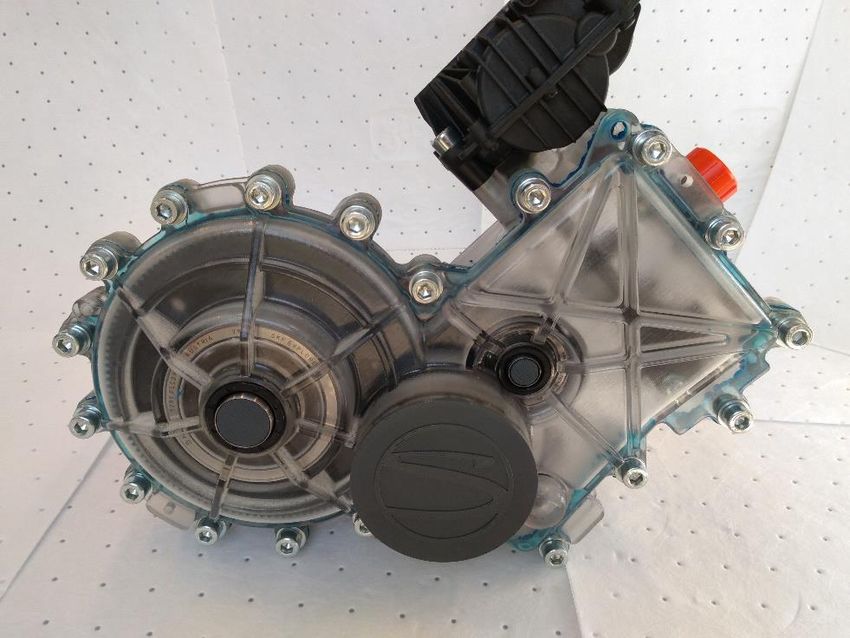
What is Happening to E-Mobility?
What about the E-Mobility-Hype?
What is theand
Legislation current
limitsstatus
to COof E-Mobility?
emissions for Why E-Mobility in the first place?
2
carmakers
TODAY
Challenges Alternatives to E-Mobility
Local emission-free driving CO2-neutral driving if electricity is
generated with renewable energy sources
Page | 5
What is Happening to E-Mobility?
What about the E-Mobility-Hype?
What is the
Charging current status of E-Mobility?
infrastructure Why E-Mobility in first place?
Providing enough renewable energy
Due to the driving conditions, E-Mobility is Exit from nuclear energy generation in
especially favorable in the city. Germany by 2022, reduction of CO2-intensive
Charging infrastructure is especially coal energy production
challenging in the city
TODAY
Challenges Alternatives to E-Mobility
Materials for magnets and batteries
Conditions of mining, scarcity of materials
especially if E-Mobility is to completely replace
ICEs
Page | 6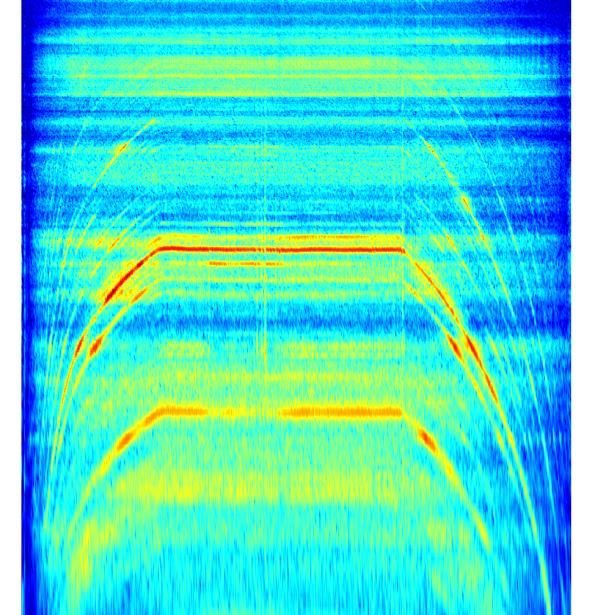
What is Happening to E-Mobility?
What about the E-Mobility-Hype?
Fuel Consumption for Cars with Hybrid, Diesel and Gas Propulsion
What is the current status of E-Mobility? Why E-Mobility in first place?
Percentage of consumers [%]
60 Hybrid (Ioniq Hybrid)
Diesel (Golf TDI)
40 Gasoline (Golf TSI)
20
0 TODAY Alternatives to E-Mobility
Ø: 4.8 l Ø: 6.0 l Ø: 7.1 l
0 50 100 150 200 250 300 350 400
134 g/km 191 g/km 198 g/km
Consumption [x/100 km] – CO2 emission [g/km]
Challenges Alternatives to E-Mobility
Conventional ICEs
(possibly with synthetic fuels)
Fuel cell
(full / plug-in) Hybrid
* 474 g CO2 / kWh for German energy mix 2018
Source: spritmonitor, Umweltbundesamt
Page | 7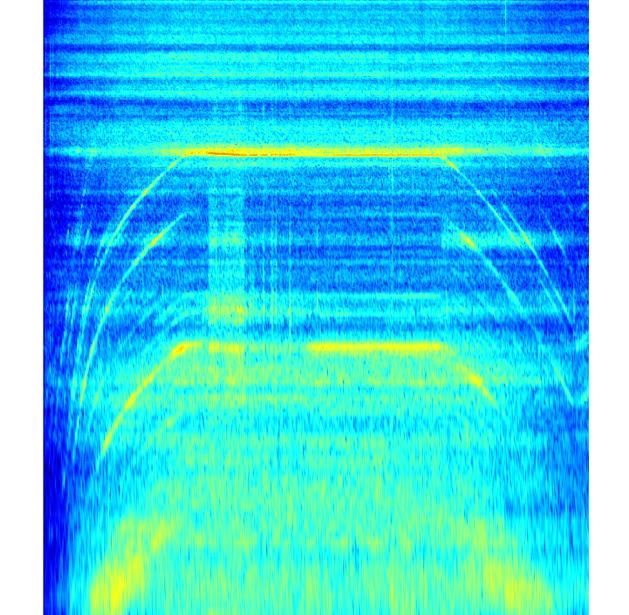
What is Happening to E-Mobility?
What about the E-Mobility-Hype?
Fuel Consumption for Cars with Hybrid, Diesel and Gas Propulsion
What is the current status of E-Mobility? Why E-Mobility in first place?
Percentage of consumers [%]
60 Hybrid (Ioniq Hybrid)
Diesel (Golf TDI)
40 Gasoline (Golf TSI)
Electric (Ioniq Electric)
20
0 TODAY Alternatives to E-Mobility
Ø: 13.9 kWh Ø: 4.8 l Ø: 6.0 l Ø: 7.1 l
0 50 100 150 200 250 300 350 400
66 g/km 134 g/km 191 g/km 198 g/km
Consumption [x/100 km] – CO2 emission [g/km]
Challenges Alternatives to E-Mobility
Conventional ICEs
(possibly with synthetic fuels)
Fuel cell
(full / plug-in) Hybrid
* 474 g CO2 / kWh for German energy mix 2018
Source: spritmonitor, Umweltbundesamt
Page | 8
What is Happening to E-Mobility?
The Future of Transmission Components
What is the current status of E-Mobility? Why E-Mobility in first place?
TODAY
The Future of Transmission Components
We cannot predict the exact product mix for the next decade and beyond
BEV, Fuel Cell and some Hybrid propulsion systems have very similar transmission
Challenges
components Alternatives to E-Mobility
Presentation of concepts by using the example of E-Mobility
Page | 9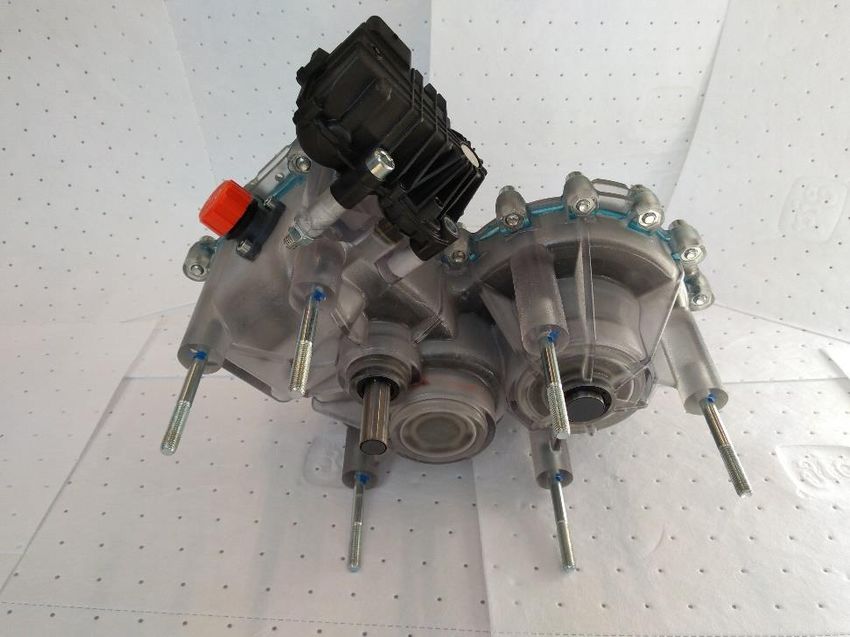
1.      What is happening to E-Mobility?
    2.      Why do we need transmissions for E-Mobility?
    3.      Current transmission concepts for E-Mobility
    4.      Components in E-Mobility transmissions
    5.      pol.E E-Mobility transmission
    6.      Summary and Outlook

Page | 10
Why do we Need Transmissions for E-Mobility? Page | 11
Why do we need Transmissions in E-Mobility Applications?
     Wheel Speed and Vehicle Speed                                                                    Motor Speed and Transmission Ratio

                       2500                                            250                                                   20                                                   20000

                       2000                                            200
                                                                                                                             15                                                   15000

                                                                                                                                                                                          max. motor speed [rpm]
                                                                             Vehicle speed [km/h]

                                                                                                    Transmission ratio [-]
   Wheel speed [rpm]

                       1500                                            150

                                                                                                                             10                                                   10000

                       1000                                            100

                                                                                                                             5                                                    5000
                        500                                            50

                         0                                             0                                                     0                                                    0
                              Twizy 45     i3      I-Pace    Model S                                                              Twizy 45      i3           I-Pace   Model S
                                     Wheel speed   Vehicle speed                                                                        Transmission ratio     Max. motor speed

Page | 12
Current Transmission Concepts for E-Mobility Page | 13
Current Transmission Concepts for BEVs
   Helical gear system                                Single or Stepped Planetary Gear System
  Chevrolet Bolt, Opel Ampera e, BMW i3               Chevrolet Spark, Polestar 2, JLR I Pace

   Double Planetary Gear System                       Chain Drive System
  Porsche Taycan front                                Inmotive

Source: Chevrolet, Polestar, JLR, Porsche, Inmotive

Page | 14
Trend Towards Planetary Gear Systems
Planetary Gear System vs. Stepped Planetary Gear System
   Planetary gear set                     Planetary gear set

      zsun      = 18    i       = 8.67    zsun       = 20       i       = 8.1
      zplanet   = 60    Input: Sun        zplanet1,2 = 17, 34   Input: Sun
      zring     = 138   Output: Carrier   zring      = 34       Output: Carrier

Page | 15
Current Transmission Concepts for BEVs
Advantages and Disadvantages of Different Gear Systems
imax + +++ +++ -
++ +++ ++ ++
- +++ +++ -
++ --- --- +++
η +++ +++ +++ ++
++ ++ ++ /
++ +++ +++ +
BMW i8 Polestar 2 Porsche Taycan Inmotive
+++ very good; --- very bad; / no information
Page | 16Current Transmission Concepts for BEVs
Market Technology Trend in Powertrain for BEV
SOP before 2018: SOP 2018 and later:
95+% 2 stage helical PTS multiple new models apply planetary PTS
Hyundai Kona (SOP: June 2017) JLR I-Pace (SOP: February 2018)
Front: 2 stage helical Front and rear: stepped pinion-planetary
Volvo S90 Twin Axle (SOP: 2017) Audi e-tron (SOP: September 2018)
Rear: 2 stage helical Rear: 2 stage planetary-helical
Front: stepped pinion-planetary
PSA Opel Corsa, Peugeot e-208 (SOP: 2019) Porsche Taycan (SOP: October 2019)
Front: 2 stage helical Rear: two speed planetary-2 stage helical
Front: 2 stage planetary
VW ID3 (SOP: November 2019)
Rear: 2 stage helical Polestar 2 (SOP: 2020)
Front: 2 stage helical Front and rear: stepped pinion-planetary
Ford Mustang Mach-E (SOP: 2020)
Front and rear: stepped pinion-planetary
pol.E Project PM axle Project
Page | 17Components in E-Mobility Transmissions
High PM Content in Future Transmissions
Page | 18Components in E-Mobility Transmissions
Bill of Material Comparison
BoM 2-Stage cylindrical: pol.E 2-Stage planetary: PM-Axle
Pinion shafts 2 0
External gears 2 8
Internal gears 0 2
Shafts 0 1
Carrier 0 2
Bearings 6 11
Differential (body + 4 bevels + Pin) 1 1
Housing 1 1
PM Content by mass ~30% ~30-70%
2 = Parts from PM
Page | 19Components in E-Mobility Transmissions
Production of Components from Powder Metal (PM)
Pressing Sintering
Powder
Powder Blend
Preparation @ up to 1500 ton @Compacting
1120-1250°C
Steel-
Powder
Lubricant
Powder Powder
Blending
Blend MixingPressing Sintering
@ up to 1500 ton @ 1120-1250°C
Post Processing (examples) Sintering
Steel-
Steel PM
Powder hollow carrier
Steel PM
shaft 0.5% C
hollow carrier
CNC Machining Lubricant
Selective Densification shaft 0.5% C
Steel PM
Result of
hollow carrier
shaft 0.5% C
conventional
Heat Treating Welding
sintering
Page | 20Innovative PM Solutions – Planetary Gear Sets
Power Density Innovative PM Carrier Design
Stackpole innovative powder metal
planetary carrier solution
9 Speed AT Carrier
For high-performance automatic
transmission ZF 9HP
A sinter-brazed two piece design of a spider
and copper infiltrated guide plate
Light-weight and feature integrated design
Net shape manufacturing, machining only
needed for pinion holes
Spider Guide Plate Spline
Density [g/cm3] 7.0 7.5 7.5
Tensile Strength 510 730 760
[MPa]
Yield Strength 420 520 760
[MPa]
Conventional PM Copper infiltrated Hardness 80 HRB 90 HRB 50 HRC
microstructure PM microstructure
(6.8 to 7.0 g/cc) (~7.5 g/cc)
Elongation 1% 3% n/a
Page | 21Stackpole Powder Metal Planetary Carrier Technology
Lightweight Design for High Power Density
Requirement Initial Design SI Design
Approach Approach
Improved load Material Aluminum Powder
carrying capacity Metal
Initial through material
customer Hardness 60 HRB 70 HRB
development
design
Density 2.7 g/cc 6.8 g/cc
Reduced machining
ρPM = 2.5xρAl
stock through sinter
Simultaneous brazing and net Yield 217 MPa 420 MPa
image source:
Ford Engineering shaped features Strength
Ultimate 360 MPa 520 MPa
Volume decreased Tensile
by 50% compared Strength
to initial design
approach Weight MAL 1.25xMAL
Stackpole PM
design
VPM = MPM/ρPM = 1.25MAL/2.5ρAL = (1.25/2.5) VAL =
Planetary carrier with
0.5xVAL
integrated clutch hub
Initial design as aluminum die cast carrier failed validation. Stackpole successfully converted into lightweight powder
metal carrier for increased power density to validate for application. PM carrier is launched for high volume serial
production (>1.0 Mn pcs/year).
Page | 22Clutch Plate for 9 Speed Automatic Transmissions
Reduced Stack up & High Strength
Density:
9 Speed AT
Core Density of 6.85 g/cc &
multiple net shape features
providing weight advantage
Bearing
face Surface with density above
7.7g/cc to meet high contact
stresses
Reduced stack height:
A two piece design reduced to
single piece net shape design to
reduce stack height.
Selective densification for bearing High precision manufacturing
face: Core Density of PM 7.7 g/cc
on PM surface:
Density gradient from
Surface Unique material and process
developed to improve PM
Surface, so it stands excessive
axial loads
Page | 23Innovative PM Solutions – High Strength Sprockets and Gears
Stackpole Innovative Sprockets in Serial Production
• Final drive on BorgWarner 800HD • Net shaped OD Spline (as rolled
transfer case operating in the & heat treated)
Hummer H2 awarded by MPIF • Net shaped ID Spline (as heat
treated)
Product Product • Designed to support a minimum
functions features tensile strength of 862 MPa and
minimum yield strength of 828
MPa
• Surface densified to 7.75 • Hub ID for bearing assembly
g/cm³ at outer spline Hardness Machined
(overall density 7.0 g/cm³) • Hub face for perpendicularity to
specifications features ID (0.05)
• Particle hardness 650 HV0.1
min. at 0.04 from surface • Adjacent processes
• Component is low pressure • Bearing assembly (pressing)
carburized & gas quenched
Final
Sinter Tooth Heat Bearing
Blending Compacting Machining inspection
(HTS) Rolling Treatment Assembly
/ Pack
Page | 24Stackpole Engineering Process for High Strength Gears and Sprockets PM Gears Proof of Concept and Validation Running Behavior potential map of Powder Metallurgy (PM) gears Application of PM gear as the 5th gear of a manual transmission Cooperative project between Fiat Chrysler Automobiles, ITA, Embrapii and Stackpole Page | 25
pol.E E-Mobility Transmission
                     Test and Validation

Page | 26
Project pol.E
Proof of Concept for Stackpole Solution to Small BEV Application
Target application pol.E Gearbox
Light (below 450 kg) inter city EVs
Optimization for low noise and high
efficiency
Product Information
2-stage, single speed, parallel axis
Cylindrical gears
Integrated differential
Max. input torque: 33 Nm
Max. input speed: 6000 rpm
pol.E Gear Data
Stage one: z1 = 23; z2 = 79
Reduction ratio Stage 1: 3.43
Stage two: z1 = 29; z2 = 110
Reduction ratio Stage 2: 3.79
Overall reduction ratio: 13.028 Gears and Shafts Application
pol.E Oil Data
600 ml BMW i3 oil
(Hypoid Axle Oil G1 SAE 75W-85)
Twizy Gear Data
Stage one: z1 = 14; z2 = 61
Reduction ratio Stage 1: 4.36
Stage two: z1 = 26; z2 = 80
Reduction ratio Stage 2: 3.08
Overall reduction ratio: 13.407
Page | 27Stackpole R&D and Validation Process
V-Diagram
Design Correlation
Validation
Customer requirement Customer verification
Correlation
Vehicle simulation Optimization Vehicle testing
Correlation
System simulation System testing
Optimization
Correlation
Component simulation Component testing
Optimization
Prototyping
Page | 28Test Bench
Dura45/Func125
Target application Dura45/Func125 test rig (digital and physical)
Functionality testing and durability
testing of low-power transmissions
Product Information
Testing of NVH through vibration
sensors
Testing of Efficiency through torque Dyno speed Torque Test Torque Auxiliary Dyno torque
meter measurement controlled meter gearbox meter gearbox controlled
Temperature measurement
Hardware
Inverter: ANG 410 33A
Motor: BMD 170 45Nm
Controller: Speedgoat
Auxiliary Gearbox C 51 2 P x.x HS B3
o i = 3.3; i = 9.8, i = 30 HiL capable Motor torque/speed curve
Motor Data (BMD 170 45Nm) Virtual
Nominal power = 11.3 kW
Rated torque = 36 Nm
Max. torque = 125 Nm
Stall torque (S1) = 45 Nm
Max. torque Mn = 45 Nm
Nominal speed = 3000 rpm
Max. speed = 4600 rpm Physical
Page | 29Thermal Camera Tests with pol.E
Test Setup
Test Setup
pol.E Gearbox mounted with
output detached
Face of gearbox is painted black to
avoid reflections from
surroundings
Test Properties
400 ml
Hypoid Axle Oil G1 SAE 75W-85
n = 4000 rpm
Tin = 0 Nm
Recording Properties
InfraTec VarioCAM hr inspect 760s
InfraTec IRBIS 3 Plus 3.0
0,1 fps (1 frame each 10 s)
Sensor auto calibration every 31 s
Page | 30Thermal Camera Tests with pol.E
Result Analysis – Thermal Camera Video
Test Setup
pol.E Gearbox mounted with
output detached
Face of gearbox is painted black to
avoid reflections from
surroundings
Test Properties
400 ml
Hypoid Axle Oil G1 SAE 75W-85
n = 4000 rpm
Tin = 0 Nm
Recording Properties
InfraTec VarioCAM hr inspect 760s
InfraTec IRBIS 3 Plus 3.0 65
Temperature [°C]
0,1 fps (1 frame each 10 s) P1
Sensor auto calibration every 31 s 55
P2
P3
1s in video ≙ 60s in real life 45
P4
35 P5
P6
Heating up Cooling down
25
0 2000 4000 Time s [sec] 10000 12000 14000
Page | 31Component Efficiency
Optimizing Efficiency by Decreasing Oil Amount
Test conditions
pol.E transmission
Input torque = 0 Nm 0
Output detached
Input Torque [Nm]
Hypoid Axle Oil G1 SAE 75W-85 4000
Input Speed [rpm]
Test rig
SIAC Dura45/Func125 3000
Torque Sensor: KTR Dataflex 16/50
2000
Outcome: Reducing input torque
by removing components
(at 4000 rpm) 1000
max 0
0 20 40 60 80 100 120 140
Time [s]
pol.E 600ml pol.E no final drive
pol.E 400ml pol.E no intermediate shaft
pol.E no oil
pol.E no seals input speed
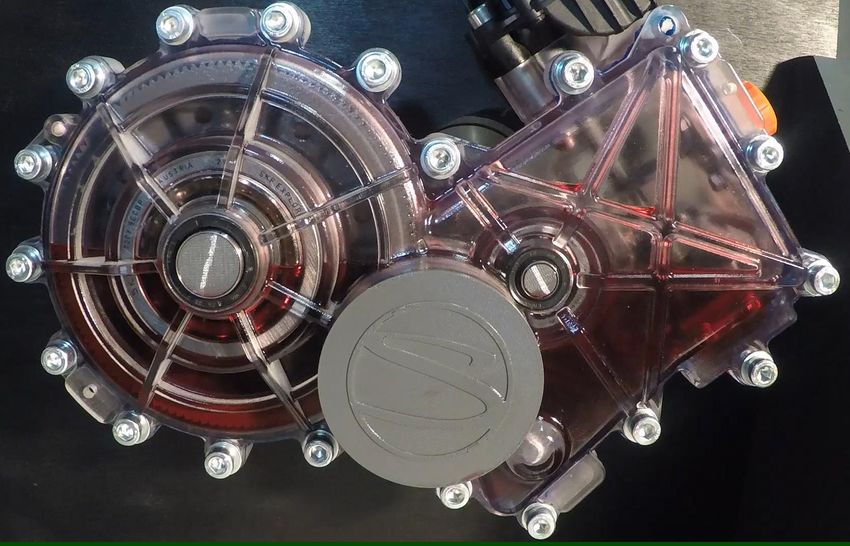
Page | 32Manufacturing of Transparent Housing Housing for Oil Splash Tests Transparent 3D-Printed housing 3D-Printed shafts and gears Real bearings, seals, park lock actuator Integrated mounting screws Page | 33
Manufacturing of Transparent Housing
Lubrication Tests – Preparation

   3D Printing of gears and shafts

   3D Printing of transparent housing

Page | 34
Manufacturing of Transparent Housing
Transmission Fluid Dynamics – Reference Oil Amount
Test Conditions
1 20s ramp
0 – 1000 – 0 rpm
Input torque = 0 Nm
i = 11,5
Reference oil amount
Test rig
SIAC Dura45/Func125
1000
Input Speed [rpm]
500
0
0 10 20 30 40
Time [s]
Page | 35Manufacturing of Transparent Housing
Transmission Fluid Dynamics – Optimized Oil Amount
Test Conditions
1 20s ramp
0 – 1000 – 0 rpm
Input torque = 0 Nm
i = 11,5
Optimized oil amount
Test rig
SIAC Dura45/Func125
1000
Input Speed [rpm]
500
0
0 10 20 30 40
Time [s]
Page | 36pol.E Durability Testing
Approach Aachen City Cycle (ACC) for Durability
Drive data collected via on-board Generation of Load Spectrum
Frequency [%]
diagnostics
15%
Load spectrum defined from the
Vehicle speed [kph]
Frequency
10%
55
torque and speed data within 5%
23
39
Aachen cycle and general driving 0%
-11.31 -4.98 7.68 14.01 20.34 26.67 33
7
Torque [Nm]
conditions Torque [Nm]
Condensing of Data and Generation of Test Cycle
Minimum lifetime: 50.000 km Generation of Test Sequence
Frequency
Classifying and condensing of 15%
drive cycle to fit durability testing
Vehicle speed [kph]
Frequency
10%
55
+
5% 39
23
Application of test cycle in test rig
0% 7
-11.31 -4.98 7.68 14.01 20.34 26.67 33
Torque Torque [Nm]
≙ 50.000 km
Test to success for rated torque
Frequency
Total test time (734 cycles): +
305 hours Torque
4000 40
2000 20 …
Torque
rpm
0 0
Torque
-2000 -20
rpm
-4000 -40
0 Test
500 Time
1000 1500
Page | 37pol.E Durability Testing
ACC Durability Test – Results – Checklist for Disassembly
Check after finalizing the test Gears and Shafts are checked
Oil is drained – Damages
General function is checked – Abnormalities
o Turning by hand
o Leakages Housing is checked
Gearbox is disassembled – Damages
– Abnormalities
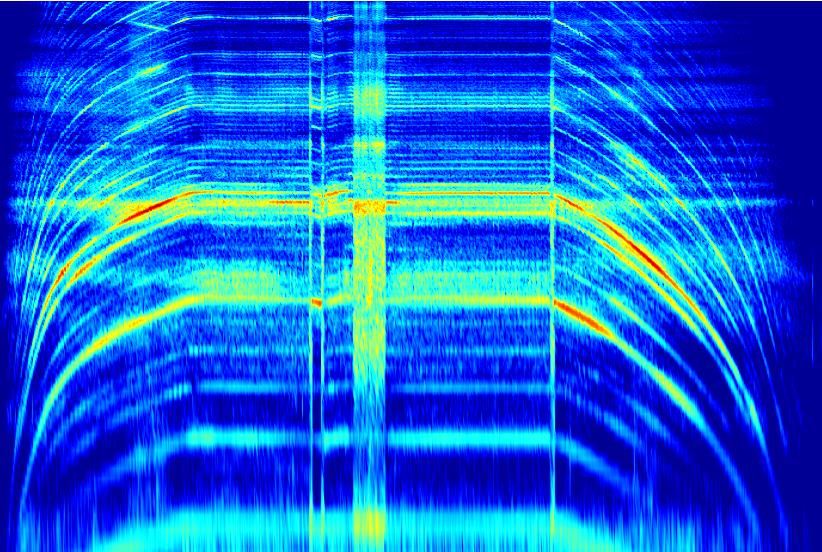
Page | 38Transmission Transfer into Vehicle
Vehicle Natural Frequencies
Test Setup
5000
Sensor placement on the gearbox
2000
Twizy Gear Data
Stage one: z1 = 14; z2 = 61 1266 Hz
Stage two: z1 = 26; z2 = 80 1000
727 Hz
Measurement Equipment
3-Axis accelerometer
SQuadriga 2, Head Recorder 10.0 500
Frequency f [Hz]
Head Acoustics ArtemiS SUITE 10.0
727 Hz Vehicle natural frequencies
200
60
Velocity [km/h]
rel. Altitude
40
100
20
0 5 25 42 47 47 47 47 47 47 41 30 18 5
0 20 Time
40 [s] 60 Speed [km/h]
Page | 39Micro Geometry Design
Influence on Transmission Error
Macro geometry optimization Micro geometry optimization
Weighting parameters: Gear micro geometry optimization for reduction of
Variation of stiffness – NVH transmission error by centering the contact pattern.
Axial force – Cost (Power density)
Weight – Cost (Power density)
Power loss – Efficiency
Selection of gear for minimum stiffness variation along
with other weighting parameters
Optimum solution
0.35
0.3
Input load: 11 Nm Input load: 11 Nm
Change in contact stiffness
0.25 PPTE: 0.1 µm PPTE: 0.08 µm
0.2
Contact pressure : 640 N/mm² Contact pressure : 513 N/mm²
1st order of PPTE: 0.04 µm 1st order of PPTE: 0.04 µm
0.15 2nd order of PPTE: 0.01 µm 2nd order of PPTE: 0.01 µm
0.1
0.05
0
400 450 500 550 600 650 700 750
Axial load [N]
Page | 40Transmission Transfer into Vehicle
Validation Twizy and pol.E on the Road
5000
Test Setup
Twizy pol.E
Sensor placement on the chassis f [Hz]
2000
pol.E Gear Data
Stage one: z1 = 23; z2 = 79
Stage two: z1 = 29; z2 = 110
1000
Twizy Gear Data
Stage one: z1 = 14; z2 = 61
Stage two: z1 = 26; z2 = 80
Measurement Equipment 500
3-Axis accelerometer
SQuadriga 2, Head Recorder 10.0
Head Acoustics ArtemiS SUITE 10.0
60
Velocity [km/h]
rel. Altitude
200
40
0 t [s] 20 40 60 0 t [s] 20 40 60
20
0
0 20 Time
40 [s] 60
Page | 41Summary and Outlook Page | 42
Summary and Outlook We cannot answer how E-Mobility will evolve in the upcoming decades Our concepts with PM components can fit Hybrids (P3, P4) and with individual components also P2 DHT (Dedicated Hybrid Transmissions) Power-split transmissions Transmissions for Fuel Cell vehicles The general requirements for efficiency, durability and power density are similar to those for conventional drivetrains The requirements for NVH are even higher for E-Mobility, than for conventional drivetrains Page | 43
You can also read