GARDA PROPERTY GROUP (ASX: GDF) FULL YEAR RESULTS PRESENTATION | June 2021 - miraqle
←
→
Page content transcription
If your browser does not render page correctly, please read the page content below
GARDA PROPERTY GROUP (ASX: GDF) FULL YEAR RESULTS PRESENTATION | June 2021
DISCLAIMER

This presentation (Presentation) has been prepared on behalf of GARDA Property Group (GDF or Group or GARDA), comprising GARDA Holdings Limited (GHL) and its controlled entities and GARDA Capital Limited (ACN 095 039
366) (AFSL 246714) (GCL) as responsible entity of the GARDA Diversified Property Fund ARSN 104 391 273 (the Fund). The information and statements in this Presentation were prepared or are made only as of the date of this
Presentation, unless otherwise stated.

This Presentation contains general and summary information about the current and currently proposed activities of GARDA. It does not purport to be complete or contain all information which would be relevant to GDF stapled securities,
or existing or prospective investors of GARDA. Other than as required by law, no member of the Group or any of their related entities and their respective directors, employees, officers or advisers give any warranties in relation to the
statements and information contained in or referred to in this Presentation.

This Presentation has been compiled from sources which GARDA believes to be reliable. However, it is not audited, and is not a prospectus, product disclosure statement or other disclosure document (Disclosure Document) as
defined in the Corporations Act 2001 (Cth) (Corporations Act), and has not been lodged with the Australian Securities and Investments Commission (ASIC). It is not, nor does it purport to be, complete or include all the information that
a disclosure document may contain. Historical financial and other ‘continuous disclosure’ information required by law can be found at the GARDA website www.gardaproperty.com.au and in the financial statements (also available on the
website).

Nothing contained in the Presentation constitutes investment, legal, tax or other advice. It is not an offer of securities, or a recommendation to buy or sell securities in GARDA. It has been prepared for general information only, and
without taking into account the investment objectives, financial situation or needs of individuals. Any existing or prospective investor should not rely on this Presentation, but consider the appropriateness of the information in any product
disclosure statement (PDS) or other public sources having regard to their own objectives, financial situation and needs and seek appropriate advice, including financial, legal and taxation advice appropriate to their jurisdiction. GARDA
does not guarantee any particular rate of return or the performance of the Group, nor does it guarantee the repayment of capital or any particular tax treatment.

This Presentation contains certain “forward looking statements” with respect to the financial condition, results of operations and business relating to the Group. These forward looking statements may involve subjective judgments. The
words “forecast”, “estimate”, “likely”, “anticipate”, “believe”, “expect”, “project”, “opinion”, “predict”, “outlook”, “guidance”, “intend”, “should”, “could”, “may”, “strategy”, “target”, “plan” and other similar expressions are intended to identify
forward looking statements. The forward looking statements are by their nature subject to significant and unknown risks, uncertainties, vagaries and contingencies, many (if not all) of which are outside the control of members of the
Group. Various risk factors may cause the actual results or performance of the Group to be materially different from any future results or performance expressed or implied by such forward looking statements. There can be no
assurance that any forward looking statements are attainable or will be realised. Past performance should also not be relied upon as being indicative of future performance. No representation, warranty or guarantee, whether express or
implied, is made or given by any member of the Group that any forward looking statement will or is likely to be achieved. Except as required by law, GARDA is not liable to release updates to the forward looking statements to reflect any
changes.

A number of figures, amounts, percentages, prices, estimates, calculations of value and fractions in this Presentation are subject to the effect of rounding. Accordingly, the actual calculation of these figures, amounts, percentages,
prices, estimates, calculations of value and fractions may differ from the figures, amounts, percentages, prices, estimates, calculations of value and fractions set out in this Presentation. All references to dollars or $ in this Presentation
are to Australian currency.

To the maximum extent permitted by law, any and all liability in respect of the Presentation (and any forward looking statement) is expressly excluded, including, without limitation, any liability arising from fault or negligence, for any
direct, indirect or consequential loss or damage arising from any loss whatsoever arising from the use of the information in this Presentation or otherwise arising in connection with it. GARDA is listed on the Australian Securities
Exchange (ASX) and all applicable obligations and restrictions contained in (without limitation) the ASX Listing Rules and Corporations Act apply accordingly. The acknowledgements referred to above may be pleaded as a bar to any
claim that any reader may bring.

Persons who come into possession of this Presentation (including through a website) who are not in Australia should seek advice on and observe any legal restrictions on distribution in their own jurisdiction. Distribution of this
Presentation outside of Australia (whether electronically or otherwise) may be restricted by law. Persons who receive this Presentation outside of Australia are required to observe any such restrictions. Failure to comply with such
restrictions may find you in violation of applicable securities laws

                                                                                                                             2                                                                                                                   | 2021 Results Presentation
CONTENTS
INTRODUCTION                                                  4
Overview – Financial | Overview - Property

HIGHLIGHTS                                                    7
Valuations | NTA | Development Acquisitions | Asset Sales |
Leasing

PROPERTY                                                      18
Metrics | Portfolio Overview

FINANCE                                                       21
Capital Management | FFO | Income Statement | Balance
Sheet | Guidance

                                                                                           | 2021 Results Presentation
                                                                   Botanicca 9, Richmond
INTRODUCTION

                                         | 2021 Results Presentation
               1-9 Kellar St, Berrinba
GROUP OVERVIEW
FINANCIAL METRICS

Balance Sheet                                                                                                  Return Profile

                                       $317 Million1                                                                                                   35%
                                       MARKET CAPITALISATION                                                                                           FY21 TOTAL SHAREHOLDER RETURN

                                       $1.45                                                                                                           29%
                                       NTA PER SECURITY                                                                                                FY21 RETURN ON EQUITY

                                       38.4%                                                                                                           5.6%2
                                       GEARING                                                                                                         FY22 FORECAST DPU YIELD

                                       4.1 times                                                                                                       85% - 90%
                                       INTEREST COVER RATIO                                                                                            FY22 FORECAST PAYOUT RATIO

1. Mark capitalisation based on GARDA’s 11 August 2021 ASX closing price of $1.395 per security.
2. Calculated as the FY22 forecast distribution rate of $0.072 per security divided by GARDA’s ASX 1 July 2021 opening price of $1.285 per security.

                                                                                                        5                                                                              | 2021 Results Presentation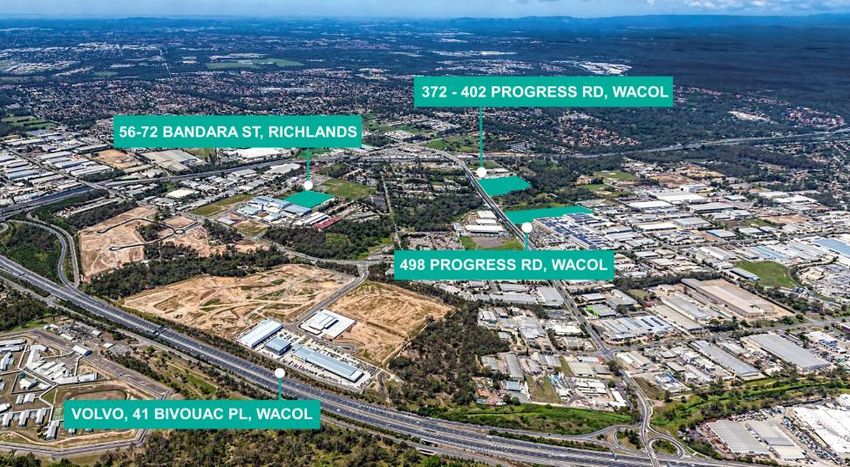
GROUP OVERVIEW
PROPERTY METRICS

Real Estate Platform                                                                                              Portfolio Metrics

                                        $496 Million1                                                                                                        5.5 Years
                                        PORTFOLIO VALUE                                                                                                      WALE

                                        17                                                                                                                   91%
                                        PROPERTIES                                                                                                           OCCUPANCY

                                        ~137,000m²                                                                                                           5.78%
                                        PORTFOLIO NLA                                                                                                        CAP RATE

                                        ~160,000m²                                                                                                           3.2%
                                        ‘BUILD TO OWN’ DEVELOPMENT PIPELINE GFA                                                                              FIXED ANNUAL RENT INCREASES

1. Pro-forma portfolio value totals $491 million. The value excludes Lytton ($10.7m and held for sale), valued accretive capital expenditure ($2.8m) and a small land parcel in Townsville ($1.2m). It includes
Richlands acquisition ($6.8m) due to settle in September 2021 and the third site of the Pinnacle East land acquisition ($2.8m) that settled in July 2021. All property portfolio metrics are based of the pro-forma
portfolio.

                                                                                                          6                                                                                                   | 2021 Results Presentation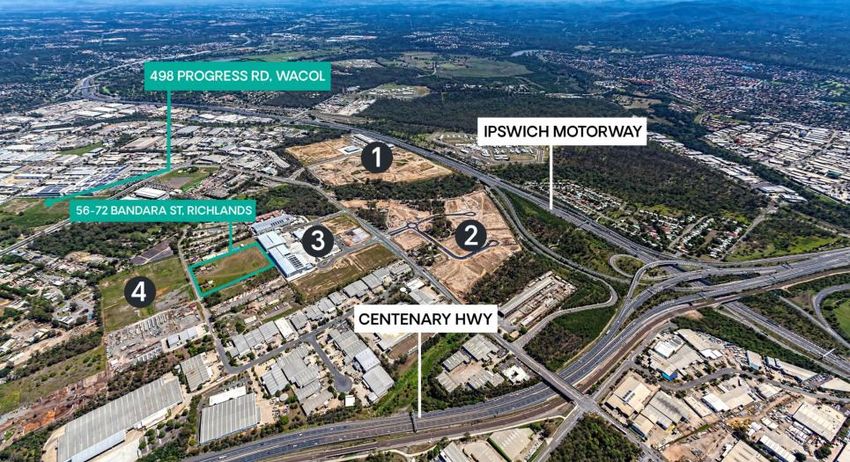
FY21 HIGHLIGHTS

                                            | 2021 Results Presentation
                  41 Bivouac Place, Wacol
HIGHLIGHTS
KEY OPERATIONAL OUTCOMES - FY21

      Increase in Property Valuations                 ‘Build to Own’ Development Pipeline

      $56.0m | 22%                                    ~160,000m²
      VALUATION UPLIFT                                INCREASED BY 124,000m²

      $30.6 Million Proceeds from 3 Asset Sales       Active Management - Leasing

      14% Premium                                     26,160m² | 19%
      TO BOOK VALUE                                   NLA LEASED OR PRE-COMMITTED

                                                  8                                         | 2021 Results Presentation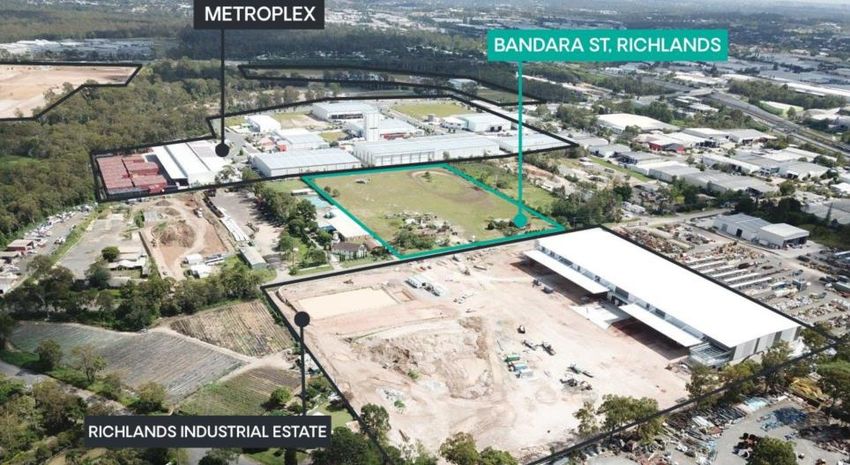
PROPERTY PERFORMANCE
22% INCREASE IN INDEPENDENT VALUATIONS

             $56.0m                                                5.78%
             VALUATION UPLIFT                                      CAP RATE

  ▪   GARDA’s active management, in conjunction with continued strong market fundamentals drove a $56.0
      million valuation increase.
  ▪   As a result of the revaluations, NTA per security increased $0.25 per security, or 21%, to $1.45 per
      security.
  ▪   The North Lakes acquisition was revalued in June 2021 resulting in a $4.0 million increase on its
      acquisition price of $16.0 million.
  ▪   The independent valuation program included nine of GARDA’s 16 investment properties.
  ▪   The portfolio weighted average capitalisation rate (WACR) compressed 65 basis points to 5.78%.
  ▪   The commercial WACR is 5.96% and industrial is 5.56%.
  ▪   Since the April valuations, a number of market transactions indicate strong tailwinds, signalling
      continued higher growth in asset prices.
  ▪   GARDA intends to revalue portfolio assets again in October 2021.

                                                                                                             7-19 Lake St, Cairns

                                                                                       9                                            | 2021 Results Presentation
NET TANGIBLE ASSETS
REVALUATIONS RESULTED IN A 23% INCREASE IN NTA PER SECURITY TO $1.45

                         $1.60

                         $1.50                         $0.35                 $0.10

                                                                                                                                $0.02                $1.45
                         $1.40                                                                        $0.01
  NTA ($) per Security

                         $1.30

                         $1.20

                                   $1.18

                         $1.10

                         $1.00
                                 30-Jun-20   Net gain in fair value of   Capital works           Acquisition costs   Interest rate swap positive   30-Jun-21
                                             investment properties                                                            movement
                                                                                Fall      Rise

                                                                                     10                                                                        | 2021 Results Presentation
‘BUILD TO OWN’ INDUSTRIAL DEVELOPMENT PIPELINE
INCREASED BY 124,000m² DURING FY21
INDUSTRIAL DEVELOPMENT PIPELINE GFA DELIVERY
North Lakes (new) 98,000
Wacol (new) 13,000
Richlands (new) 13,000
Wacol Building A 3,000
Acacia Ridge Stage 2 15,265
Wacol Building B 7,830
Acacia Ridge Stage 1B 6,000
Acacia Ridge Stage 1A 6,214
0 20,000 40,000 60,000 80,000 100,000 120,000 140,000 160,000 180,000
(m2)
Under Construction Existing Pipeline New Pipeline Acquisitions
11 | 2021 Results Presentation‘BUILD TO OWN’ INDUSTRIAL DEVELOPMENT PIPELINE
DELIVERY OVERVIEW
Property Property Activity Estimated Duration Comments Start
Value Costs ($m)
($m)
$6m 4 months Pre-committed to Austrans, due for completion Dec
69 Peterkin Street, Acacia Ridge $11.0m 6,214m² warehouse remaining
4th Qtr FY21
remaining 21. Can stand further 6,000m² expansion
38 - 56 Peterkin Street, Acacia Demolition & 15,000m² Site able to be demolished upon completion of 69
$13.2m $16m 12-15 months 3rd Qtr FY22
Ridge warehouse construction Peterkin Street.
8,000m² warehouse
Pinnacle on Progress West - Speculative build or pre-commit. Land value includes
$9.8m construction $6m 6 months 3-4Qtr FY22
498 Progress Rd, Wacol balance land for 3,500m² Bldg A.
(Building B)
Pinnacle on Progress East - Bulk earth & civil works Pinnacle on Progress East will support 13,000m² of
$7.2m $5m 6 months 3-4Qtr FY22
372-402 Progress Rd, Wacol - 4ha GFA. Construction possible in FY23.
~15,000m² warehouse 3ha site due to settle in Sept 21. Speculative build or
56-72 Bandara St, Richlands $6.8m $15m 9-12 months 3-4Qtr FY22
construction pre-commit.
109-135 Boundary Road, North Bulk earth & civil works Site will yield 22.5ha of land, supporting 98,000m² of
$20.0 $20m 9-12 months 4th Qtr FY22
Lakes - 32ha GFA in the future.
$68.0m $68m
12 | 2021 Results PresentationACQUISITIONS
3 X INDUSTRIAL DEVELOPMENT SITES
109-135 Boundary Road, North Lakes
North Lakes is positioned to provide ready connectivity to major business centres
and national road, air and rail networks. Situated alongside the Bruce Highway / M1
and near the Gateway Motorway, the subject site sits 32km north of Brisbane’s CBD,
40 minutes drive from the Sunshine Coast and only 22 minutes from both Brisbane
domestic and international airports.
98,000m²
COMPLETED GFA
▪ GARDA acquired the 32.38 hectare land parcel in June 2021 for $16.0 million
(plus costs).
▪ North Lakes has since been independently valued on an ‘as is’ basis for $20.0
million.
▪ GARDA intends to develop a master planned industrial park for small, medium
and large customers.
▪ It is anticipated that all relevant town planning approvals and construction
permits will be received by Q4FY22.
▪ Bulk earth and civil works will then commence and is expected to take
approximately 12 months to complete prior to construction of the industrial
facilities.
▪ On completion of the bulk earth and civil works and allocations for internal roads
and green space, the site will provide 22.4 hectares of net developable
industrial land, delivering a potential 98,000m² of built form GFA.
13 | 2021 Results PresentationACQUISITIONS
3 X INDUSTRIAL DEVELOPMENT SITES
372 - 402 Progress Road, Wacol (Pinnacle East)
Wacol is an established industrial suburb, 21km by road south-west of the Brisbane
CBD. The 4.1 hectare site is located on Progress Road, a major dual lane arterial
road connecting to both the Ipswich Motorway and Centenary Highway (and Logan
Motorway). The site is adjacent to GARDA’s existing site ‘Pinnacle West’.
13,000m²
COMPLETED GFA
▪ GARDA acquired three adjoining land parcels across three settlements for a
total consideration of $7.2 million (plus costs) between May 2021 and July 2021.
▪ The amalgamated site comprises 41,250m² of land that will provide
approximately 13,000m² of GFA when the two planned industrial buildings are
developed.
▪ Development approval for the site is anticipated in the first half of CY2022 with
civil works to be completed in the second and third quarters.
▪ The new site will complement the existing Wacol site with completion of civil
works and commencement of construction expected to align with construction
completion of Buildings A and B at ‘Pinnacle West’.
14 | 2021 Results PresentationACQUISITIONS
3 X INDUSTRIAL DEVELOPMENT SITES
56-72 Bandara Street, Richlands
Richlands is an established industrial suburb, 21km by road south-west of the
Brisbane CBD. Richlands borders Wacol with the same quality access to the
Ipswich Motorway and Centenary Highway, via Progress Rd. The site on Bandara
Street backs onto the Metroplex Westgate industrial precinct.
13,000m²
COMPLETED GFA
▪ The purchase price for the 30,351m² land parcel is $6.8 million (plus costs).
▪ Richlands is due to settle on 23 September 2021.
▪ Bandara Street itself is currently undergoing significant development with
40,000m² of industrial buildings currently under construction.
▪ Bandara Street is not an arterial road and therefore provides a price
competitive site with excellent access to various road networks, ideal for
competing for pre-commit tenants.
▪ The site is flat and development ready with negligible preparation costs
anticipated.
▪ On completion, the site is expected to deliver approximately 13,000m² of GFA.
15 | 2021 Results PresentationASSET DISPOSALS
$30.6 MILLION OF CAPITAL RECYCLED AT A 14% PREMIUM TO BOOK VALUES
839 Beaudesert Rd, Archerfield
▪ Archerfield settled on 14 April 2021 for a sale price of $7.0 million, representing
a 12.9% premium to the property's independent valuation of $6.2 million.
▪ Archerfield was acquired in July 2019 as part of a portfolio of established
industrial assets. The other three assets located at Acacia Ridge are at varying
stages of re-development.
154 Varsity Pde, Varsity Lakes
▪ Varsity Lakes settled on 4 May 2021 for a sale price of $12.6 million,
representing a 5.0% premium to the property's independent valuation of $12.0
million.
▪ GARDA had previously indicated it intended to sell the small commercial office
asset.
▪ At settlement, the building was 60% occupied (by gross income) with a
relatively short WALE of 2.0 years.
142 Benjamin Place, Lytton
▪ Lytton is under contract for $11.0 million, representing a 26.1% premium to the
property’s independent valuation of $8.725 million.
▪ GARDA is currently completing a rectification works program.
▪ Settlement is due to occur in September 2021.
16 | 2021 Results PresentationLEASING
26,160m² LEASED, REPRESENTING 19% OF NLA
▪ 26,160m² has been leased or pre-committed since July 2020, representing 19% of current portfolio NLA.
• 11,694m² of leasing at completed industrial developments located at Berrinba and Wacol (Pinnacle West - Bldg C).
• 6,214m² of finalised pre-committed leasing at Acacia Ridge stage 1A.
• 8,525m² of established office leased / finalised.
▪ Following long term leases in Cairns to Civil Aviation Safety Authority (CASA) and Queensland Government, represented by Housing and Public Works, Cairns occupancy has increased to
95% (from 88% at 31 December 2020) with a 4.7 year WALE.
▪ Following a number of leases commencing at Botanicca 9 (Melbourne), the asset is now 46% occupied with 4,260m² being actively marketed for rent.
▪ Limited FY22 expiry with an additional 5,587m², or 5% of portfolio gross income, becoming available. 4,465m² of this expiry is Austrans’ current tenancy at 38 Peterkin St, Acacia Ridge.
▪ Austrans has pre-committed to Stage 1A of the Acacia Ridge development and its soon to expire 4,465m² will then allow GARDA to demolish both buildings at 38 and 56 Peterkin Street
which form Stage 2 of the development.
1-9 Kellar St, Berrinba 7-19 Lake St, Cairns
17 | 2021 Results PresentationPROPERTY PORTFOLIO
| 2021 Results Presentation
Botanicca 9, RichmondTOTAL PROPERTY OVERVIEW
Sector (by Value) Geography (by value) Top 10 Tenants
Tenant Property Gross Income (%)
44% J Blackwoods & Sons Mackay 9.9%
Planet Innovation Box Hill 9.9%
39% Volvo Group Wacol 9.4%
Komatsu Morningside 6.8%
48% Golder Associates Richmond 6.5%
7%
Pinkenba Operations Pinkenba 5.7%
31%
Qld Gov (DTMR) Cairns 5.3%
18%
13% Fujifilm Botanicca 9 5.1%
Fulton Hogan Botanicca 7 3.7%
McLardy McShane Botanicca 7 3.5%
Cairns Mackay Brisbane Melbourne
Office Industrial Land / Industrial Development Top 10 Portfolio Tenants 65.8%
Lease Expiry (by income)
57%
~137,000m²
PORTFOLIO NLA
12%
9%
5%
9% 8% ~160,000m²
‘BUILD TO OWN’ DEVELOPMENT PIPELINE
Vacant FY22 FY23 FY24 FY25 FY26+
19 | 2021 Results PresentationPROPERTY PORTFOLIO
INTEGRATED, COMMERCIAL AND INDUSTRIAL PROPERTY PLATFORM
20 | 2021 Results PresentationFINANCE
| 2021 Results Presentation
41 Bivouac Pl, WacolCAPITAL MANAGEMENT
STRONG CASH POSITION AND DEBT FACILITY HEADROOM
Key Debt Metrics – 30 June 2021
Total debt facilities $228 million ▪ Strong cash position at 30 June 2021 with $15.5 million in cash.
Drawn Debt $210 million ▪ On 15 June 2021, GARDA secured a $28.0 million increase in its existing
common terms debt facility to a limit of $228.0 million.
Cash $15.5 million
▪ At 30 June 2021, the facility was drawn to $210.0 million, providing a
Weighted average cost of debt (fully drawn) 2.2% further $18 million in headroom.
Weighted average debt duration 1.7 years ▪ GARDA’s fully drawn all in cost of debt has improved slightly to 2.2%.
Hedged debt $100 million ▪ Group gearing is 38.4%.
Weighted average hedge duration 6.6 years ▪ GARDA’s has $100 million in long term interest rates swaps including:
Gearing 38.4% • $70 million for 7 years at 0.81%; and
• $30 million for 10 years at 0.98%.
Participating Lenders Hedge Profile ▪ Positive long term benchmark rate movement since entering these
derivatives in March 2020 has resulted in a $2.0 million balance sheet
asset from interest rate swap mark-to-market.
▪ Strong interest cover ratio of 4.1 times.
▪ GARDA continues to hold 4.2 million ‘treasury securities’ and 14.8 million
56% employee security plan (ESP) securities.
50% 50%
44%
STG ANZ Fixed Variable
22 | 2021 Results PresentationFUNDS FROM OPERATIONS1
2021 2020
$000 $000
Net profit after tax 35,689 5,567
Adjustments for non-cash items included in net profit after tax:
Valuations – (deduct increases) / add back decreases:
Investment properties (50,671) 6,996
Derivatives (3,593) 1,425
Goodwill 33,586 -
Asset disposals – (deduct gains) / add back losses:
Investment properties (881) -
Other accounting reversals – (deduct income) / add back expenses:
Security based payments 740 444
Net lease contract and rental items (644) (730)
Other 60 (14)
Adjustments for one-off items:
Add rental guarantee income2 2,000 -
Add back internalisation expenses - 1,268
Add back capitalised interest relating to development properties - 724
Deduct COVID-19 government grants (119) -
FFO3 16,167 15,680
FFO per security (cents) 7.8 8.2
Distributions 15,017 16,430
Distributions per security (cents) 7.2 8.6
Payout ratio 92.9% 104.8%
Tax Advantaged Distribution Component 77.3% 85.2%
1. FFO (Funds from Operations) is the Group’s underlying and recurring earnings from its operations. It is determined by adjusting statutory net profit (under AIFRS) for certain
non-cash and other one-off items. FFO is not recognised or covered by Australian Accounting Standards and has not been audited or reviewed by the auditor of the Group.
2. GARDA’s purchases of 56 and 69 Peterkin Street, Acacia Ridge on 5 July 2019 included provision for the receipt by GARDA of $2,000,000 in rental guarantees at any time in
the subsequent two years. In accordance with Australian Accounting Standards, this amount was recorded as an asset in GARDA’s FY20 financial statements. In July 2020, 7-19 Lake St, Cairns
GARDA released the rental guarantee into general funds. The Directors consider the rental guarantee to be part of underlying FY21 earnings warranting inclusion in reported
FFO.
3. Pursuant to Australian Accounting Standards, treasury securities and employee share plan securities and the distributions attaching thereto are not included in statutory
accounts. The same approach has been adopted in FY21 by GARDA for the purposes of calculating FFO, requiring an adjustment to FFO reported in FY20.
23 | 2021 Results PresentationINCOME STATEMENT
2021 2020
$000 $000 ❶ Revenue increased by approximately $1.4 million, largely due to:
Revenue • Interest and fees received from debt advisory and loans provided
Revenue from ordinary activities ❶ 30,481 29,116 to external parties ($0.9 million); and
• leases commencing following development, positive leasing
Other income ❷ 243 1,172 outcomes and an increase in recovery income ($0.5 million).
Net gain on sale of investment properties 881 -
❷ Prior comparative period included $0.5 million in litigation proceeds
Net gain in fair value of financial instrument ❸ 3,593 - and sundry income, including:
Net gain in fair value of investment properties 50,671 -
• $0.35 million for tenant make good cash payments that weren’t
Total revenue 85,869 30,288
required to be utilised; and
Expenses • $0.23 million in incentives and guarantees that were held but not
Property expenses ❹ (6,814) (6,368) required to be paid to the purchaser of Murarrie.
Finance costs (3,753) (3,801) ❸ Movement in the valuation of $100 million of interest rates swaps.
Employee benefits expense ❺ (3,308) (1,520)
❹ Increased property expenses following completion of industrial
Corporate and trust administration expenses ❻ (1,748) (2,836) development projects at Berrinba and Wacol.
Internalisation expenses - (155)
❺ Prior comparative period included only seven months of corporate
Depreciation (175) (1,269) employee expenses following the internalisation in November 2019.
Goodwill impairment expense ❼ (33,586) -
❻ Prior comparative period included $1.1 million in fees that are not
Credit loss expense (369) - charged under the new internalised structure.
Security based payments expense ❽ (740) (444)
❼ Impairment of goodwill associated with the acquisition of GARDA
Net loss in fair value of financial instrument - (1,425)
Capital Group in FY20 (the Internalisation).
Net loss in fair value of investment properties - (6,996)
Total expenses (50,493) (24,814) ❽ $0.7 million non-cash expenses arising from security based
payments transactions associated with employee security plan (ESP)
Profit before income tax 35,376 5,474
securities. The prior comparative period only included seven months
Income tax benefit 313 93 of non-cash expenses following the internalisation.
Profit after income tax 35,689 5,567
24 | 2021 Results PresentationBALANCE SHEET
2021 2020
$000 $000
Current assets
Cash and cash equivalents 15,534 20,488 ❶ Industrial property located at Lytton, QLD due to settle in September
Receivables and other assets 3,723 5,291 2021.
Assets held for sale ❶ 10,675 -
Non-current assets ❷ Investment properties increased as a result of:
Investment properties ❷ 485,570 417,447 • $50.7 million fair value increase following independent valuations;
Deposits on investment properties 713 -
• $39.0 million in acquisitions and capital expenditure on properties
Property, plant and equipment 41 54
under construction;
Derivative financial instrument ❸ 2,057 -
Right-of-use assets 270 403 • $18.2 million of investment properties sold;
Deferred tax assets 264 -
• $10.7 million in assets being moved to assets held for sale (as per
Intangible assets - 33,586 note 1); and
Total assets 518,847 477,269
Current liabilities • $5.8 million in capital expenditure on investment properties.
Trade and other payables 3,045 3,338 ❸ Positive $3.6 million mark-to-market movement of $100 million worth of
Contract liabilities ❹ 472 605 interest rate swaps.
Distribution payable 3,754 3,763
❹ Contract liabilities of $0.5 million represent the reversal of tenant rental
Lease liabilities 122 115
pre-payments that have been in cash.
Current tax liability - 2
Non-current liabilities ❺ Non-current borrowings increased by $22.4m during the reporting
Tenant security deposits 246 350 period which assisted in the completion of Wacol construction (Bldg C),
portfolio capital expenditure, acquisitions of North Lakes and Wacol
Borrowings ❺ 209,030 186,653
(Pinnacle East).
Derivative financial instrument ❸ - 1,536
Provisions 78 48
Lease liabilities 130 252
Deferred tax liability - 49
Total liabilities 216,877 196,711
Net assets 301,970 280,558
25 | 2021 Results PresentationGUIDANCE
OUTLOOK FOR FY22
Operational Focus
▪ Complete construction of Stage 1A of the Acacia Ridge re-development with Austrans to
commence its pre-commit lease in November 2021.
▪ Advance town planning and receive relevant approvals at North Lakes and Pinnacle on
Progress – East, with planned bulk earths works and civil works to commence in
Q4FY22.
▪ Settle the 30,351m² industrial land acquisition located at Richlands in September 2021.
▪ Continue engagement with potential pre-commit tenants for Richlands and Wacol (Bldg
B – Pinnacle West).
▪ Continue to focus on leasing the remaining 4,260m² of commercial office NLA at
Botanicca 9.
Distributions
▪ FY22 distribution guidance of $0.072 per security.
▪ Distributions of $0.018 per security to be paid quarterly.
▪ Expected tax advantaged income of between 50% and 60%.
41 Bivouac Pl, Wacol
▪ At the current ASX trading price of $1.395 per security, reflects a distribution yield of
5.2%.
▪ Full year payout ratio is expected between 85% and 90% of FFO.
26 | 2021 Results PresentationGLOSSARY
DEFINITIONS AND EXPLANATIONS
Item / Term Definition / Explanation
FY22 Forecast DPU Yield Calculated as the FY22 forecast distribution rate of $0.072 per security divided by GARDA’s ASX 1 July 2021 opening price of $1.285 per security.
Gearing Calculated a total assets less cash, divided by, total interest bearing liabilities less cash.
GFA Gross Floor Area.
Lytton 142 Benjamin Place, Lytton which is due to settle in September 2021.
NLA Net Lettable Area.
NTA Net Tangible Assets.
Pinnacle East Three separate parcels of industrial development land acquired and then amalgamated in May, June and July 2021, at 372-402 Progress Rd, Wacol.
Pinnacle West Industrial estate currently under development at 498 Progress Rd, Wacol.
30 June 2021 total property investment assets valued at $496.2m, including Lytton ($10.7m and held for sale), valued accretive capital expenditure
Portfolio Value
($2.8m) and a small land parcel in Townsville ($1.2m).
30 June 2021 Portfolio Value of $496.2m plus Richlands acquisition ($6.8m) due to settle in September 2021 and the third site of the Pinnacle East
Pro-forma Portfolio Value
land acquisition ($2.8m) that settled in July 2021, less Lytton, value accretive capital expenditure and Townsville.
Return on Equity (ROE) June 2021 NTA per security ($1.45) less June 2020 NTA per security ($1.18), add FY21 distributions ($0.072), divided by June 20 NTA per security.
Richlands 56-72 Bandara Street, Richlands which is due to settle on 23 September 2021.
30 June 2021 closing ASX security price ($1.285) less 30 June 2020 closing ASX security price of ($1.005), add FY21 distributions ($0.072), divided
Total Shareholder Return (TSR)
by June 2020 closing ASX security price.
WALE Weighted Average Lease Expiry (by gross income).
27 | 2021 Results Presentationw: gardaproperty.com.au e: info@gardaproperty.com.au Level 21, 12 Creek Street, Brisbane QLD 4000 p: +61 7 3002 5300 GPO Box 5270, Brisbane QLD 4001
You can also read