Gas Production from the UK Continental Shelf: An Assessment of Resources, Economics and Regulatory Reform - Oxford ...
←
→
Page content transcription
If your browser does not render page correctly, please read the page content below

July 2019

Gas Production from the UK Continental Shelf:
             An Assessment of Resources, Economics
                              and Regulatory Reform

OIES PAPER: NG 148                         Marshall Hall
The contents of this paper are the author’s sole responsibility. They do not
         necessarily represent the views of the Oxford Institute for Energy Studies or any of
                                            its members.

                                          Copyright © 2019
                               Oxford Institute for Energy Studies
                                  (Registered Charity, No. 286084)

This publication may be reproduced in part for educational or non-profit purposes without special
permission from the copyright holder, provided acknowledgment of the source is made. No use of this
publication may be made for resale or for any other commercial purpose whatsoever without prior
permission in writing from the Oxford Institute for Energy Studies.

                                     ISBN: 978-1-78467-141-9

                           DOI: https://doi.org/10.26889/9781784671419

                                                                                                      i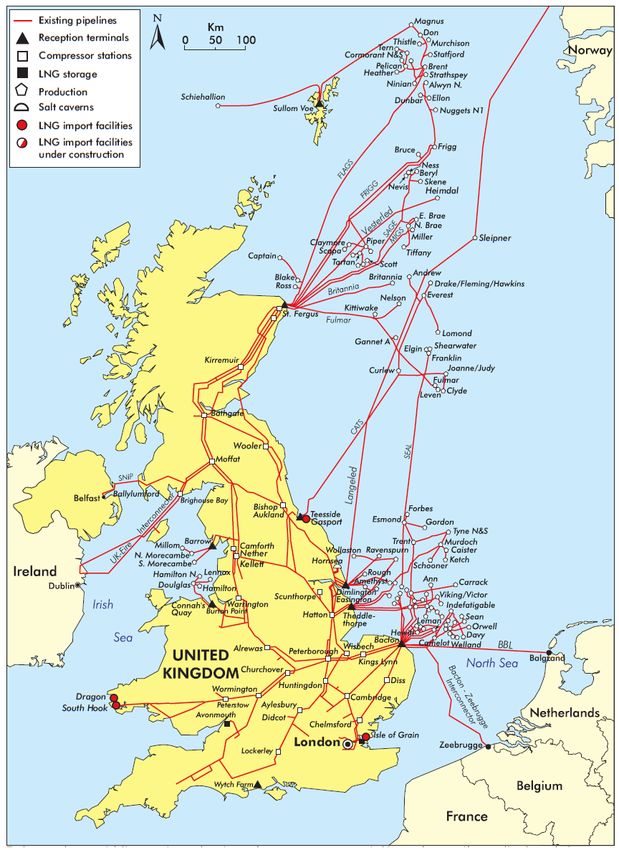
Abstract
The outlook for oil and gas production on the UKCS has improved dramatically since 2015 due to the
industry’s successful commissioning of large-scale projects, its efforts to reduce costs and to improve
its operational performance, the bold reduction in tax rates in 2016 and the adoption in law of a new
statutory objective to achieve the maximum economic recovery of UKCS resources (MER UK). The
new regulator, the Oil and Gas Authority (OGA), has so far acted mainly as a behavioural regulator,
without using its formal regulatory powers, but it has signalled its willingness to intervene more
actively to overcome the obstacles to MER UK. The hard economics of UKCS investment (costs,
prices and taxes) are likely to be the main determinants of future investment and resource recovery
since the UKCS will remain a relatively high-cost producing province. Maintaining a competitive,
stable tax regime and rigorous industry cost control will be essential for MER UK. The OGA may be
able to influence the course of future oil and gas production through prudent use of its powers,
especially in less mature regions such as West of Shetland, but preventing ‘premature’
decommissioning of gas infrastructure in mature areas and the ‘stranding’ of known resources will be
a constant challenge. Promoting a sustained recovery in exploration activity from recent lamentable
levels is perhaps the most urgent task facing the OGA.
An estimated 10-20 billion boe of oil and gas remains to be produced from the UKCS. The improved
industry outlook has led to upward revisions in the last four years of estimates of both future
production and ultimately recoverable resources (URR). However, future production and URR remain
highly sensitive to the course of oil prices, the development of unsanctioned, marginal discoveries and
future exploration in the 2020s. The prospects for UKCS gas production are intimately linked to those
of oil since two-thirds of UKCS gas production is now associated gas. In recent years, UKCS gas
production (41 bcm in 2018) has exceeded short-term projections by the OGA. Following the start-up
of the Culzean field in 2019 and the recent discovery of Glendronach and Glengorm, output is
expected to remain at about 40 bcm per year until 2021 before resuming its long-term decline. Gross
production is expected to fall to about 33 bcm in 2024. The current range of published estimates of
output in 2035 (8-20 bcm) reflects the geological and economic uncertainties over future exploration
and investment rather than conventional cost-based competition with imported gas. MER UK is
compatible with the UK’s ‘net zero emissions’ target in 2050 providing the UKCS does not in future
incur policy-related emissions costs not faced by imported supplies.

                                                                                                      ii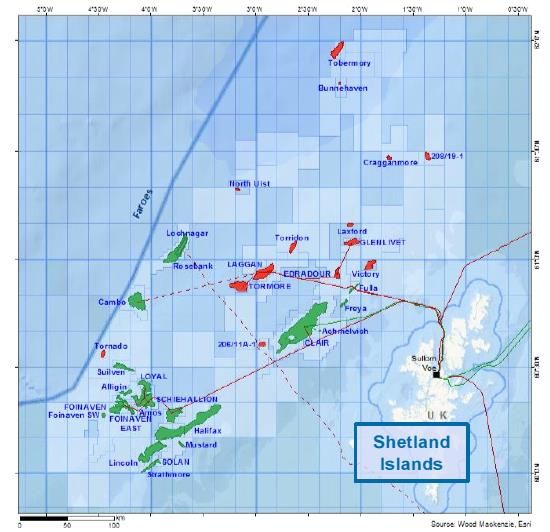
Units of Measurement
mcm        million cubic metres
mcm pa     million cubic metres per annum
bcm        billion cubic metres
bcm pa     billion cubic metres per annum
bbl        barrel (1 cubic metre = 6.29 barrels)
mboe       million barrels oil equivalent
mboe/d     million barrels oil equivalent per day
bn boe     billion barrels oil equivalent
bcf        billion cubic feet
$/mBTU     US dollars per million British Thermal Units
MJ/m3      megajoules per cubic metre

                                                          iii
Contents
Abstract .................................................................................................................................................. ii
Units of Measurement .......................................................................................................................... iii
Contents ................................................................................................................................................ iv
Figures .................................................................................................................................................. iv
1. Introduction ....................................................................................................................................... 1
2. Background: A Short History of UKCS Gas Development ........................................................... 2
3. Gas Production, Offshore Gas Use and the Loss of Swing ......................................................... 6
4. Economics of UKCS Production: Profitability, Costs and Taxation ............................................ 8
5. MER UK, Regulatory Reform and the Role of the OGA ............................................................... 14
6. Projections of Future UK Gas Production .................................................................................... 18
7. Gas Resources and Reserves ....................................................................................................... 22
8. Licensing Policy and Exploration Activity ................................................................................... 27
9. Gas Processing and Transportation Infrastructure .................................................................... 32
10. Gas Production Prospects by Region ........................................................................................ 35
   Southern North Sea (SNS)................................................................................................................ 36
   Irish Sea ............................................................................................................................................ 38
   Central North Sea (CNS) .................................................................................................................. 38
   Northern North Sea (NNS) ................................................................................................................ 39
   West of Shetland (WoS).................................................................................................................... 40
11. Conclusions .................................................................................................................................. 42
Sources and Bibliography.................................................................................................................. 45

Figures
Figure 1: UKCS Oil and Natural Gas Production 1970–2018 ............................................................ 3
Figure 2: UK Natural Gas Production and Gas Demand 1960–2018 ................................................ 4
Figure 3: UKCS Gross Gas Production by Region 2000–2018 ......................................................... 5
Figure 4: Monthly Production of Associated and Dry Gas Jan 2010–Dec 2018 ............................. 8
Figure 5: Indicative Profitability of UKCS Industry 1Q 2000–4Q 2018 ............................................. 9
Figure 6: UKCS Unit Operating Costs (UOC) and Brent Oil Price 2005-18 ................................... 10
Figure 7: Government Tax Revenues from the UKCS 2004–2018.................................................. 12
Figure 8: OGA Projections of UK Net Gas Production to 2035 ...................................................... 19
Figure 9: National Grid’s UKCS Gas Supply Projections (FES 2018) ............................................ 20
Figure 10: Projections of UKCS Oil and Gas Production 2015–2050 ............................................ 21
Figure 11: Projections of Cumulative UKCS Production to 2050................................................... 22
Figure 12: Composition of UKCS Gas Resources 2015-2017......................................................... 24
Figure 13: Cumulative UKCS Gas Production and Remaining Reserves 1973–2017 .................. 24
Figure 14: Distribution of UK Gas Reserves and Resources at End of 2017 ................................ 25
Figure 15: Gas Reserves and Resources by Field Type at End of 2017 ....................................... 26
Figure 16: UKCS Exploration and Appraisal Wells Drilled 1965–2018 .......................................... 29
Figure 17: Exploration and Appraisal Wells Drilled by Region 2000–18 ....................................... 29
Figure 18: Discovered Resource Additions through Exploration 2005–18 ................................... 30
Figure 19: Main UK Offshore and Onshore Gas Infrastructure ...................................................... 31
Figure 20: UKCS Gross Gas Production Projections by Region 2010–2024 ................................ 35
Figure 21: Central North Sea Gross Gas Production 2010–2024 ................................................... 39
Figure 22: West of Shetland Oil and Gas Resources ...................................................................... 41

                                                                                                                                                           iv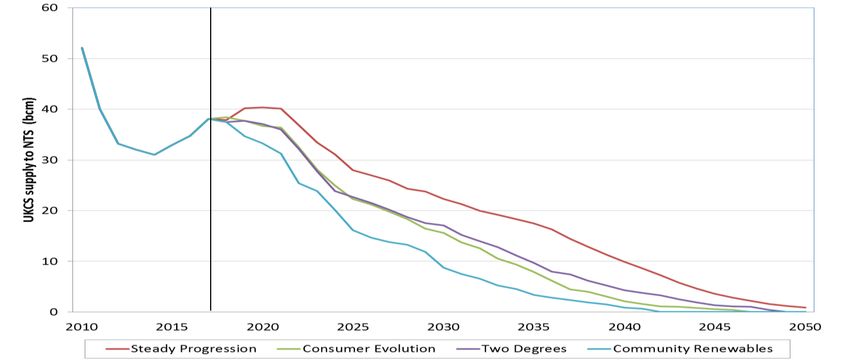
1. Introduction
The UK offshore industry has recently been through an exceptional period of legal and regulatory
reform following the publication in 2014 of the Wood Review on maximising economic recovery (MER
UK) of oil and gas resources on the UK Continental Shelf (UKCS). These reforms established MER
UK as a statutory objective for all UKCS operations and created a new regulator, the Oil and Gas
Authority (OGA), to implement the reforms and to achieve the new statutory objective. They were
accompanied in 2016 by fiscal reforms which reduced tax rates to ensure the UKCS remains
attractive for new investment. The regulatory and fiscal reforms coincided with a period of lower oil
and gas prices which caused severe financial pressure on UKCS producers and supply companies
alike and forced operators to urgently address their cost base. The sharp contraction in discretionary
expenditure in 2015-16 and forecasts of persistently low oil prices led some commentators to
anticipate the imminent end of North Sea oil and gas production, the early decommissioning of
producing fields and the likely failure to recover the 10-20 million barrels oil equivalent (mboe) of oil
and gas estimated to remain on the UKCS. Since then, the outlook has improved significantly.
Between 2014 and 2018, the UKCS industry reduced its unit operating costs by 50% in dollar terms,
assisted by a weaker pound and a 20% increase in total production. By 2017, there were clear signs
of a recovery in investment, project activity and asset acquisition; in late 2018 and early 2019 the
improving outlook was reinforced by two significant gas discoveries, Glendronach and Glengorm.

As the new regulatory regime takes shape and industry activity recovers, we examine the possible
impact of the new statutory objective of MER UK on future gas production from the UKCS. The paper
also assesses whether the OGA’s current projections of gas production to 2035 are plausible and
achievable and examines the risks and issues underlying the projections.

The paper focuses on natural gas, which accounts for more than 40% of total UKCS hydrocarbon
production (1.77 mboe/d in 2018) and about 30% of the remaining proven and probable reserves (5.4
billion boe) and contingent resources (7.5 billion boe). Oil and gas production are intimately linked
and co-dependent in many parts of the UKCS, so the medium-term prospects for UKCS gas
production are closely linked to those of oil. Gas production is distinguished from oil production by its
greater dependence on offshore and onshore infrastructure, the regional nature of gas pricing and the
constant policy debate over security of gas supply, which does not apply to oil in the same way. MER
UK does not differentiate between oil and gas resources but the impact of the new regulatory regime
on future production may not be felt equally by oil and gas.

Section 2 describes briefly the history of the development of the UKCS and long-term production
trends and Section 3 summarises the main features of UK offshore gas use and production; those
familiar with the UKCS upstream industry may wish to skip these sections. Subsequent sections
discuss the key determinants (revenues, costs and taxes) of the economics of UKCS production, the
recent regulatory reforms, the OGA’s projections of future gas production, the gas resource base,
licensing and exploration activity and offshore and onshore gas infrastructure. Section 10 then sets
out the prospects for gas production in each of the five major regions of the UKCS and the last
section sets out the main conclusions of the paper.

The paper draws only on published information, supplemented by interviews with offshore and
onshore operators and the OGA. It does not address the prospects for onshore UK shale gas
production, which may make a modest contribution to UK output in the future if the resumption of
hydraulic fracturing in 2018 produces commercially favourable and environmentally acceptable
results. Nor does it cover the ultimate potential of biomethane, already injected on a small scale into
the GB gas transmission network.

                                                                                                       1
The progressive decarbonisation of the UK economy to 2050 and the role of natural gas, or de-
carbonised gas, in meeting the UK’s 2050 emissions targets is beyond the scope of this paper. So
too is the role that depleted offshore fields may play in future carbon capture and storage projects. In
the short term, gas remains the default marginal fuel for the UK economy, facilitating the continuing
expansion of low carbon sources of energy by providing flexibility and back-up generation capacity, as
well as providing an important degree of national energy supply security. The current position of
natural gas as the largest source in the UK energy mix, accounting for almost 40% of primary inland
energy demand, is attributable largely to the discovery of indigenous natural gas resources on the
UKCS in the 1960s and 1970s. We expect that the future rate of decline of indigenous UKCS gas
production as resources are depleted will influence the role that gas plays in heating, industry and
electricity generation as UK decarbonisation proceeds through the 2020s and 2030s towards the new
net zero emissions target in 2050.

2. Background: A Short History of UKCS Gas Development
Production of natural gas on the UK Continental Shelf (UKCS) began in 1967 when the West Sole
gas field, discovered by BP in 1965, delivered its first gas from the shallow waters of the Southern
North Sea (SNS) to Bacton in eastern England. After the discovery of other large gas fields such as
Leman, Indefatigable and Hewett, it was soon evident that the SNS would be able to meet all UK
demand for natural gas for many years. These fields were developed successively under long-term
supply contracts negotiated with the state-owned Gas Council (renamed the British Gas Corporation
in 1972) which was at the time the sole buyer of gas for the domestic market.1 In the early years of
the offshore industry, gas from the North Sea displaced both town gas manufactured from coal or oil
and smaller volumes of imported natural gas. The development of offshore resources was
accompanied by the expansion by the British Gas Corporation of its onshore infrastructure and the
creation of end-user markets for this new indigenous resource. The process of converting the entire
GB market from town gas to lower-cost natural gas from the North Sea began in 1968 and was largely
completed by 1975. The UK gas market grew from 15 bcm in 1970, mainly of town gas, to 35 bcm in
1975, of which natural gas supplied 33 bcm.2 Total UK gas use continued to expand almost every
year thereafter until it finally stalled in 1987-1990 at about 55 bcm per year.

Exploration success in the SNS stimulated activity in the Central North Sea (CNS) which produced
the discovery of the giant Forties oil field in 1970 and the first production of oil from the field in 1975.
The rise in international oil prices in 1973-74 and 1978-80 provided a huge stimulus to new
exploration and to the development of new oil discoveries in the CNS and the Northern North Sea
(NNS). As offshore activity in the North Sea moved northwards, gas production moved from the
Triassic, Permian and Carboniferous plays of the SNS, where gas discoveries were largely dry with a
high proportion of methane, to the younger Jurassic and Cretaceous age rocks of the CNS and NNS,
where most gas was associated with oil. The first gas produced from the NNS and delivered to the
onshore gas terminal at St. Fergus in Scotland came from the Frigg field in 1977. The first gas from
the CNS was associated gas from the Piper field delivered via the same pipeline. Later, the
development of the huge Brent field underpinned the construction in the FLAGS gas pipeline which
brought its associated gas ashore in 1982 to a new terminal at St Fergus.3 Gas production from the
CNS and NNS lagged that of oil throughout the 1980s since it was constrained by the size of the
growing domestic market for gas and the need to remunerate the cost of construction of new gas
infrastructure to bring associated gas ashore. Gas was discovered in the Irish Sea in 1974 and the
first production of dry gas from the Morecambe South field began in 1985.

1
  ‘The Official History of North Sea Oil and Gas’ (2012) in two volumes by Alex Kemp provides a comprehensive account of the
early development of the UKCS, in particular the negotiation of the early gas contracts.
2
  BEIS historical gas database: gas production and consumption and fuel input 1920-2017, July 2018
3
  ‘The Resurgence of UK Gas Production’, Michael Stoppard, OIES 1994, provides a thorough, concise account of UKCS gas
development and the ’dash for gas’ in electricity generation in the early 1990s.

                                                                                                                           2
Figure 1: UKCS Oil and Natural Gas Production 1970–2018
Source: BEIS, 2019
Since the beginning of production in the CNS and NNS, oil and gas have been closely linked through
the co-production of liquids and associated gas. However, aggregate production of liquids and gas
has followed contrasting patterns, as shown in Figure 1. Oil field development and production were
determined by market economics and short-term revenue maximisation without regard to the
domestic UK energy market since there was no restriction on oil exports. Stimulated by the oil price
rises of 1973-74 and 1978-80, oil production reached an initial peak of 2.7 mb/d in 1985 before falling
back following the collapse in oil prices in 1986 and the sharp contraction of UKCS investment in
subsequent years. Liquids output reached a new peak of 2.9 mb/d in 1999 as new gas infrastructure
allowed the development of large gas condensate fields through the 1990s and the tie-in of
progressively smaller discoveries into existing infrastructure to replace declining output from older oil
fields.
Gas production followed a very different path, dictated by the gradual reform of the onshore UK
markets for gas and electricity. Until the development of the Markham field in 1992, all UKCS gas
production was landed in the UK. Production was constrained between about 1975 and 1990 by the
size of the domestic market, the lack of offshore infrastructure, the British Gas monopsony, the lack of
commercial third-party access to its transmission infrastructure and regulated domestic gas prices
which encouraged producers to pursue oil developments in preference to gas projects. These early
constraints on gas sales often required development plans for fields with both oil and gas resources to
re-inject gas and to defer gas sales; sometimes this led later to sub-optimal hydrocarbon recovery
over the life of producing fields. The influence of traded gas prices on the development and
production of UKCS gas is much less evident than the influence of oil prices on the development of oil
resources.
The UK gas market went through a phased liberalisation in the 1990s as the monopoly position of
British Gas in purchasing, transmission and supply was whittled away between 1988 and 1995 and
third parties gained commercial access to its infrastructure. UKCS producers began to market their
own gas to industrial end-users and power generators and field development decisions gradually
became less dependent on long-term contracts. The ‘dash for gas’ in the newly-privatised power
generation sector raised the domestic demand for gas dramatically (see Figure 2) and accelerated the
development of existing discoveries and new fields. By 1995, the UK market had become acutely
3over-supplied. Spot prices fell below long-term contract prices, putting ultimately unsustainable
pressure on British Gas’s long-term sales contracts and leading producers to search for export
markets in continental Europe. The successful development of the hub gas market at the National
Balancing Point (NBP) of the regulated GB transmission network completed the process of
liberalisation of pricing and marketing of UKCS gas by allowing resource holders to bring their gas to
market more quickly without the need to negotiate long-term contracts. This liberalisation of gas and
power markets and the opening of the Bacton-Zeebrugge Interconnector in 1998 allowed UKCS gas
production to expand rapidly from 48 bcm in 1990 to a peak of 115 bcm in 2000, a year later than the
peak in oil production.
Figure 2: UK Natural Gas Production and Gas Demand 1960–2018
Source: DECC/BEIS annual data
From this near-coincident peak in 1999-2000 until 2013-14, both oil and gas production followed a
very similar path of decline associated with progressive depletion of developed resources, diminishing
exploration activity, very few sizeable new discoveries and a gradual trend towards higher unit
operating costs exacerbated after 2010 by the plateau in oil prices above $100/bbl in 2011-14.
An essential feature of the development of the UKCS oil and gas resources after 1979 was the
absence of any explicit resource management policy dictated by legislation or decided by
government. Exploration and development were conducted within a legislative and fiscal framework
but field development decisions and depletion of resources were determined essentially by market
forces and commercial decisions of the licence holders and operators. The responsible government
department 4 approved individual development projects but relied upon competition for upstream
acreage and commercial behaviour of operators to dictate the pace and timing of resource
development, including the balance between oil and gas. In the case of gas resources, development
of UKCS resources could proceed only through negotiations between mainly privately-owned licence
holders and British Gas, which held a legal monopoly on purchases of gas for the domestic market
until 1982. After the successive privatisations of BNOC/Britoil (1982-85), British Gas (1986) and BP
(1987), the state had no direct or indirect upstream equity participation in the UKCS. The government
4
Department of Trade and Industry (DTI) 1970-2007, Department for Business, Enterprise and Regulatory Reform (BERR)
2007-09, Department for Energy and Climate Change (DECC) 2008-16 and the Department for Business, Energy and Industrial
Strategy (BEIS) 2016-19.
4simply relied upon its energy department to act as the licensor and regulator of offshore operations.
This UK model stands in stark contrast to the development of resources on the adjacent Norwegian
Continental Shelf (NCS) where the state played a direct, determinative role, backed by a stable
legislative framework, from the very beginning in the 1960s.
Figure 3 shows the decline in gas production from each of the main regions of the UKCS from 2000 to
2017 based on receipts of gas at onshore terminals. Output of dry gas from the SNS and the Irish
Sea peaked in 2000 while output of predominantly associated gas from the CNS and NNS peaked
slightly later in 2002-03. The chart shows two periods of accelerated decline in UKCS gas output. The
first occurred in 2004-07 when output from all areas (and almost all major producing fields) fell sharply
due to gradual, and usually expected, depletion at mature fields and very few new projects started
production. This phase of decline was largely anticipated by the industry and prompted investment to
construct new gas import pipelines from Norway (Langeled) and the Netherlands (BBL) and to build or
to expand LNG regas capacity at Milford Haven and the Isle of Grain. The two pipelines started
operations in 2006 and the LNG regas terminals were commissioned in 2008-09.
Figure 3: UKCS Gross Gas Production by Region 2000–2018
Source: UK DUKES data for 2000-2017 and BEIS monthly data for 2018
The second phase of accelerated contraction occurred in 2011-13 when deteriorating asset reliability
and a series of accidents, particularly at gas condensate fields in the CNS, led to an unexpected
decline in gross output to a 30-year low of 37.3 bcm in 2013. It was the emerging picture of poor
offshore operating performance, increasing asset unreliability and falling tax revenues which led the
Secretary of State for Energy, Ed Davey, in June 2013 to commission Sir Ian Wood to undertake his
review of the UKCS industry.
Since 2013, UKCS gas production has recovered slightly to 42.1 bcm in 2017 and about 41 bcm in
2018. This modest rebound is not the result of the Wood Review itself, nor of the creation of the OGA.
It is attributable mainly to remedial work undertaken by operators to restore productive capacity and
reliable operations and the start-up of new fields such as Cygnus (SNS) and the Laggan and Tormore
gas condensate fields west of Shetland in 2016. These fields alone accounted for more than 5 bcm of
production in 2017. The decision in 2010 by Total to develop Laggan-Tormore and to construct the
Shetland Gas Plant to process the gas was a critical step in the development of the UK gas
resources. When production began in 2016, it marked the first time that significant volumes of gas
from fields west of Shetland (WoS) had been brought ashore. Before then, all almost gas produced
5west of Shetland had been used as fuel offshore, re-injected locally or transported via Shetland to the
Magnus field in the NNS for enhanced oil recovery (EOR).5 Since Laggan-Tormore began production,
Total has tied in two other fields, Edradour and Glenlivet, and the recent Glendronach discovery is
expected to add to production from the area delivered to Shetland and St Fergus after 2020.
3. Gas Production, Offshore Gas Use and the Loss of Swing
In 2017, gross production of natural gas in the UK was 42.1 bcm (464.9 TWh). The aggregate figure
comprises 41.9 bcm from 305 offshore fields and 0.2 bcm from 35 small, conventional onshore fields.
Offshore gas production is now dominated by small fields connected via offshore hubs to pipeline
systems; only six fields reported production of more than 1 bcm in 2017.6 Net production of gas in
2017, after deduction of 4.3 bcm used by operators in their upstream operations (‘producers’ own
use’), amounted to 37.8 bcm. Gross production includes producers’ own use but excludes gas re-
injected into reservoirs and gas vented or flared under consents issued by the OGA. 7 Both the
reported aggregate gross and net production figures refer to marketable dry gas meeting the quality
specifications of the onshore transmission network, not the wellhead flows of wet and dry gas which
contain not only methane but also natural gas liquids (NGLs) extracted at onshore gas processing
terminals.8
Gas is produced offshore from a wide range of reservoir types and a huge range of facilities and
infrastructure types, reflecting in part the developments in offshore technology over the last 50 years.
Almost two thirds of gross production (28 bcm in 2017) is estimated to be associated gas produced
from oil fields or gas condensate fields. The remaining non-associated gas (14 bcm) came from dry
gas fields, found mainly in the SNS and Irish Sea. Associated gas is generally separated from liquids
at offshore platforms and transported ashore in dedicated gas pipelines but the development of multi-
phase transportation has permitted in some cases the transportation of both liquids and gas in the
same pipeline. The most common production system in the SNS and Irish Sea is the small steel
platform. Elsewhere on the UKCS, sub-sea tie-backs, usually connected to an adjacent platform, are
the most common system for production of oil and gas and normally have lower operating costs than
fixed platforms.
An estimated 35 bcm of the net production of 37.8 bcm in 2017 entered the onshore National
Transmission System (NTS) operated by National Grid. The only offshore production not to enter the
NTS is the gas from producing fields in the most southerly part of the SNS connected to the Dutch
offshore network (1.2 bcm in 2017) and some deliveries from onshore UK terminals direct to industrial
end-users and power generators. In 2017, gross production included 0.7 bcm of gas from the Rough
field which was granted approval to cease storage operations in 2017 and began to produce the
estimated 4 bcm of the recoverable cushion gas.
Gas produced offshore has three possible uses: as fuel for offshore operations, re-injection into the
source (or adjacent) reservoir or delivery ashore for commercial sale. UK production data record total
use in upstream operations including onshore processing terminals (4.3 bcm) but the data is not
available by field or pipeline system. The total quantity of gas re-injected into producing fields is not
published by BEIS or the OGA. This means that is it not possible to construct even a rudimentary
offshore gas balance for the UKCS as a whole, for particular areas or for individual fields. Unlike
Norway, where reinjection volumes are available by field, offshore flows of gas remain largely
undisclosed on the UKCS. Partial, unverified field data submitted to the OGA show that in 2017
5
From 2003, some gas from west of Shetland oil fields transported to Magnus was re-directed to St Fergus when the Magnus
EOR project was not in operation.
6
The six fields were Britannia, Franklin, Laggan, Rhum, Statfjord and Cygnus.
7
Gross production data exclude gas re-injected into reservoirs, gas vented or flared and occasional unauthorised leaks or
releases. Gas may be flared temporarily at producing facilities and terminals by consent granted by the OGA. In 2017, gas
flared at offshore installations was reported to be 1.39 bcm. The volume of vented gas is not reported.
8
In 2017, NGLs extracted from UKCS production were 3.45 million tonnes (approx. 109 kb/d). The onshore terminals at St
Fergus and Teesside accounted for an estimated 57% of these NGLs.
61.7 bcm of gas was re-injected at producing oil fields, mainly in the CNS and the NNS, or at fields
producing through Floating Production, Storage and Offloading units (FPSOs). These data suggest
that gas re-injection has now become a marginal activity on the UKCS, even in the mature parts of the
CNS and NNS.
Early in the development of the CNS and NNS, the discovery of oil fields with associated gas at a time
of limited gas pipeline capacity and a limited UK gas market led to the enforced re-injection of gas into
producing reservoirs. Similarly, the first oil fields developed west of Shetland in the 1990s were
obliged to re-inject any gas beyond their fuel needs given the restrictions on gas flaring.
Unfortunately, there are no reliable time series data for gas re-injection. As offshore gas infrastructure
developed in the North Sea in the 1980 and 1990s, fewer sources of gas lacked an economic route to
market and gas was subsequently usually produced for sale as soon as possible. Beyond the early
instances of enforced re-injection of gas at oil fields, there have been very few major UKCS fields
where associated gas has been developed and re-injected for the purpose of maximising oil recovery
over the life of the field: Brent and the cross-border Statfjord field were perhaps the most notable
examples. The UK government, as UKCS regulator until 2016, seldom, if ever, gave priority in the
approvals process or its post-approval supervision to the maximising of oil recovery rates by insisting
upon the re-injection of gas in the field development stage. The use of available gas remained
essentially a commercial matter for the resource holder and operator.
Operators on the UKCS are required to submit monthly oil and gas production data to the OGA as
part of the Petroleum Production Reporting System (PPRS).9 Since 2001, aggregate figures for UK
gas production have been based principally on receipts of gas at onshore terminals rather than
wellhead production data by field. PPRS provides monthly data on gas produced from every offshore
and onshore field as either ‘associated gas’ or ‘dry gas’. Data are released after two months, to
preserve company confidentiality, but are often incomplete, inaccurate or subject to major revision
months later. PPRS data are also difficult to reconcile with production data based on terminal receipts
since for most fields the PPRS submissions record wet gas flows. According to PPRS, total UK gas
production in 2017 was 47.4 bcm, comprising 32.2 of associated gas and 15.2 bcm from dry gas
fields. The principal reason for the large discrepancy with the official aggregate gross production
figure of 41.2 bcm is the inclusion of NGLs in the PPRS field data but there also appears to be some
double-counting where gas from one field passes across a platform at another field. The complexity of
offshore and onshore gas transportation and processing arrangements make reconciliation of
aggregate data and field-level PPRS data almost impossible, even for individual gas pipeline
systems.10 Throughout this paper, we use the reported BEIS figures based on terminal receipts for
aggregate and regional gas production and the PPRS data for estimated field production only.
Many of the dry fields of the SNS and Irish Sea were developed in the 1970s and 1980s when British
Gas was the sole buyer of gas at the beach for the UK market. These fields were designed to meet
the seasonal variation in demand but, as the fields were gradually depleted, they were no longer able
to provide the same degree of swing and the seasonal variation in output progressively diminished.
Seasonal variation in demand was met increasingly by storage, notably by the offshore Rough field
which was converted from production to storage in 1985, and later by imports. Field-specific supply
contracts with seasonal swing endured but became increasingly marginal in meeting demand
variations. The last of the major swing contracts for gas, from the then Shell-operated Sean field,
finally expired in 2012-13. Since that time, the observable monthly variation in production at fields
producing both dry gas and associated gas, shown in Figure 4, has been attributable to either
planned maintenance in the summer months or unplanned operational outages.
9
Responsibility for PPRS passed in 2016 to the OGA which has powers to request further information and data on production
from operators. The published data remain of poor quality. In the opinion of the author, more detailed daily data would need to
be available to the OGA to undertake reliable scrutiny of asset stewardship.
10
The OGA is making an effort to improve the poor quality of PPRS data but it remains dependent on operators’ data
submissions to achieve this.
7Figure 4: Monthly Production of Associated and Dry Gas Jan 2010–Dec 2018
Source: OGA’s PPRS database
Figure 4 illustrates the impact of both planned summer maintenance at oil and gas fields and
occasional unexpected events such as the Forties system outage in December 2017 which led to the
shut-in of about 25 mcm/d of gas production from fields in the CNS after a leak from an onshore
liquids pipeline. The effect of other interruptions, such as the serious gas leak at the Elgin gas
condensate field in March 2012 which caused a shutdown of all production from the Elgin and
Franklin fields for 12 months and a production ‘loss’ of 10 mcm/d, can also be seen in the chart. Real
time and daily data available at NTS entry points, such as Bacton, Teesside and Morecambe, that
receive mainly gas from UKCS fields reveal constant small-scale variations arising from unpredictable
fluctuations in field-level flows. For all intents and purposes, outside periods of planned maintenance,
operators seek simply to maximise gas flows at field level and to minimise unplanned downtime.
Operators no longer have the physical or contractual flexibility to modulate gas production or flows to
the NTS and generally cannot do so for commercial advantage. In this respect, gas production on the
UKCS is quite different from operations on the Norwegian Continental Shelf (NCS) where operators
hold some flexibility and commercial discretion over production and pipeline export flows.
4. Economics of UKCS Production: Profitability, Costs and Taxation
The UKCS has always been a highly capital-intensive part of the international upstream oil and gas
industry. In its early years, it provided a proving ground for technological and engineering innovation
in offshore field development. As a relatively high-cost producing province, its profitability has always
been highly sensitive to fluctuations in oil and gas prices. Oil revenues have always provided a
disproportionately large share of total production revenues because of the lower value of gas,
expressed in energy-equivalent terms, compared to oil. Between 1996 and 2018, prompt NBP
averaged just 60% of the value of dated Brent; annual average values were normally in the range 45-
75%. In 2018, oil accounted for 59% of UKCS hydrocarbon production but more than 70% of
estimated total hydrocarbon sales revenues of $38 billion. Since the emergence of a hub gas market
at the NBP in the mid-1990s and the subsequent renegotiation of inflation-linked, fixed-price, ‘legacy’
contracts, almost all gas produced on the UKCS has been sold by producers at NBP-related prices.
8There is still a wide variety of commercial contractual arrangements for the sale and delivery of
UKCS-produced gas but NBP prices or indices determine the basis of gas producers’ revenues just
as BFOE (Brent) prices determine total crude oil revenues.
The Office for National Statistics (ONS) publishes a quarterly index of the profitability of UKCS oil and
gas producers. Its ‘net rate of return’, reproduced in Figure 5, is an accounting measure of profitability
which expresses the operating surplus of UKCS operators before tax as a percentage of capital
employed net of depreciation. It is not a measure of the post-tax return on capital employed (ROCE)
used in the industry to track profitability or the return on investment used in making investment
decisions but it illustrates the trends in UKCS pre-tax profitability. From a low in 2015-16, the index
recovered modestly in 2017-18 as oil prices recovered, UKCS output increased and production
reliability improved. However, this index of pre-tax profitability still stands well below the levels
recorded when oil prices last traded in the range of $50-70/bbl. Other sectoral measures published by
the ONS, such as ‘gross trading profits’ of UKCS companies, record a similar, if less dramatic,
recovery in UKCS profitability from 2015-16 to 2017-18.11
Figure 5: Indicative Profitability of UKCS Industry 1Q 2000–4Q 2018
Source: Office for National Statistics, Profitability of UK Companies, April 2019
There may be transparency over UKCS gas revenues but there is little transparency or uniformity
over the costs of producing gas. The principal reason for this opacity lies in the co-production of oil
and gas on most of the UKCS and the impossibility of reliably allocating shared field, infrastructure
and facilities costs between liquids and gas produced, in many cases, from the same reservoir. The
UKCS is rightly described as a relatively high-cost producing province by international standards even
after the recent phase of cost reduction. The demanding offshore operating environment, tight
environmental standards and the preponderance of numerous small and medium-sized fields means
that unit production costs are considerably higher than in other major gas-producing provinces
supplying NW Europe. Few if any UKCS gas producers could match the low cost of production and
supply from sources such as Russia, Qatar or the US Gulf Coast.
11
ONS, UK Economic Accounts, Gross trading profits of UKCS companies, December 2018.
9Figure 6: UKCS Unit Operating Costs (UOC) and Brent Oil Price 2005-18
Source: OGA, Projections of UK Oil and Gas Production and Expenditure 2018 Report, March 2019
Figure 6 shows the evolution of nominal unit operating costs (UOC) of hydrocarbon production on the
UKCS from 2005 to 2018 and the Brent oil price. The published cost data, expressed for all UKCS
hydrocarbon production, do not identify oil and gas production costs separately. The chart illustrates
the observed link between the prevailing oil price and UKCS operating costs and the gradual trend
towards higher unit costs as developed fields are depleted and production declines. The escalation of
UOC between 2011 and 2014 was particularly acute due to the simultaneous failure to contain costs
in a high oil price environment and the deterioration of operational performance which curtailed short-
term output. This tendency for operating costs for equipment, services and labour to follow oil prices
quickly in the last commodity price cycle served to depress profitability on the UKCS and to make the
industry more vulnerable to the inevitable fall in oil prices when it began in 2014.
Through its efforts to restore profitability and to improve operational efficiency, the UKCS industry
achieved an impressive reduction in unit operating costs (UOC) between 2014 and 2017, as revealed
by the results of the OGA’s Stewardship Survey.12 Total operating expenditure (opex), expressed in
2017 prices, fell from £10.0 bn to £6.7 bn; the accompanying 15% rise in oil and gas production over
these three years ensured a cumulative fall in average unit operating costs (UOC) of 40%. Total
industry employment declined by an estimated 180,000 over the three years. 13 Expressed in dollar
terms, UOC declined by more than 50%, from $31.7/boe in 2014 to just $15/boe in 2017, thanks to
the Brexit-related depreciation of sterling over this period. This rate of unit cost production,
accompanied by an improvement in asset integrity, exceeded even the most optimistic projections
made in 2015 as the industry began its drive to reduce costs. However, as the OGA observed in
projecting a modest 5% increase in UOC in 2018, the recent period of pronounced cost reduction may
now be over. Indeed, in its projections to 2023, the OGA expects unit opex to be broadly flat as total
opex declines at roughly the same rate as total production.
12
UKCS Operating Costs in 2017, OGA, October 2018
13
Total employment attributable to the UKCS (comprising direct, indirect and induced employment) is estimated to have fallen
from 464,000 in 2014 to 280,000 in 2017 according to Oil & Gas UK’s Workforce Report 2018.
10The OGA’s survey reveals the huge range of UOC among producing fields on the UKCS, reflecting
the diversity in the age of individual fields, production facility type and extraction complexity. Almost
one-sixth of fields in the 2017 survey had a UOC of less than $6.50/boe but almost the same number
had a UOC of more than $40/bbl. The OGA’s analysis provides an analysis of total operating costs
by producing region of the UKCS, by infrastructure category (field, pipeline or terminal) and by facility
type (manned or unmanned platform, FPSO or sub-sea tie-back). Field opex, comprising spending
on physical facilities, logistics and administration and wells, accounted for 89% of total UKCS opex,
onshore terminals 9% and pipelines 2%.
The published data do not identify oil costs and gas costs separately and are presented for the five
main producing UKCS regions, but not by field or by pipeline system. Within these limitations, it is still
possible to make some tentative observations. The gas-producing SNS and Irish Sea have a high
proportion of fields that are more than 30 years old and tend therefore to have higher unit opex, but
this seems to be compensated by the high proportion of small manned and unmanned platforms
which tend to have lower costs. The survey’s data also indicate that operators of fields in the SNS
have been better able to resist the recent upward pressure on unit opex than those in the CNS and
the NNS. This may simply reflect the fact that SNS operators did not really benefit from higher oil
prices in 2011-14 and kept costs under better control than other oil-producing regions of the North
Sea. Overall, in 2017, the share of total reported UKCS opex (17%) incurred in the SNS and the Irish
Sea in 2017 was broadly similar to its share of total UKCS output (620 million boe), indicating that the
average operating cost was close to $15/boe or $2.60/mBTU (20 pence/therm). It is not possible to
derive any reliable indication of the cost of producing gas in other areas of the UKCS because of
extensive oil and gas co-production.
The taxation of oil and gas production on the UKCS is notoriously complex and it has been subject to
frequent revision in the past 40 years. Governments sought to recover a ‘fair’ share of the economic
rent in the context of prevailing oil prices at the time while preserving an incentive for operators to
continue to invest. The fiscal regime was for a long time characterised by high marginal rates of tax
on profits (but lower than those in Norway) and extensive capital or investment allowances which
alleviated the incidence of profit-based taxes for those willing to invest in exploration and
development. The frequent changes in taxation had earned the UK an unwelcome reputation for fiscal
complexity and instability among upstream investors by the time the government began a major fiscal
review in 2014. The conclusion of this review led to a sizeable reduction of the tax burden in 2015 and
2016 which has made the UKCS more competitive and more attractive for international investors.
The UKCS fiscal regime comprises three distinct taxes: Ring Fence Corporation Tax (RFCT),
Supplementary Charge (SC) and Petroleum Revenue Tax (PRT).14 RFCT is calculated on company
profits from upstream activities in the same way as mainstream, onshore corporation tax (CT) but
losses from other activities may not be set against profits from the upstream. Profits on which RFCT is
payable may be reduced by 100% first-year capital allowances for capital expenditure on exploration,
appraisal or development. Supplementary Charge is an additional tax charged at the company level
on top of RFCT but without a deduction for finance costs. Profits subject to SC may be reduced by
application of the Investment Allowance or the Cluster Area Allowance. The third tax element, PRT,
is a field-based tax introduced in 1975 which was charged on profits from fields approved for
development before March 1993.
The declared aim of the review in 2014 was to ensure that the taxation of the UKCS was consistent
with the new statutory objective of MER UK and to ensure that the UKCS remained internationally
competitive for new investment. Critically, the conclusion of the review 15 was that the government
needed to reduce the overall tax burden on the UKCS and to ensure that the fiscal regime would be
14
The UK EITI Report for 2016 (April 2018) provides a helpful, simplified summary of the UKCS tax regime.
15
‘Driving investment: a plan to reform the oil and gas fiscal regime’, HM Treasury, December 2014
11more competitive, simple and predictable in the future. These conclusions informed the main changes
to the fiscal regime announced in 2015 and 2016:
the introduction of a UKCS-wide Investment Allowance (IA), replacing the numerous generic
field-based allowances which had been introduced between 2008 and 2013
a reduction, in two steps, in the rate of Supplementary Charge (SC) from 32% to 10% with
effect form 1 January 2016
a permanent reduction in the rate of PRT from 35% to zero, effectively suppressing all PRT
payments while allowing rebates of previously paid PRT for decommissioning
The rate of RFCT was left unchanged at 30%. For non-PRT paying fields, the effect of the changes
was to reduce the headline tax rate from the application of RFCT and SC from 62% (30% plus 32%)
to just 40% (30% plus 10%). For those companies investing sufficiently to utilise fully the new
Investment Allowance and gaining full SC relief, the effective rate of tax would fall to 30%. This
represents the lowest headline and effective rates of taxation in the history of the UKCS. For older,
pre-1993 fields still in production, the headline rate of tax fell from 75% to 40%. The new rate of PRT
was set permanently to zero from 1 January 2016 but was not abolished so that losses arising from
PRT-liable fields could continue to be carried back against past PRT payments. Setting the rate of
PRT to zero meant that all UKCS fields face the same tax rate for the first time since 1982. It should
be noted that in cutting the rate of SC to just 10%, the government’s reforms also cut the value of
available investment allowances. The reform package did not include any specific new allowance or
incentive for exploration but the reduction in tax rates did raise the post-tax value of both existing
resources and future discoveries.
Figure 7: Government Tax Revenues from the UKCS 2004–2018
Source: HMRC, 2019. Revenues and prices are shown for each tax year (April-March).
The annual history of revenues raised from these three taxes since 2004 is shown in Figure 7. 16 The
sharp and unexpected contraction in total tax revenues between 2011-12 and 2014-15 at a time of
high oil prices was attributable largely to the deterioration of offshore reliability, rapidly rising costs
and the increase in capital investment in this period. Total net tax paid was marginally negative in
both 2015-16 (-£2m) and in 2016-17 (-£350m) due to the weakness in oil prices, the reduction of tax
16
Figure 7 excludes licence fee income (£62m in 2017-18). Royalties on production were abolished in 2002-03.
12rates in 2016 and the gradual increase in PRT repayments as older PRT-liable fields such as Brent
were decommissioned. Net tax revenue recovered to £1.2 bn in both 2017-18 and 2018-19. The
consequence of the tax reforms of 2016 is that total government tax revenue has become less
sensitive to changes in oil prices and more dependent on the pace of decommissioning. Net PRT
payments have been negative in the last four tax years (2015-18) and are expected to remain so as
decommissioning proceeds. The OGA estimated in 2018 that the total cost of decommissioning all
UKCS infrastructure would be £45-77bn with a central estimate of £58.3bn at 2017 prices.17 Based
on this central figure, the National Audit Office (NAO) estimates that decommissioning will cost the
government, and indirectly the taxpayer, £24bn in tax repayments and tax forgone through lower
profits. This represents more than 40% of expected total decommissioning costs but the government’s
share is highly uncertain since the range of cost estimates is still very wide.18
Oil and gas are not differentiated in the tax system which bases taxes payable on reported profits
from operations after the application of eligible allowances. It is widely acknowledged that stand-
alone oil projects have usually generated higher pre-tax and post-tax financial returns to investors
than comparable gas projects of comparable resource size, in part because of the higher revenues
per boe generated by oil production. The tax system has seldom fallen equally or equitably on existing
oil and gas producers or on prospective oil and gas developments. The unexpected, last-minute
increase in SC from 20% to 32% in March 2011, designed to raise UKCS tax revenue by £2bn per
year, certainly had a more adverse short-term impact on existing gas producers than on oil
producers.19 This briefly incited calls to recognise the different economics of gas production in the tax
system but the technical and legal difficulties of such tax differentiation proved an insurmountable
obstacle.
Between 2008 and 2013, a series of generic and bespoke allowances were introduced to promote
investment in particular types of fields (e.g. heavy oil fields or high-pressure, high-temperature
(HPHT) fields). This led to growing complexity in the system of allowances, which was corrected by
the introduction of a single UKCS-wide Investment Allowance in 2016. The one allowance which may
be said to favour new gas projects is the Cluster Area Allowance (CAA) which was introduced in 2014
with the expressed aim of promoting development of high-capital cost HPHT gas condensate fields in
the CNS. The Culzean field, due to begin production in mid-2019, was the first such field to take
advantage of this allowance.
The data and reports released by the UK Extractive Industries Transparency Initiative (UK EITI) to
promote tax transparency set out annual payments (or repayments) of RFCT, SC and PRT by
individual companies operating on the UKCS. Reported tax payments are classified by operating
company, not by field, since RFCT and SC are levied at company level. It is not possible from these
published data to reliably compare the underlying profitability of gas-producing operations on the
UKCS compared to those focused on oil production. Annual tax payments may be distorted by
fluctuating patterns of investment, timing effects, operational factors and the sale and purchase of
assets. However, it is notable that some of the highest payments of RFCT and SC in 2017, in
aggregate and per boe produced, were made by companies whose operations are focused on large,
low-cost oil fields like Buzzard and that the gas-oriented producers of the SNS were among the
companies paying less per barrel than the industry average. Once a longer time series of company
tax payment data is available, the trends and differences in profitability and tax payments may
become more apparent.
Recent changes in UKCS taxation have addressed not only the rates of tax payable on profits and
capital allowances against SC but also the transfer of decommissioning tax relief when assets change
hands. After extensive consultation, HM Treasury introduced transferable tax history (TTH) with effect
17
UKCS Decommissioning: 2018 Cost Estimate Report, OGA, June 2018
18
‘Oil and Gas in the UK: Offshore Decommissioning’, National Audit Office, January 2019
19
The tax increase in March 2011 led Centrica to temporarily cease gas production from its operated fields in Morecambe Bay
in the Irish Sea for extended maintenance, as reported in Upstream, 2 May 2011.
13from November 2018 to permit sellers of UKCS oil and gas fields to transfer some of their tax history
to their buyers, thereby allowing buyers of the assets to set some of their future decommissioning
costs against the tax history of the particular assets. Before the reform, tax rules prevented such
decommissioning tax relief from being transferred from sellers to buyers, thereby acting as a potential
obstacle to asset purchases.20 The change does not affect all operators but may be significant in
facilitating the sale and purchase of assets and in assisting in the OGA’s declared aim to put ‘the right
assets in the right hands’.
5. MER UK, Regulatory Reform and the Role of the OGA
The deterioration of the operating and financial performance of the offshore industry in 2011-13
prompted the Secretary of State for Energy, Ed Davey, in June 2013 to ask Sir Ian Wood, a well-
respected figure in the offshore industry, to conduct an independent review of the sector. Its remit did
not include taxation but a fiscal review led by HM Treasury soon followed its publication. After an
interim report and extensive consultation, ‘UKCS Maximising Recovery Review: Final Report’ was
published in February 2014. This became universally known as ‘the Wood Review’.
The report made four main recommendations, all of which were fully accepted by the government.
Government and industry should commit themselves to a ‘new strategy for maximising
economic recovery from the UKCS’ which became known as ‘MER UK’
A new independent regulator should be created and charged with effective stewardship of
UKCS oil and gas recovery and collaboration across the industry
The new regulator should have new powers to pursue implementation of MER UK
The new regulator should work with industry to develop and to implement six ‘sector
strategies’ for exploration, asset stewardship, regional development, infrastructure,
technology and decommissioning.
The report described some of the failings of industry asset stewardship, the excessively competitive
behaviour of some operators and the inadequacies of the existing ‘light touch’ regulatory regime. It
enumerated a number of specific actions to be adopted but in some areas, such as licensing terms,
the report was less prescriptive, leaving options open for further consideration. The report drew
muted criticism from some parts of industry concerned about a more intrusive regulatory regime with
tougher obligations imposed on operators. However, the recent poor performance of the industry and
the evidence presented in the report of the deficiencies of the prevailing regime made the case for the
proposed reform almost unanswerable.
The report reproduced the prevailing estimate at the time that 12-24 billion boe remained to be
produced from the UKCS. It also expressed the view that full implementation of its recommendations
would deliver at least an additional 3-4 billion boe in the following 20 years to 2035, worth an
estimated £200 billion to the UK economy. The incremental volume was expected to come from
several sources (increased exploration, effective enhanced oil recovery (EOR), improved use of
infrastructure and deferral of decommissioning) but the basis of this estimate was not disclosed.
The Government accepted the Wood Review recommendations in July 2014 and moved quickly to
establish the new regulator, to be called the Oil and Gas Authority (OGA), as a successor to DECC
and to prepare for its independent operation. Clauses were included in the Infrastructure Bill requiring
the government to publish the Strategy to achieve MER UK and to establish a levy on industry to fund
an independent OGA. The Infrastructure Act was enacted in February 2015 and the OGA was created
as an executive agency within DECC on 1 April 2015. The legislative proposals to make the OGA
independent and to define its powers and functions were introduced in July 2015 in a new Energy Bill.
In November 2015, the government proposed a draft MER UK Strategy which, after some revisions
20
An Outline of Transferable Tax History, HM Treasury, November 2017.
14You can also read