GATE: Graphic Approach To Epidemiology - 1 picture, 2 formulas & 3 acronyms
←
→
Page content transcription
If your browser does not render page correctly, please read the page content below

GATE: Graphic Approach To Epidemiology

    1 picture, 2 formulas & 3 acronyms   1

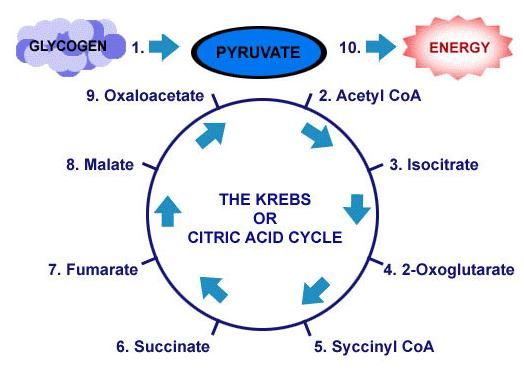
The Krebs Cycle
The GATE frame:
• Graphic Appraisal Tool for Epidemiological
  studies – a framework for appraising studies

• Graphic Architectural Tool for Epidemiological
  studies – a framework for designing studies
Presentation outline

1. a framework for study design
2. a framework for study analysis
3. a framework for study error
4. a framework for practicing EBP

   1 picture, 2 formulas & 3 acronyms
1. GATE: design of epidemiological studies:
       the picture & 1st acronym: PECOT

every epidemiological study can be hung on the GATE frame6
GATE Frame picture
       British doctors

                 smoking status measured

           smokers                non-smokers

                   yes
   Lung cancer
                    no                     10 years

         Longitudinal (cohort) study
Observational studies: allocated by measurement       7
1st acronym: PECOT

         British doctors
                                  P
                                          Population/Participants
                  smoking status measured

        Exposure                            Comparison
              smokers         E       C      non-smokers

Outcomes                yes
Lung cancer                       O                  Time
                        no                    T      10 years

                                                                8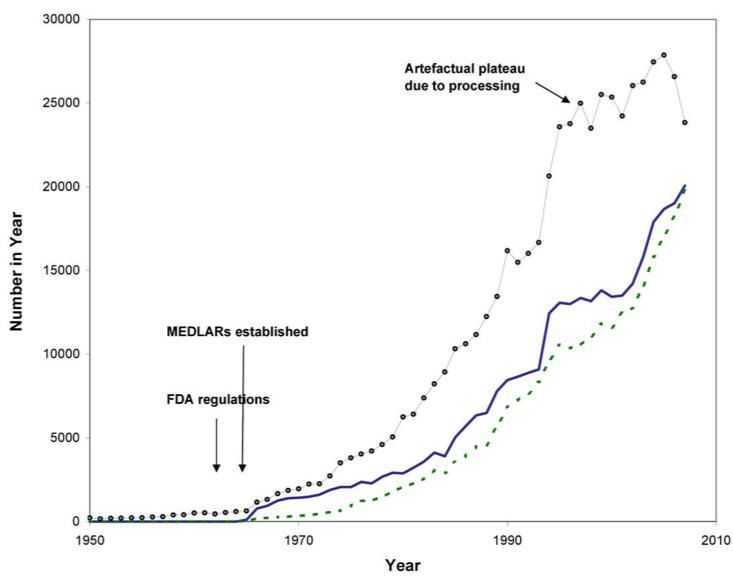
GATE Frame picture & 1st acronym

                              P
        British doctors

      Randomly allocated to aspirin or placebo

             aspirin      E       C   placebo

                 yes          O
  Heart attack
                  no                            5 years
                                       T

      Randomised Controlled Trial
RCT: allocated to E & C by randomisation process          9
GATE Frame picture & 1st acronym

                                 P
Middle-aged American women
              Receive Mammogram screening Test

 Mammogram positive          E       C   Mammogram negative

                   yes
   Breast cancer                 O
                   no                      T

         Diagnostic (prediction) study                   10
GATE Frame picture & 1st acronym
P
Middle-aged Americans
Body mass index measured
overweight E C ‘normal’ weight
yes
Diabetes O
no T
Cross-sectional (prevalence) study
11GATE Frame picture & 1st acronym
P
Middle-aged Americans
Body mass index measured
overweight
obese E1 E2 C ‘normal’ weight
yes
Diabetes pre- O
no T
Cross-sectional study
12GATE Frame picture & 1st acronym
P
Middle-aged Americans
Body Mass Index (BMI) measured
High BMI E C Low BMI
high
Blood glucose O
low T
Cross-sectional study 132. GATE: analysis of epidemiological studies:
the 1st formula: outcomes ÷population
The numbers in every epidemiological study can be hung
14
on the GATE frame1st formula: the Occurrence of outcomes =
number of outcomes ÷ number in the population
British doctors P Participant Population
smoking status measured
Exposed Group* EG CG Comparison Group*
smokers non-smokers
Outcomes yes a b
O Time
Lung cancer no T 10 years
* a Group is a sub-population 151st formula: occurrence = outcomes ÷ population
British doctors
P Population
smoking status measured
Exposed Group EG CG Comparison Group
smokers non-smokers
Outcomes yes a b
O Time
Lung cancer no T 10 years
Exposed Group Occurrence (EGO) = a/EG
= number of outcomes (a) ÷ number in exposed population (EG)
161st formula: occurrence = outcomes ÷ population
British doctors
P Population
smoking status measured
Exposed Group EG CG Comparison Group
smokers non-smokers
Outcomes yes a b
O Time
Lung cancer no T 10 years
Comparison Group Occurrence (CGO) = b/CG
= number of outcomes (b) ÷ number in comparison population (CG)
17The goal of all epidemiological studies is to measure
(& compare) the occurrence of outcomes in
(different) populations (EGO compared with CGO)
P
British doctors
smoking status measured
smokers EG CG non-smokers
10 years
yes
a b
EGO: O CGO:
Occurrence (risk) of no
T Occurrence of cancer
cancer in smokers in non-smokers
Lung cancer
18The goal of all epidemiological studies is to measure
(& compare) the occurrence of outcomes in
(different) populations (EGO compared with CGO)
P
British doctors
Randomly allocated to aspirin or placebo
aspirin EG CG placebo
5 years
yes
a b
O CGO:
EGO: T
no
Occurrence of MI if Occurrence of MI if
taking aspirin Heart attack (MI) not taking aspirin
19The goal of all epidemiological studies is to measure
(& compare) the occurrence of outcomes in
(different) populations (EGO compared with CGO)
P
Middle-aged American women
Receive Mammogram screening Test
Mammogram positive EG CG Mammogram negative
yes a b
O
EGO: T CGO:
Occurrence of cancer no Occurrence of cancer
if mammogram +ve Breast cancer if mammogram -ve
20The goal of all epidemiological studies is to measure
(& compare) the occurrence of outcomes in
(different) populations (EGO compared with CGO)
P
Middle-aged Americans
Body Mass Index (BMI) measured
High BMI EG CG Low BMI
EGO: high CGO:
Average blood glucose O Average blood glucose
in EG low in CG
21
EGO = sum of all glucose levels in EG ÷ number in EGComparing EGO & CGO
• Risk Ratio or Relative Risk (RR) = EGO ÷
CGO
• Risk Difference (RD) = EGO – CGO
• Number Needed to Treat/’expose’ (NNT)
= 1 ÷ RD
its all about EGO and CGO
Measures of occurrence include: risk; rate; likelihood;
probability; average; incidence; prevalence3. GATE: identifying where errors occur in epi
studies: the 2nd acronym: RAMboMAN
Recruitment
Allocation
Maintenance
blind
objective
Measurements
ANalyses
the GATE frame with RAMboMAN can be used to identify
23
risk of error in most/all epidemiological studiesStudy setting
RAMboMAN
Eligible population
recruitment process
P
P
were Recruited participants
relevant to the study objectives?
who are the findings applicable to?
24RAMboMAN: how well were participants Allocated
to exposure & comparison groups?
Was Allocation
to EG & CG
successful?
RCT: Allocated by randomisation Cohort: Allocated by
(e.g to drugs) measurement (e.g. smoking)
EG & CG E&C
EG CG EG CG measures
similar?
accurate?
O O
T T 25RAMboMAN
P
How well were Participants
Maintained in the groups they were
allocated to (i.e. to EG & CG)
throughout the study?
EG CG
Compliance
Contamination
Co-interventions
O
T Completeness of follow-up
26P
RAMboMAN
Were outcomes measured
blind to whether participant
was in EG or CG ?
EG CG
O
T
27P
RAMbOMAN
Were outcomes measured
Objectively?
EG CG
O
T
28P RAMBOMAN
Were the Analyses done
appropriately?
EG CG
Adjustment for confounding
O
T
29P RAMBOMAN
EGA CGA Were the Analyses done
appropriately?
EGC CGC
Intention to treat?
a b
O
T
30the 2nd formula:
random error = 95% confidence interval
EGO ± 95% CI CGO ± 95% CI
There is about a 95% chance that the true value of EGO & CGO (in the
underlying population) lies somewhere in the 95% CI (assuming no
31
non-random error)the 3rd acronym: FAITH Critically appraising a systematic review • Find – were all potentially relevant studies found? • Appraise – were studies appraised for validity? • Include – were only appropriate studies included in the final analyses? • Total-up – were studies pooled appropriately? • Heterogeneity – were studies too heterogeneous (i.e. too different) to pool?
4. GATE : a framework for the 4 steps of EBP
The steps of EBP:
1. Ask
2. Acquire
3. Appraise
4. Apply
[5. AUDIT your practice]
EBP Step 1: ASK - turn your question into
   a focused 5-part PECOT question

                         P
                                 1. Participants

  2. Exposure                     3. Comparison
                     E       C

4. Outcomes   yes
                         O              5. Time
                no                 T
                                                   35
EBP Step 2: ACQUIRE the evidence – use
PECOT to help choose search terms
1. Participants
2. Exposure
3. Comparison
4. Outcome
5. Time frame
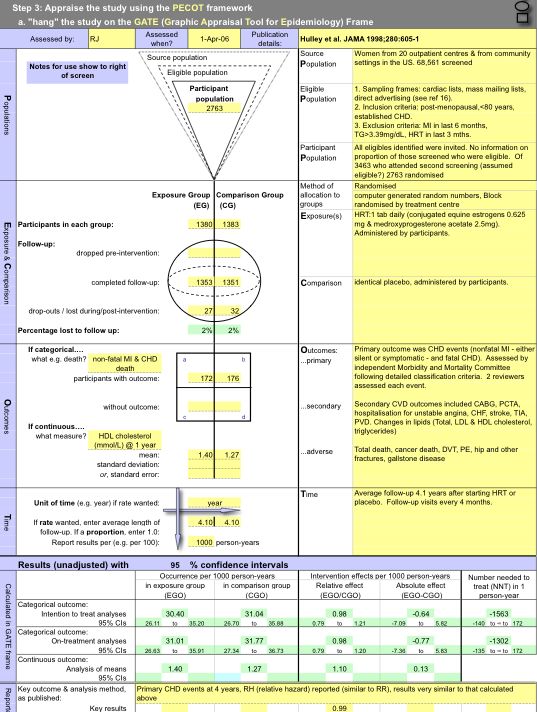
36EBP Step 3: APPRAISE the evidence –
with the picture, acronyms & formulas
P P Recruitment
Allocation
E
Maintenance
C E C
blind
O objective
O
Measurements
T
T ANalyses
Occurrence = outcomes ÷ population
Random error = 95% Confidence Interval 37EBP Step 4: APPLY the evidence by
AMALGAMATING the relevant information &
making an evidence-based decision:’ the X-factor
©X-factor: making evidence-based decisions
Epidemiological
evidence economic
person
family Values & System legal
community
Preferences features
political
practitioner Case
circumstances
X
Practitioner e pertise: ‘putting it all together’ - the art of practice
Clinical expertise in the era of evidence-based medicine and patient choice. EBM 2002;736-8 (March/April)Excel CATs & pdf Gate-lites
There is a GATE for every study design
www.epiq.co.nz
41
& an on-line post-grad course in EBPExtra slides
Why do we need to use evidence
         efficiently?
                                               5,000?
                               2500000
                                               per day
                    YearYear

                               2000000
                 Perper

                               1500000
         Articles

                                                               2,000
 MedicalArticles

                               1000000                        per day
                                                                                     75 per
 Medical

                                500000
                                                                                       day
                                     0
                                         Biomedical   MEDLINE               Trials          Diagnostic?
                                                         EBP: informing decisions with the best up-to-date evidence
The epidemic of evidence
Bastian, Glasziou, Chalmers PLoS 2010 Vol 7 | Issue 9 | e1000326About 1/2 of ‘valid’
evidence today is out of
date in 5 years
About 1/2 of valid
evidence is not
implemented
ScienceCartoonsPlus.comGATE Frame picture & 1st acronym
P
smokers E C non-smokers
smoking status measured
yes cases
Lung cancer O
no controls T
Case-control study
Observational study: allocated by measurement 47GATE Frame picture & 1st acronym
P
Middle-aged American women
Measured with ‘gold standard’ for breast cancer
Breast cancer positive E C Breast cancer negative
positive
Mammogram O
negative T
Diagnostic test accuracy study 48The goal of all epidemiological studies is to measure
(& compare) the occurrence of outcomes in
(different) populations (EGO compared with CGO)
P
Middle-aged American women
Measured with gold standard for
breast cancer
Breast cancer EG CG No breast cancer
EGO: positive a O b CGO:
Likelihood of +ve T Likelihood of +ve
Mammogram if negative Mammogram if no
breast cancer Mammogram breast cancer
491st formula (with time):
occurrence = (outcomes ÷ population) ÷ Time
British doctors
P Population
smoking status measured
Exposed Group EG CG Comparison Group
smokers non-smokers
Outcomes yes a b
O Time
Lung cancer no T 10 years
EGO = (a ÷ EG) during time T (a measure of cumulative incidence)
EGO = (a ÷ EG) ÷ T (a measure of incidence rate) 501st formula (with time):
occurrence = (outcomes ÷ population) ÷ Time
P
Middle-aged American women
Receive Mammogram screening Test
Mammogram positive EG CG Mammogram negative
yes
a b T
O
EGO: CGO:
no
Occurrence of cancer Occurrence of cancer
if mammogram +ve Breast cancer if mammogram -ve
51
EGO = (a ÷ EG) at time T (a measure of prevalence)You can also read