Global Warming's Increasingly Visible Impacts
←
→
Page content transcription
If your browser does not render page correctly, please read the page content below
Global Warming’s
Increasingly Visible Impacts
Global Warming’s Increasingly
       Visible Impacts

              AUTHORS
           Dr. James Wang
          Dr. Bill Chameides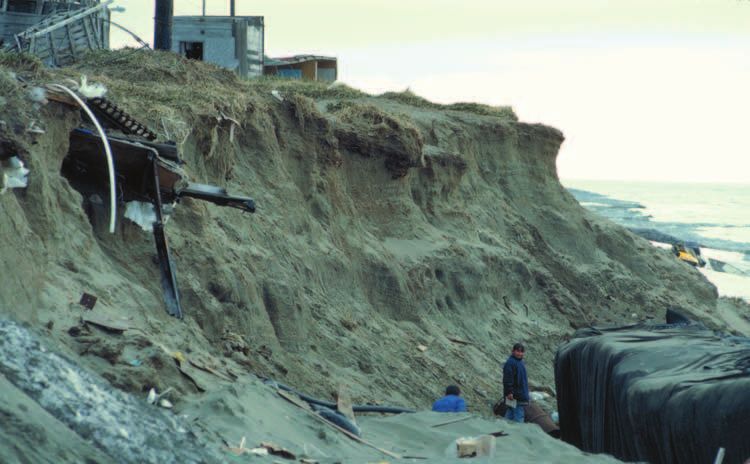
Acknowledgments
We would like to thank Dr. Michael Oppenheimer (Princeton Univ.), Dr. Tim Male,
Annie Petsonk, Peter Goldmark and Melissa Carey for reviewing this report. Erica
Rowell, Allan Margolin and Elizabeth Thompson provided helpful comments and
suggestions. Lauren Sacks, Deepali Dhar, Valentin Bellassen and Alena Herklotz
provided valuable assistance with researching and drafting parts of the report. Thanks
go to Miriam Horn for the editing work, Bonnie Greenfield for the design and pro-
duction, and Sarah Stevens, Jennifer Coleman and Tim Connor for assistance in
obtaining images.

Cover images: Ray Berkelsman, CRC Reef, Townsville (bleached corals), Bryan
Dahlberg/FEMA News Photo (wildfire), U.S. Fish and Wildlife Service (Arctic fox)

Our mission
Environmental Defense is dedicated to protecting the environmental rights of all
people, including the right to clean air, clean water, healthy food and flourishing
ecosystems. Guided by science, we work to create practical solutions that win lasting
political, economic and social support because they are nonpartisan, cost-effective
and fair.

©2005 Environmental Defense

The complete report is available online at www.environmentaldefense.org.
Contents
Signs of global warming in the United States, region by region iv
Executive summary v
Introduction 1
Part I: Extreme events 3
Killer heat waves 3
Torrential rains and flooding 4
Drought 5
Forests and wildfires 7
Part II: Sea level rise and coastal flooding 10
Part III: Snow, land ice and sea ice 13
Shrinking snowpack 13
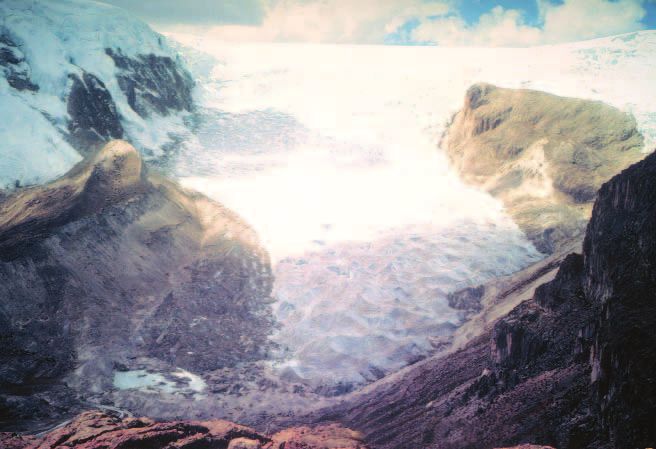
Vanishing glaciers 13
Polar ice disintegration 16
Melting permafrost and damage to infrastructure 17
Part IV: Ecological impacts 19
Damage to coral reefs 19
Shifting species ranges and yearly cycles 20
Declining Arctic animal populations 20
Declining amphibian populations 22
Part V: Outbreaks of vector-borne diseases 24
Conclusion 26
References 27
iii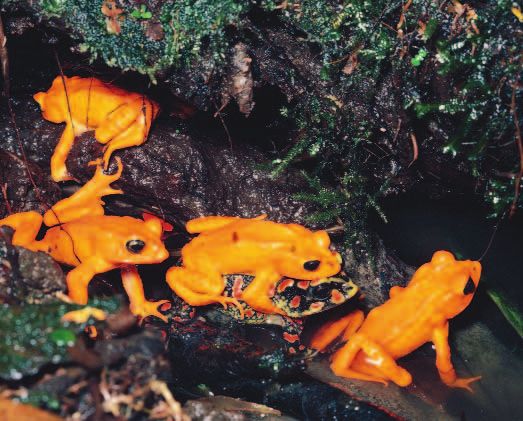
Signs of global warming in the United States, region by region

              Southeast/South-Central/                            Sierra Nevada peaks 3 weeks earlier.
              Caribbean Islands                                   Part III, “Shrinking snowpack,” page 13.
              • Smoke from record wildfires in Mexico           • South Cascade Glacier in Washington
                triggers health alert in Texas, 1998.             at smallest size ever in the last 6,000
                Part I, “Forests and wildfires,” page 7.          years. Part III, “Vanishing glaciers,”
              • Loss of nearly 1 million acres of                 page 13.
                wetlands in Louisiana due in part to            • Decline in populations of mountain
                sea-level rise. Part II, page 10.                 amphibians in Pacific Northwest.
              • Coral bleaching in consecutive years              Part IV, “Declining amphibian popu-
                observed for the first time in Florida            lations,” page 22.
                Keys 1997–1998. Part IV, “Damage to             • First large-scale coral bleaching event
                coral reefs,” page 19.                            ever documented in Hawaii in 1996.
                                                                  Part IV, “Damage to coral reefs,” page 19.
              Northeast/Mid-Atlantic
              • Loss of large areas of wetlands in              Alaska
                Chesapeake Bay. Part II, page 10.               • World's largest recorded outbreak of
                                                                  spruce bark beetles, 1990s. Part I,
              Midwest/Plains                                      “Forests and wildfires,” page 7.
              • Deadly Chicago heat wave, 1995.                 • Worst fire season in 2004; record levels
                Part I, “Killer Heat Waves,” page 3.              of unhealthful smoke particles. Part I
                                                                  “Forests and wildfires,” page 7.
              Rocky Mountains/Southwest                         • Shrinkage and thinning of sea ice
              • One of the worst droughts in 500 years            affecting traditional hunting. Part III,
                in the West, 1999-2004. Part I,                   “Polar ice disintegration,” page 16.
                “Drought,” page 5.                              • Damage to houses, roads, and villages
              • Worst wildfire season in 50 years in              and disruption of mining activities by
                the West, 2000. Part I, “Forests and              melting permafrost. Part III, “Melting
                wildfires,” page 7.                               permafrost and damage to infrastructure,”
              • 16% decline in snowpack in the                    page 17.
                Rockies; Spring snow melt begins                • Decline in caribou populations due to
                nine days earlier. Part III, “Shrinking           earlier spring. Part IV, “Declining Arctic
                snowpack,” page 13.                               animal populations,” page 20.
              • Dramatic shrinkage of glaciers in
                Glacier National Park. Part III,                Nationwide
                “Vanishing glaciers,” page 13.                  • Increase in frequency of intense
              • Outbreaks of hantavirus in the past               precipitation events. Part I, “Torrential
                decade linked to heavy rains. Part V,             rains and flooding,” page 4.
                page 24.                                        • Sea level rise averaging 4 to 8 inches
                                                                  over 20th century. Part II, page 10.
              Pacific Coast/Hawaii/                             • Migrations and shifts in yearly cycles
              Pacific Islands                                     of plants and animals, including many
              • 29% decline in snowpack in the                    butterfly species. Part IV, “Shifting
                Cascades; streamflow throughout                   species ranges and yearly cycles,” page 20.

                                                           iv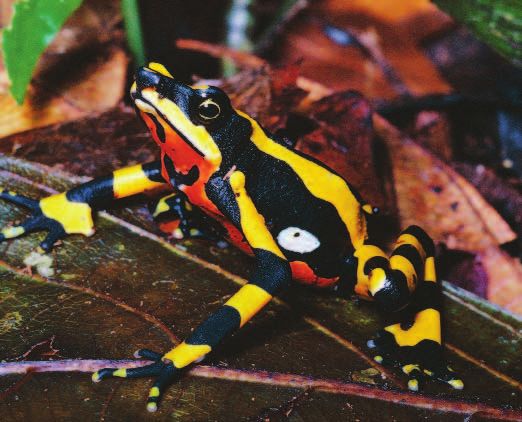
Executive summary

           Global warming will not only be felt many           Europe in July and August of 2003. That
           decades from now—it is already happen-              summer was very likely the continent’s
           ing and its impacts are clearly visible. This       hottest in 500 years. The relentless heat
           paper gathers examples from the peer-               killed at least 27,000 people, breaking
           reviewed scientific literature of recent            all records worldwide for heat-induced
           impacts around the world. These include             human fatalities. The heat and associated
           increases in extreme weather events, rising         drought and wildfires cost European
           sea level, disappearing glaciers and polar          economies more than $14.7 billion
           ice, damaged coral, changes in wildlife             (13 billion euros) in losses in the agricul-
           distributions and health, and increased             ture, forestry, and electric power sectors.
           activity and abundance of disease vectors.               Records have been shattered in other
           Although a direct link to global warming            parts of the world as well in recent years.
           is difficult to establish for some of these         In April-June 1998, 3,028 people died
           phenomena in isolation, the multitude of            in the most disastrous heat wave to ever
           changes collectively provide clear evidence         hit India. In 1995, a five-day heat wave
           of the immediate and growing danger that            caused 525 deaths in Chicago, with the
           global warming poses to the economy,                106°F (41°C) reading on July 13 the
           human health, and the ecosystems upon               warmest July temperature ever measured.
           which humans and other species depend.
           Since greenhouse gas pollution stays in             • Torrential rains and flooding
           the atmosphere for decades or centuries,            According to the available data, global
           humanity may have no more than a dec-               warming has increased the intensity of
           ade left to begin stabilizing the climate to        precipitation events over recent decades.
           avert devastating and irreversible impacts.         In December 1999, for instance, Vene-
           Such an achievement will require a con-             zuela saw its highest monthly rainfall in
           certed effort among all nations.                    100 years, with massive landslides and
               The following are highlights of the             flooding that killed approximately 30,000
           global warming impacts described in                 people. On two days in the city of Mai-
           this report. For readers particularly               quetia, rains fell with an intensity nor-
           interested in the United States, we                 mally experienced just once in 1,000 years.
           include, preceding this Executive Sum-
           mary, a listing of domestic impacts by              • Drought, forest pests, and wildfires
           region. (For a comprehensive rebuttal of            From 1998 to 2002, below-normal
           skeptics’ claims regarding the science of           precipitation and high temperatures
           global warming, see our earlier report,             resulted in droughts covering wide
           The Latest Myths and Facts on Global                swaths of North America, southern
           Warming, available at http://www.undoit             Europe, and southern and central Asia.
           .org/what_is_gb_myth.cfm.)                          Drought continued in some regions
               In brief, this is what the scientific           through 2004, including the western
           studies show:                                       U.S., which endured the most severe
                                                               drought in 80 years and one of the most
           • Killer heat waves                                 severe in 500 years. The worldwide
           Human-caused global warming may                     drought has been linked to unusually
           have already doubled the chance of                  warm waters in the Indian Ocean and
           “killer” heat waves like the one that hit           western Pacific, which many scientists

                                                           v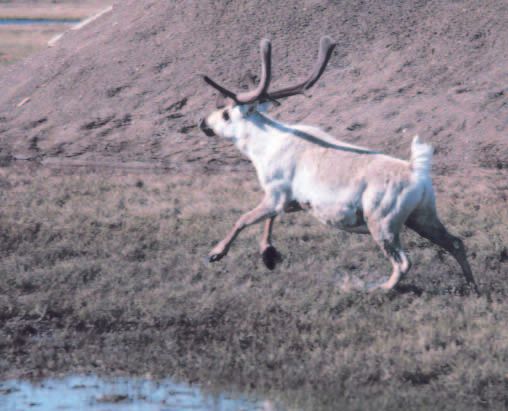
believe to be caused in part by global              basis for the four-and-a-half billion
warming.                                            dollar U.S. ski industry. Over the past
   Insect pests are spreading to forests            50 years, spring snowpack has dimin-
previously too cold for their survival;             ished by 16% in the Rocky Mountains
Alaska, for instance, had in the 1990s              and 29% in the Cascade Range, due
the world’s largest recorded outbreak of            mainly to rising temperatures. Further-
spruce bark beetles.                                more, springtime snowmelt in the
   Drought, heat, and insect attacks                western U.S. now begins 9 days earlier
promote severe forest fires. In 2004,               on average, lowering stream levels
Alaska had its warmest and third driest             during the dry summer months. It will
summer, resulting in its worst fire year            be extremely difficult to solve the prob-
on record, with fires consuming an area             lem of crippling, long-term water short-
of forest the size of Maryland. All told,           ages in the West without addressing
over the past 30 years, the area burned             global warming.
annually by wildfires in the Arctic region             In almost every mountainous region
of western North America has doubled.               across the world, glaciers are retreating
In Russia, the area of forest burned annu-          in response to the warming climate. The
ally more than doubled in the 1990s                 shrinkage of glaciers is already creating
compared to the previous two decades.               water shortages, and threatening tour-
                                                    ism in scenic parks. In one basin in
• Rising sea level                                  Glacier National Park in Montana, for
Sea-level rise is one of the most certain           instance, two-thirds of the ice has dis-
impacts of global warming. During the               appeared since 1850; with uncontrolled
20th century, sea levels around the world           warming, the remaining glaciers could
rose by an average of 4 to 8 inches (10 to          disappear by 2030. In the European
20 cm), ten times the average rate over the         Alps, ice that had hidden and preserved
last 3,000 years. That rise is projected to         the remains of a Stone Age man melted
continue or accelerate further, with pos-           for the first time in 5,000 years. Vene-
sible catastrophic increases of many meters         zuela had six glaciers in 1972, but now
if the ice sheets on Greenland and/or               has only two; these too will melt away
Antarctica collapse. Already, one-third of          in the next ten years. In the Peruvian
the marsh at Blackwater National Wild-              Andes, glacial retreat has accelerated
life Refuge in the Chesapeake Bay has               sevenfold over the past four decades.
been submerged under the sea, and the               In Africa, 82 percent of the ice on
edges of mangrove forests in Bermuda are            Mt. Kilimanjaro has disappeared since
lined with recently drowned trees. If sea           1912, with about one-third melting
level continues to rise, thousands of square        in just the last dozen years. In Asia,
miles of land in densely populated areas            glaciers are retreating at a record pace in
such as the eastern U.S. and Bangladesh             the Indian Himalaya, and two glaciers
may be lost, and flooding during storm              in New Guinea will be gone in a decade.
surges will worsen. Construction of
physical barriers such as seawalls would be         • Disintegrating polar ice and
expensive and in some cases unfeasible.             melting permafrost
                                                    Since 1950, the Antarctic Peninsula
• Shrinking snowpack and                            has warmed by 4°F (2°C), four times
vanishing glaciers                                  the global average increase. In 2002,
Mountain snowpack constitutes a criti-              a Rhode Island-sized section of the
cal reservoir of fresh water, as well as the        Larsen B ice shelf, which sits offshore

                                               vi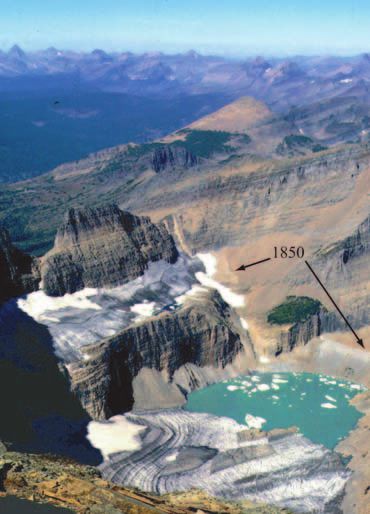
of the Peninsula, disintegrated in only             record seriously damaged 16% of the
35 days. The ice shelf acts as a dam for            reefs in the world and killed 1,000-year-
glaciers on land; its break-up is causing           old corals. Mass bleachings are usually
a worrisome speed-up of glacier flow                caused by excessively high temperatures.
into the ocean, which could raise global            Scientists therefore attribute the increase
sea level.                                          in bleaching events to the rise in average
    In 2003 the Ward Hunt Ice Shelf,                surface ocean temperatures in many
the largest in the Arctic, broke in two,            tropical regions by almost 2°F (1°C)
draining a unique freshwater lake that              over the past century. Within the next
was home to a rare microbial ecosystem.             few decades, continued warming could
Since the 1950s, the surface area of the            cause mass bleachings to become an
Arctic’s sea ice has shrunk by 10 to 15%            annual event, wiping out some reef
in spring and summer, and the ice has               species and ecosystems along with the
thinned by about 40% in late summer                 food, tourism income, and coastline
and early autumn. In a turn for the                 protection they provide. Corals are also
worse, the years 2002–2005 have all                 directly threatened by increasing atmo-
seen record or near-record low ice                  spheric concentrations of carbon dioxide,
coverage. The Hudson Bay has been                   which is acidifying seawater and making
particularly hard hit, with the sea-ice             it more difficult for corals to build their
season shortened by three weeks. The                calcium carbonate skeletons.
reduced time for hunting ice-dwelling
seals is seriously damaging the health of           • Shifting species ranges and yearly
the bay’s polar bears and causing them              cycles
to have 15% fewer cubs. At present rates            Of over 1,400 species analyzed, ranging
of shrinkage, Arctic sea ice could soon             from fish and mammals to grasses and
pass a point of no return, disappearing             trees, over 80% are migrating to higher
completely each summer by the end                   latitudes or higher elevations and
of this century and pushing polar bears             altering their annual routines in
to the brink of extinction everywhere.              response to global warming. Over time,
Shrinking and thinning ice has also                 this could cause disruptive ecological
made hunting of seals and other food                and economic changes, such as the
sources more challenging and accident-              disappearance of entire fisheries.
filled for humans. Continued warming                Amphibians have shown particular
could destroy traditional societies.                vulnerability: In mountains around
    Because the permafrost on which                 the globe, many species, including the
they are built is melting, buildings and            golden toad and most of the 70-odd
roads in Alaska have been sinking and               species of harlequin frogs, have vanished
breaking up. The 4,000 year-old Eskimo              or declined because of diseases spurred
village of Shishmaref has been so severely          by climatic changes.
eroded by ocean waves that the entire
community was forced to relocate.                   • Disease outbreaks
                                                    Higher temperatures accelerate the
• Damage to coral reefs                             maturation of disease-causing agents
The past 25 years have witnessed a                  and the organisms that transmit them,
higher incidence around the world of                especially mosquitoes and rodents.
large-scale coral “bleaching” events, which         Higher temperatures can also lengthen
can lead to coral death. In 1997–98                 the season during which mosquitoes are
alone, the largest bleaching event on               active, as has already been observed in

                                              vii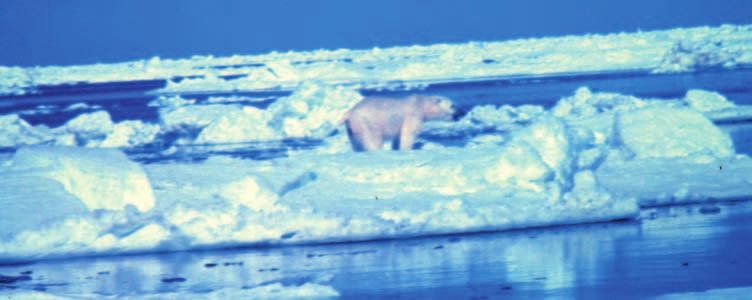
Canada. Warming has also been linked                tions—has also contributed to new
to the recent spread of tropical diseases,          outbreaks of disease. In the past decade,
including malaria, dengue fever and                 heavy rains associated with El Niño
yellow fever, into high-altitude areas in           events have caused explosive population
Colombia, Mexico, and Rwanda that                   growth in the rodents that transmit
had never seen the diseases before.                 hantavirus, which can lead to severe and
   The increase in El Niño events since             often fatal illness in humans. As a con-
the mid-1970s—a change consistent                   sequence, record outbreaks of hantavirus
with global warming model predic-                   have been occurring in the U.S.

                                             viii
Introduction
Global warming is no longer just a pre- is a distant threat, with consequences
diction—it is actually happening. It is that will only be felt many decades from
undisputed that the average temperature now. The fact is, many widely accepted,
at the surface of the Earth has increased peer-reviewed scientific studies have
over the past century by about 1°F found evidence that global warming has
(0.6°C), with both the air and the already had major impacts on eco-
oceans warming.1 Since 1880, when systems and societies across the world.
people in many locations first began to Glaciers all around the world and
keep temperature records, the 25 warm- Arctic sea ice have been shrinking and
est years have all occurred within the disappearing; sea level has been rising
last 28 years.2 Scientists know with and flooding low-lying areas; life-
absolute certainty that the observed threatening heat waves, flooding rain-
dramatic increase in the atmospheric storms, droughts, and forest fires have
concentrations of greenhouse gases since become more intense and frequent over
pre-industrial times (to levels higher recent decades; corals are “bleaching”
than at any other time in at least the and dying in response to higher ocean
last 420,000 years) has been caused by temperatures; and numerous animal and
human activities, mostly the burning plant species are migrating away from
of fossil fuels (coal, oil, and natural gas), the higher temperatures, toward the
and to a lesser extent, deforestation.3 poles and higher elevations. While a
The ability of greenhouse gases, such direct causal link to global warming has
as carbon dioxide, methane, and nitrous been established for some observed
oxide, to trap heat at the Earth’s surface changes, such as sea-level rise and
is also scientifically well understood. worldwide glacial retreat, such a link
While it has not yet been precisely is difficult to definitively establish for
determined how much of the recent other changes, such as the increased
warming was caused by human activi- incidence of droughts or the migration
ties, the consensus among climate of a particular species. However, the
scientists is that most of the warming multitude of changes collectively pro-
over the past 50 years was probably vides a consistent and clear body of
caused by human-produced greenhouse evidence of the immediate and growing
gases. (See statements issued by the danger that global warming brings.
National Academy of Sciences, the Using the terminology of those tasked
American Meteorological Society, the with protecting public health, “the weight
American Geophysical Union, the of the evidence,” or information com-
Intergovernmental Panel on Climate piled from all available studies, points
Change, and the national academies strongly to global warming as a force
of eleven countries.)4 Recent precise behind the observed changes. At risk
measurements of the heat content of are the health of the global economy,
the world’s oceans, which show an of human individuals and communities,
increase close to the amount expected and of the ecosystems upon which we
from warming by greenhouse gases, depend for food, clean water, other
strengthen the consensus view.5,6 resources, and spiritual sustenance.
Many among the public may have Carbon dioxide and other greenhouse
the misconception that global warming gases stay in the atmosphere for a
1century or longer after being emitted.7 or where other causative factors may
The greenhouse gases we have already be involved. We have relied almost
added to the atmosphere since the exclusively on information from peer-
Industrial Revolution have therefore reviewed scientific publications and
committed the globe to a certain government websites; the few exceptions
amount of continued warming over the include a Munich Re company report, a
Humanity may coming decades no matter what we do National Geographic article, and a BBC
have only a narrow with future emissions.8,9,10 Humanity News article.
may have only a narrow window of time There are many more examples of
window of time left,
left, perhaps a decade or so, to begin the global warming impacts than can fit
perhaps a decade long process of stabilizing greenhouse into an easily digestible report like this.
or so, to begin the gas concentrations at a level that can For more comprehensive information,
long process of avert devastating and irreversible im- the reader may want to refer to other
stabilizing green- pacts from climate change.11,12 recent reports, such as the 2004 Arctic
This report summarizes some of Climate Impact Assessment; Status of
house gas concen-
the major impacts that global warming Coral Reefs of the World: 2004; the 2000
trations at a level has already had across the world, National Assessment of Climate Change
that can avert including some that have been observed Impacts on the United States; and the
devastating and since the publication of major assess- IPCC Third Assessment Report.14 For
irreversible impacts ments by the Intergovernmental Panel a comprehensive rebuttal of skeptics’
from climate on Climate Change (IPCC) and the claims regarding the science of global
National Academy of Sciences in warming, see an earlier report of ours,
change.
2001.13 Our goal is to provide policy- The Latest Myths and Facts on Global
makers, journalists, and the public with Warming, available at http://www.undoit
facts so that they can make informed .org/what_is_gb_myth.cfm. Occasional
decisions on the measures needed to updates to the present report are
stem the global-warming tide. We have planned. Suggestions for improvements
made every effort to ensure that the and additions are welcome. Please
document is scientifically rigorous, send suggestions to: Dr. James Wang,
noting where the link between a Environmental Defense, 257 Park
particular phenomenon and global Avenue South, New York, NY 10010;
warming may not be fully established jwang@environmentaldefense.org
2PART I
Extreme events
It is difficult to blame a particular the number of deaths in excess of the
extreme weather event (such as a typical number during the summer
heat wave, flood-producing storm, period.) In France alone, over 14,000
or drought) on global warming, since people died. In addition to the emo-
weather fluctuates naturally. However, tional trauma and medical costs, the
climate theory and models predict heat and associated drought and wild-
that global warming will increase the fires cost European economies over
frequency and/or intensity of some $14.7 billion (13 billion euros)* in losses
types of extreme events. A warmed in the agriculture, forestry, and electric
world, in other words, is like a loaded power sectors.21 Specific damages
die that comes up “Heat Wave” or included a 60% reduction in fodder
“Intense Rainstorm” more often than production in France, an 18% decrease
an unperturbed world.15 Thus, scientists for wine in Italy, an 11% fall in grain
can estimate the fraction of the risk production for Europe as a whole,
of a particular kind of event for which livestock deaths (for example, millions
humans are responsible. This section of of chickens died in France and Spain,
the report presents examples of extreme reducing the flock by 15–20% in
A warmed world, events observed during recent decades Spain),22 and cuts in power generation
in other words, is that are consistent with the effects of due to shortages of river water for cool-
global warming and may be harbingers ing the plants. France, Europe’s main
like a loaded die
of greater changes to come if we allow electricity exporter, cut its power exports
that comes up global warming to continue unabated. by more than half to preserve an ade-
“Heat Wave” or quate domestic supply. By the 2040s, the
“Intense Rainstorm” risk of a similar heat wave could increase
more often than Killer heat waves 100-fold if civilization doesn’t restrain
Human-caused global warming may the growth of greenhouse gases, with
an unperturbed
have already doubled the chance of one out of every two years being hotter
world.
“killer” heat waves like the one that than 2003 (as compared to the current
scorched Europe in July–August one out of every 200).23
2003.16 Strong evidence indicates that India was also hit in 2003 by a severe
the summer was the hottest in Europe heat wave. Temperatures reached as
in at least the past 500 years.17 All-time high as 122°F (50°C) in May across the
high temperature records were broken worst hit areas and over 1,200 people
in many countries. In the United King- died.24 Just five years earlier, the most
dom, the mercury hit 100.6°F (38.1°C) disastrous heat wave to ever hit India
at Gravesend-Broadness, Kent on took place during April–June of 1998,
August 10, exceeding 100°F for the with an estimated 3,028 fatalities.25 The
first time in that country since records temperature rose as high as 113–121.6°F
began.18 In Germany, an all-time (45–49.8°C) in several Indian states.
record of 104.4°F (40.2°C) was set Disruptions to the electricity supply due
on August 8.19 to excessive demand wreaked havoc on
At least 27,000 people died as a result
of the relentless heat, breaking all * We obtained the U.S. dollar value from the
records worldwide for heat-induced value in euros by applying the 2003 con-
human fatalities.20 (The figure refers to version rate.
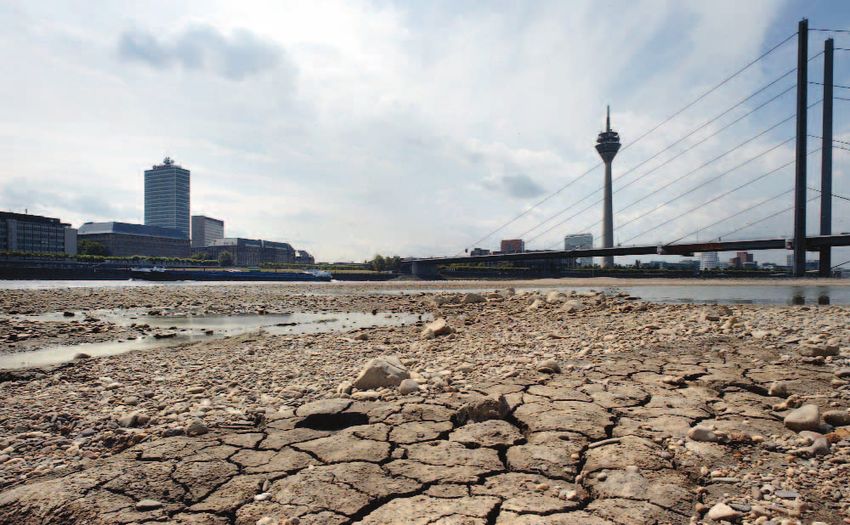
3A ship on the river Rhine in Duesseldorf, Germany, July 25, 2003, during the extreme heat wave that
scorched Europe for much of the summer. Low water levels meant bigger ships could transport only
30 to 50 percent of their normal cargo. (AP Photo/Martin Meissner)
hospital services and on refrigerated precipitation events occurred over the
supplies of vaccines and medicines.26 second half of the 20th century.30 This
In the United States, Chicago experi- increase is consistent with the predicted
enced one of the worst weather-related effects of global warming, since higher
disasters in Illinois history when a heat temperatures speed up evaporation and
wave resulted in 525 deaths during a increase the amount of water vapor in
5-day period in July of 1995.27 The 106°F the air, leading to heavier downpours.
(41°C) reading on July 13 set a record Heavier rainfall in turn increases the
for the warmest July temperature since risk of flooding.
measurements began. The combination Another factor contributing to more
of high humidity and high nighttime intense precipitation in some regions is
temperatures meant little respite from the increase in frequency and intensity
the heat could be found, especially for of El Niño events since the mid-1970s.
such vulnerable populations as the An El Niño is a phase of warmer-than-
elderly and people with low incomes. average waters in the eastern Pacific
Studies indicate that the increase in and weaker-than-average tropical trade
death rate from more frequent heat winds, usually lasting around a year and
waves in the future will probably out- occurring once every two to seven years.
weigh any decrease in death rate due El Niños typically bring unusually heavy
to less severe winter cold in the U.S., rains to the southern tier of the U.S. and
because cold-related mortality is more Peru, while causing below-normal pre-
complex and not so strongly tied to the cipitation in the northwestern U.S.,
severity of the cold.28,29 northeastern Brazil, Southeast Asia,
Australia, and southern Africa. Several
recent El Niños may have been more
Torrential rains and flooding intense or long-lasting than any in the
According to the available data, a last three centuries.31 Some climate
significant increase in the intensity of simulations have indicated that further
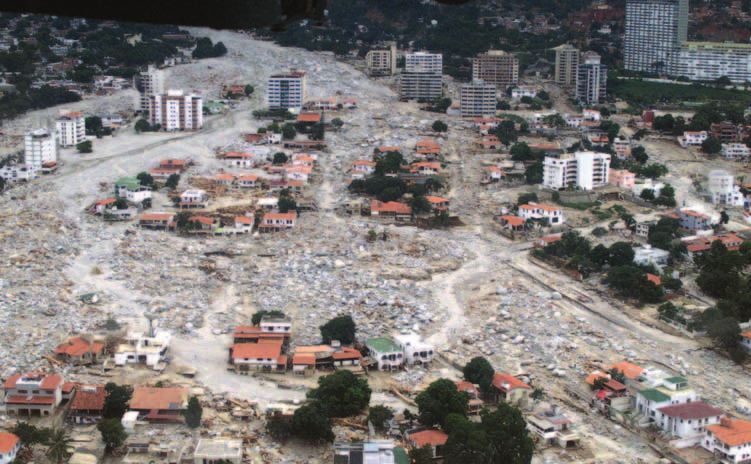
4Devastation in coastal Venezuela caused by the December 1999 flows of mud and rocks. (Lawson
Smith, U.S. Army Corps of Engineers)
warming of the planet will produce more to October) and was not produced by a
frequent and longer-lasting El Niños in hurricane or other tropical cyclone. The
the future, thus causing extreme floods ensuing flows of mud and boulders are
and droughts to occur more often. thought to have been among the largest
One of many extreme flooding events worldwide in at least a century. It is
that may have been exacerbated by worth noting that the high death toll
global warming occurred in December was partly due to the building of large
1999, when Venezuela experienced its numbers of homes on steep slopes prone
highest monthly rainfall in 100 years, to landslides and low-lying areas suscept-
with massive landslides and flooding ible to floods. Discouraging development
that killed approximately 30,000 in these kinds of vulnerable locations, in
people.32 Total December rainfall in the addition to reducing worldwide green-
coastal city of Maiquetia, near Caracas, house gas pollution, would help mitigate
was almost 4 feet (1.2 m), more than future damages from global warming.
5 times the previous December record.
During one particularly intense period,
2.8 inches (72 mm) of rain fell in one Drought
hour. Rainfall on two of those December Paradoxically, although flooding events
days were “1,000-year events”—in other are very likely to increase with global
words, that daily amount of rainfall is warming, droughts are also expected to
expected to occur in that location on be more frequent and severe. Higher
average only once in 1,000 years. Rain- temperatures tend to increase the rate
fall amounts in the neighboring moun- of evaporation; if precipitation doesn’t
tains are estimated to have been twice as soon replenish the lost moisture, soils
high, or around 8 feet over the month. grow drier. In drier soils, less solar
The rainfall was unusual not only for energy is used up in evaporating water,
its intensity, but also because it occurred meaning more energy is available to
outside of the normal rainy season (May raise the temperature of the soil and the
5overlying air, leading to even more decreasing the proportion of precipi-
desiccating conditions; this kind of self- tation that falls as snow rather than rain
amplifying cycle can lead to a lengthy in the mountains, and by accelerating
and severe drought.33 Dry soils can drive the rate of snow melt in the spring.
another kind of self-amplifying cycle as A reduced snowpack and earlier and
well: when there is less evaporation to quicker melts make for lower stream
the air because soil moisture is depleted, flows in the summer, when water can
there can be less moisture in the atmo- be in short supply. (See “Disappearing
sphere locally to form precipitation, Snowpack” in Part III.)
potentially resulting in yet drier soils.34 Warmer ocean temperatures due
The drought that accompanied the to global warming may also increase
devastating heat waves of 2003 in Europe, the severity of droughts. The Indian
for instance, is thought to have been Ocean and the western Pacific were
intensified by global warming.35 (See the exceptionally warm between 1998 and
section “Killer Heat Waves” in Part I.) 2002,* in part because of the overall
Models predict that the vulnerability to warming trend in the world’s oceans.37
summer droughts will be especially high In the same period, unusually persistent
in many mid-continental areas, which atmospheric flow patterns resulted
are often important grain-producing in below normal precipitation, high
and/or grazing regions. The reasons for temperatures, and drought conditions
their vulnerability are that their climate across wide swaths of North America,
isn’t cooled by the ocean and that a large southern Europe, and southern and
portion of their precipitation is derived central Asia. Drought continued
from continental moisture.36 through 2004 in some areas, including
In addition to increasing evaporation the western U.S., where according to
and prolonging periods with deficient stream flow records and tree ring studies
rainfall, a warmer climate can reduce the drought was the most severe in
water supplies in arid and semi-arid 80 years and one of the most severe
regions (such as the western U.S.) by in 500 years.38,39,40 During the peak,
more than 50% of the area of the co-
terminous U.S. suffered from moderate
to severe drought, with much of the area
experiencing record or near-record low
precipitation.41 The average annual flow
of the Colorado River at Lees Ferry,
Arizona during the 2001–2003 period
was 5.4 million acre feet (6.7 cubic
kilometers), just half of the 10.2 million
* While the geographic pattern of the warmth
can be explained by a La Niña event (the
opposite of an El Niño, or in other words,
a phase of warmer-than-average waters in
the western Pacific and cooler-than-average
waters in the eastern Pacific), scientists study-
Lowering water level during severe drought at ing the 1998–2002 event believe that an
Lake Powell on the Colorado River, at the con-
fluence with the Dirty Devil River (entering from
overall warming trend in the world's oceans
left). Top: June 29, 2002. Bottom: December 23, over the past few decades contributed to the
2003. (John C. Dohrenwend, USGS files) unusual extremeness of the warmth.
6Example of a recent severe wildfire in the West: In Glenwood Springs, Colorado, on June 8, 2002, the
evening sun barely penetrates the smoke and ash as evacuees flee West Glenwood because of the
spreading wildfires in Garfield County. (Bryan Dahlberg/FEMA News Photo)
acre feet (12.6 cubic kilometers)* that Forests and wildfires
flowed during the Dust Bowl years Scientists expect global warming to
(1930–1937).42 contribute to an increase in wildfire in
A number of researchers have used several ways. As discussed in the pre-
climate models to examine the under- vious section, droughts are expected to
lying causes of the recent drought.43,44 become more common and severe in
Their model simulations produced a some regions. Desiccating heat and lack
climate pattern very similar to that ob- of precipitation create ideal conditions
served, and suggested that the warmth for major wildfires. In addition, longer
in the Indian Ocean and western Pacific warm seasons often translate into longer
caused the persistent atmospheric flow fire seasons. Warmer temperatures also
patterns, which in turn produced the promote outbreaks of insects that feed
drought conditions across the wide ex- on trees, killing many of the hosts and
panse of mid-latitude regions. In short, creating large amounts of dry fuel for
there is mounting evidence that global forest fires. Insects are even spreading
warming contributed to the vast extent to areas that until recently were too cold
and severity of the recent drought. for their survival. In south-central
Alaska in the 1990s, the world’s largest
* This comparison of streamflow is adjusted
recorded outbreak of spruce bark beetles
for changes caused by the Glen Canyon Dam, damaged more than 4 million acres
which was constructed in the early 1960s. (1.6 million hectares) of forest, an area
The streamflow figures are not corrected for nearly the size of the state of New Jersey.45
increases in water consumption upstream of Since 1994, Canada has been afflicted
Lees Ferry over time; but even after applying
with its largest and most northerly
an extremely large correction, the estimated
flow during the recent period would still be spruce bark beetle outbreak ever, affect-
1.3 million acre feet (1.6 cubic kilometers) ing 750,000 acres (300,000 hectares) in
lower than during the Dust Bowl. the Yukon.46
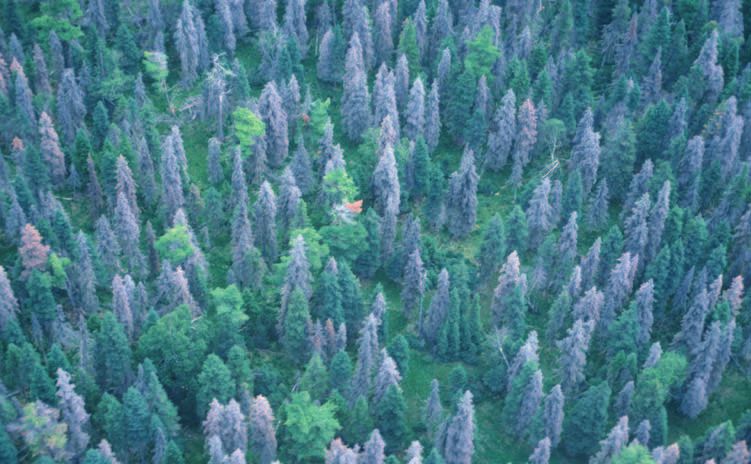
7Aerial view of a white spruce forest severely damaged by spruce bark beetles, Canada. (Courtesy of
Natural Resources Canada, Canadian Forest Service, Laurentian Forestry Centre/Luc Jobin)
With this combination of heat, around the world, and that global
drought and pests, wildfires have become warming has played an important role.49
increasingly destructive in recent dec- The summer of 2004 was particularly
ades. Among the regions hit hard are fierce: Alaska’s warmest and third driest
the huge tracts of Arctic spruce and summer on record made for its worst
pine forest spanning Alaska, northern fire year ever.50,51 A total of 703 fires
Canada, Scandinavia, and Siberia consumed 6,517,200 acres (2.6 million
(which despite their northerly latitude hectares) of forest, an area the size of
are susceptible to fires in the summer- Maryland. Evacuations of threatened
time, especially during warm, dry years). communities reached record levels,
In the Arctic region of western North and for the first time ever, fire engines
America, the area burned annually has were shipped from the lower 48 states
doubled over the past thirty years.47 In to deal with the conflagration. Because
the Russian Arctic, fire damage increased of the fires, air quality in the interior
sharply in the 1990s, with the area of and the northeast of the state was
forest burned annually being more than reported as unhealthy or hazardous
twice as large as during the previous on 52 days. On June 28 in Fairbanks,
two decades.48 The risk of catastrophic health-threatening airborne particulates
fires has been exacerbated in the Arctic registered 1,000 micrograms per cubic
as well as other parts of the world by meter, the highest ever recorded in
decades of fire suppression by humans, Alaska; normal is 65.
which has allowed dead, flammable Regions outside of the Arctic have
plant material to accumulate. But even seen many severe fires in recent decades
remote parts of the Arctic, which have as well. For example, severe drought and
seen little fire suppression, have experi- high temperatures in the western U.S.
enced an increase in wildfire, suggesting in 2000 resulted in over 122,000 fires,
that suppression by itself cannot com- which burned approximately 8.5 million
pletely explain the increase in wildfire acres (3.44 million hectares), the worst
8wildfire season in the last 50 years.52 The As with drought, wildfire can set off a
first seven months of that year were the self-amplifying cycle. If, as climate models
warmest in 106 years of records in New predict, wildfires continue to increase in
Mexico, Utah, and Texas, while Arizona, frequency and intensity,54 the amount
Colorado, Nevada, Wyoming, and Idaho of carbon dioxide released into the atmo-
had their 2nd or 3rd warmest January– sphere from burning vegetation and
July. In 1998, Mexico experienced its soil organic matter could outstrip the
worst fire season ever, when 1.25 million amount absorbed by regrowing forests,
acres (506,000 hectares) burned during strengthening the greenhouse effect and
a severe drought.53 Smoke reaching global warming and possibly leading to
Texas triggered a statewide health alert. even more fires in a worsening cycle.
9PART II
Sea level rise and coastal flooding
Sea-level rise is one of the most certain erosion, making them susceptible to
impacts of global warming. Sea level rose being blown over by the wind. Mangrove
around the world by an average of 4 to forests provide habitat for many birds
8 inches (10 to 20 cm) over the course and economically important marine
of the 20th century, ten times the average species including shrimp, oysters, and
rate over the previous three thousand fish; these forests also filter the water,
years.55 The rise in sea level is due to the keeping it clean and clear, and protect
expansion of ocean water as it warms, the coast from storm surges and waves.
and to the addition of water from melt- (A storm surge is a sharp, localized rise
ing glaciers and ice sheets, both of which in sea level lasting hours or days, caused
are consequences of global warming. by a storm.) These forests, like other
The effects of global sea-level rise coastal ecosystems, are not able to build
are amplified in some places due to local up sediment fast enough to keep up
geologic and man-made factors. For with the current rate of sea-level rise,
example, about one-third of the marsh and could completely disappear in places
at Blackwater National Wildlife Refuge where natural or man-made barriers
in the Chesapeake Bay in the eastern prevent landward migration.
U.S. has become submerged since 1938. On the other side of the Atlantic,
Half of the marsh loss is attributed to the Thames Flood Barrier, which
the sinking of land due to groundwater protects the city of London from storm
extraction, and the rest is attributed surges coming up from the mouth of
to global warming.56 Elsewhere in the the river, was used less than once a year
Chesapeake Bay, Bloodsworth Island is in the 1980s; in the 1990s it was used
590 acres (235 hectares) smaller than it on average more than six times a year.60
was in 1942, a loss of more than 10% of Although this increase is attributable
its original land area.57 mainly to a combination of natural
In Louisiana, nearly a million acres variations in storm surge intensity and
(400,000 hectares) of biologically-rich increased occurrence of high runoff
marsh, 28% of the original marsh area in from rainstorms, it illustrates a potential
the state, has been lost to the encroach- impact of rising global sea level. If
ing sea since 1932. Many factors have the barrier were to break during a flood,
contributed, including the sinking of the resulting damage to London could
land along geologic fault-lines, com- cost about $54 billion in 2004 dollars
paction of loose soil, and a decrease in (30 billion pounds), roughly 2% of
the supply of soil-replenishing sedi- the current U.K. GDP. In addition to
ments due to the construction of dams the Thames, more frequent and extreme
and levees. However, global sea-level flooding due to sea-level rise threatens
rise has contributed at least one-eighth low-lying areas near the mouths of
of the flooding, even at the sites that are the Nile in Egypt, the Mekong in
sinking most rapidly.58 In Bermuda, Vietnam and Cambodia, the Ganges
rising sea level is leading to saltwater and Brahmaputra in Bangladesh, and
inundation of coastal mangrove forests.59 other rivers around the world.61
The edges of the forests are now lined Scientists project that sea level will
with trees that have recently drowned or continue to rise as a result of human-
whose roots have been exposed due to produced greenhouse gas pollution and
10I below 1.5 meters
I 1.5–3.5 meters
I above 3.5 meters
200 miles
This map highlights the areas along the U.S. Atlantic and Gulf coasts that are vulnerable to inundation
resulting from sea-level rise. This is a simple elevation map and does not include additional future
impacts from erosion and local sinking of land. Altogether, 22,400 square miles (58,000 square
kilometers) of land, an area more than twice the size of Maryland, lie within 5 feet (1.5 m) of sea level;
sea level could rise by this amount within the next few centuries. More than 80% of this low land is
found in just four states: Louisiana, Florida, Texas, and North Carolina. (Source: Titus, J.G. and C.
Richman. 2001. Maps of lands vulnerable to sea level rise: modeled elevations along the U.S. Atlantic
and Gulf coasts, Climate Research. Available at http://yosemite.epa.gov/oar/globalwarming.nsf/
content/ResourceCenterPublicationsSLRMapsIndex.html)
could reach an additional 3.5 inches to precipitation.) Some studies have even
3 feet (9–88 cm) by the end of the cen- suggested the possibility that warming
tury, with even further rises in subse- over the next several centuries would
quent centuries as sea level gradually lead to the complete, irreversible dis-
adjusts to the warmer climate.62 (The appearance of the Greenland ice sheet,
large range for projected sea level rise which would raise sea level by an extra
reflects differences among models and 23 feet (7 m); there is also a slight chance
emission projections, with the lower end that the West Antarctic Ice Sheet could
reflecting possible growth in ice sheets collapse, further raising sea level by
in parts of Antarctica due to increased 13–20 ft (4–6 m).63,64
11Potential impact of sea-level rise on Bangladesh
1989
Total population: 112 million
Total land area: 134,000 km2
Sea-level rise of 1.5 m impact
Total population affected: 17 million (15%)
Total land area affected: 22,000 km2 (16%)
This graphic, based on an analysis conducted in 1989, illustrates the potential impact of sea-level rise on
Bangladesh, a low-income nation with a very large population living within a few feet of sea level. With a
5 feet (1.5 m) sea-level rise, approximately 8,500 square miles (22,000 square km), or 16% of the country’s
land area, would be submerged, displacing 17 million people. That figure is based on the estimated
population in 1989. Given that the nation’s population has grown rapidly since 1989 and is projected
to continue growing, a much higher number of people could actually be affected. (Source: UNEP/GRID
Geneva; University of Dacca; JRO Munich; The World Bank; World Resources Institute. Washington,
D.C. http://www.grida.no/climate/vital/33.htm.)
In the absence of expensive man- erty due to shoreline retreat and flood-
made physical barriers such as seawalls, ing could be costly to taxpayers as well
even a moderate sea-level rise would as property owners in the U.S., since the
submerge large portions of island federal government subsidizes flood
nations and densely populated coastal insurance for much coastal property.68
areas, displacing millions of people. Another impact of rising sea level is
(See the accompanying figures for contamination of fresh surface water
examples of vulnerable areas in the and groundwater supplies by salty water.
eastern U.S. and Bangladesh.) Adapta- Communities that obtain water from
tion to sea-level rise could cost several sections of rivers that are currently just
percent of GDP for certain developing upstream from the point where the
countries, and for many small island water becomes salty include Phila-
nations would simply be infeasible.65 delphia, New York City (as an emer-
Sea-level rise not only inundates land, gency supply during droughts) and
but also causes additional land loss due much of California’s Central Valley.69
to erosion by ocean waves. A foot of sea It takes even more time to stabilize
level rise would result in approximately rising sea levels than it does to stabilize
50-1000 feet of horizontal shoreline rising atmospheric temperatures, due to
retreat in many parts of the U.S., vary- the slow rate at which water is circulated
ing according to location.66 In addition, and heat distributed throughout the depth
higher sea levels would exacerbate the of the ocean.70 We need to put the brakes
flooding risk associated with storm on rising greenhouse gas concentrations
surges during hurricanes and other now to avoid an increasingly disastrous
storms.67 Increased loss of coastal prop- rise in sea-level down the road.
12PART III
Snow, land ice and sea ice
Shrinking snowpack of the operating costs of the Attitash
Over the past 30 years, scientists around Mountain resort in New Hampshire.76
the world have recorded a steady decline Warming thus threatens the ability of
in mountain snowpack, an important ski resorts to stay in business and remain
reservoir of fresh water, as well as the a vital contributor to regional econo-
basis for the ski industry and other mies. U.S. ski resorts bring in approxi-
winter tourism. In the western United mately $4.5 billion in revenues annually
States, where water is scarce, 75% of the (including tickets, rentals, retail, and
water in streams and rivers comes from food and beverages).77
snowmelt, providing a crucial supply Records also show that the spring-
for farms, hydroelectric power plants, time pulse, when a large amount of
aquatic life, and 60 million people— snow suddenly begins to melt and fill
one-fifth of the U.S. population.71 Spring streams, has shifted over the last two
snowpack has been decreasing in the decades across the western U.S., begin-
region: measurements recorded declines ning 9 days earlier on average than it
in three-quarters of the mountainous did 40 years ago.78 Earlier snowmelt
areas between 1950 and 1997.72 In the means that streamflow reaches its max-
Rockies, snowpack decreased an average imum earlier in the season; throughout
of 16%; the Cascades lost an average of California’s Sierra Nevada it now peaks
29%, with many sites in Washington, 3 weeks earlier than it did in 1948.79
Oregon, and Northern California losing Capturing higher streamflows earlier
more than 50%. Model simulations in- in the year is difficult in places such as
dicate that temperature increases are the California and the Columbia River
main culprit in the snowpack decline. Basin. Existing man-made reservoirs are
Even precipitation increases in some nearly filled to capacity at that time;
areas have generally not been sufficient to avoid flooding, extra runoff must
to overcome the impact of strong regional be allowed to drain into the ocean.80 By
warming. In the Swiss Alps, rising the time summer arrives, streamflow has
nighttime temperatures and an increase greatly diminished, reducing the water
in the percentage of precipitation falling supply all through the hottest, driest
as rain rather than as snow were to months. The West already faces water
blame for a reduction in snowpack of shortages in times of drought: it will be
12–45% between the 1960s and the extremely difficult to prevent still more
1990s at low- to mid-elevation sites.73 crippling water shortages without
Assessments of global warming im- addressing global warming.
pacts on ski resorts in North America,
Europe, and Australia all project nega-
tive consequences.74 Assuming current Vanishing glaciers
snowmaking technology, the ski season Glaciers are slow-moving “rivers” of
in the province of Ontario in Canada ice formed over many years from com-
is projected to shorten by 0–16% in the pacted snow on sloping land. In almost
2020s (11–50% in the 2080s), even with every mountainous region across the
an increase in snowmaking of 36–144% world, long-term monitoring has re-
in the 2020s.75 Snowmaking is expensive; vealed that the vast majority of glaciers
for example, it currently makes up 20% are retreating upslope in response to a
13warming climate;81 the glaciers’ lower increase in regional temperatures and a
reaches are melting faster than ice decrease in precipitation. Using climate
flowing down from above can replenish models, scientists project that all the
them. Since glaciers, like snowpack, glaciers in Glacier National Park could
serve to store water and release it disappear completely by 2030,
steadily over the year, their continued eliminating one of the park’s main
In the European disappearance will have a severe impact tourist attractions.84
Alps, glacial on water supplies in some regions. The Pacific Northwest is witnessing
retreat has In Montana’s Glacier National Park, similarly rapid retreats. The South
exposed well- the retreat of the glaciers has been Cascade Glacier in Washington State
preserved remains, dramatic. Between 1850 and 1979, may currently be at its smallest size ever
glaciers in the Blackfoot-Jackson in the last 6,000 years. Between 4000 BC
including the
Glacier Basin decreased in area by about and A.D. 1958, its length had always
5,000-year-old 65%, from 8.3 square miles (21.6 square stayed within the range of 2.24 to 2.88
Stone Age Oetzal kilometers) to 2.8 square miles (7.4 miles (3.60 to 4.63 km). By 1995, it had
“ice man.” square kilometers).82 More recent dropped to 1.81 miles (2.92 km).85
observations show that the retreat and Across the Atlantic, in the European
thinning of glaciers in the park Alps, glacial retreat has exposed well-
continues: For example, between 1979 preserved remains, including the 5,000-
and 1993, Grinnell Glacier shrank by year-old Stone Age Oetzal “ice man.”
22% and Sperry Glacier by 11%.83 The Having survived in the ice for so long
shrinkage has been driven by both an due to the absence of ice flow in the flat
Grinnell Glacier in Glacier National Park, Montana, viewed from the top of Mount Gould
during late summer 1938 (left) and 1981 (right). In just 43 years, a dramatic response to
warming is evident, including loss of volume and formation of a lake at the foot of the
glacier. Between 1850 and 1993, the glacier shrank 63% in area and the foot receded about
0.7 miles (1.1 km). Debris marks the 1850 glacier boundary, right. (Courtesy of Carl H. Key
(originally published in Key et al., 1998. Glacier retreat in Glacier National Park, Montana.
In R.S. Williams and J.G. Ferrigno, eds. Satellite image atlas of glaciers of the world,
Chapter J, Glaciers of North America. U.S. Geological Survey Professional Paper 1386-J.)
14Left: In 1978, the Qori Kalis Glacier looked like this, flowing out from the Quelccaya Ice Cap in the Peruvian Andes
Mountains. Right: In 2002, the view of Qori Kalis has changed dramatically with a massive 10-acre lake forming at the
ice margin. (Courtesy of Professor Lonnie G. Thompson, Byrd Polar Research Center, The Ohio State University)
areas where they were found, these has created water shortages for down-
remains only now have been exposed stream communities.93
for the first time in thousands of years— Tropical regions in Africa and South-
evidence that the recent glacial retreat east Asia are showing similar patterns.
is highly unusual.86 82% of the ice on Mt. Kilimanjaro has
At the opposite end of the Earth, disappeared since 1912, with about
glaciers in the Patagonia region of one third melting in just the last dozen
southern South America have been years.94,95 Kilimanjaro’s remaining ice
retreating over the past several dec- is projected to disappear by 2020. A
ades.87 Chile’s San Rafael Glacier—a glacier on Mount Kenya has shrunk by
World Heritage Site and a popular tour- 40% since 1963. Two glaciers in Irian
ist attraction where boats can pull right Jaya (the Indonesian portion of the
up to the towering edge of the ice on the island of New Guinea) are disappearing
water—has retreated 0.6 miles (1 km) and should be gone in a decade.
in just the last decade.88 If this continues, In the subtropics, glaciers are also re-
the glacier will terminate over land in- treating at a record pace. The Dokriani
stead of water in the near future. Bamak Glacier in India retreated 66 ft
Even in tropical mountain areas, (20.1 m) in 1998, and an annual average
where the climate is generally more of 54 ft (16.5 m) over the preceding
stable than in high-latitude regions, 5 years; the Gangotri Glacier is retreating
glaciers are receding at an accelerating 98 ft (30 m) per year.96 Both are in the
rate.89,90 Venezuela had six glaciers in Himalayan range, which has the world’s
1972. Now it has only two and, if present largest concentration of glaciers outside
trends continue, those too will be com- of the polar regions and has been called
pletely melted in the next 10 years.91 the “Water Tower of Asia.”97 Seven of the
Glacial retreat has accelerated seven- continent’s great rivers originate here and
fold in the Peruvian Andes:92 The edge supply water to hundreds of millions of
of the Qori Kalis glacier retreated 13 feet people: the Ganges, Indus, Brahmaputra,
(4.0 m) annually between 1963 and 1978; Salween, Mekong, Yangtze, and Huang
by 1995, the rate had stepped up to 99 Ho. Initially, continued warming is pro-
feet (30.1 m) per year. Shrinkage of the jected to swell those rivers with more ex-
Zongo Glacier in the Bolivian Andes tensive melting of glaciers and snowpack
15and increased precipitation.98 This will enough to freeze. Unlike land-based
worsen the already high flood risk. In a glaciers and ice sheets, floating ice does
few decades, after the most vulnerable not raise sea level when it melts. It does,
portions of the glaciers are gone, river flow however, have serious consequences.
will get dangerously low in summer.99 One of the most dramatic melting
The loss of glacial meltwater would events so far has occurred on the Antarctic
reduce summer flows on the Ganges by Peninsula, the part of that continent that
two thirds, creating water shortages for juts out towards South America. While
several hundred million people and up a slight cooling occurred in the interior
to 37% of India’s irrigated farmland.100 of Antarctica over the past century, the
Global warming skeptics have actually Peninsula has warmed by around 4°F
claimed that the majority of glaciers across (2°C) since 1950, four times the global
the world are advancing rather than re- average of 0.9°F (0.5°C).108 The retreat
treating. In fact, in only a very few areas, of ice shelves on both the eastern and
specifically western Norway, Iceland, western sides of the Peninsula since 1995
and New Zealand, have a significant has been attributed to this regional warm-
fraction of the glaciers been expanding ing.109 That retreat took a surprising turn
during the past few decades.101,102 That in 2002, when the northern section of the
expansion is a result of regional increases Larsen B ice shelf, a large floating ice
in storm frequency and snowfall amounts mass on the eastern side of the Penin-
rather than colder temperatures, and is sula, shattered and separated from the
therefore compatible with a global warm- continent. In just 35 days, beginning on
ing trend. But in all other regions of the January 31, 2002, a total of about 1,250
world, the retreat of glaciers has been square miles (3,250 square kilometers)
pronounced;103 the total net loss in vol- of shelf, an area bigger than the state of
ume across all of the world’s glaciers be- Rhode Island, completely disintegrated.
tween 1961 and 1997 is about 3 billion An ice shelf acts as a dam for glaciers
acre feet (890 cubic miles, or 3,700 on land. So although its break-up did
cubic km).104 Skeptics have also argued not directly contribute to sea-level rise,
that the glacial retreat is unconnected to observations show that the removal of
global warming by focusing on the iso- the Larsen B ice dam has caused a worri-
lated case of Kilimanjaro, for which scien- some acceleration of glacier flow into
tists have offered alternative explanations, the ocean (as much as eight-fold), which
including a drop in precipitation begin- could in time raise global sea level.110,111
ning in the late 1800s, a decrease in cloud A similar event occurred in the Arctic
cover, and the drying effect of regional in the spring and summer of 2003, when
deforestation.105 The consensus among the Ward Hunt Ice Shelf, the Arctic’s
scientists remains, however, that rising largest ice shelf, broke in two.112 The ice
air temperatures are the most important shelf had been acting as a dam for a
factor behind the retreat of glaciers on a unique freshwater lake, the largest of its
global scale over long time periods.106,107 kind in the northern hemisphere and
home to a rare microbial ecosystem that
was only discovered in 1999. Researchers
Polar ice disintegration believe that rising temperatures caused
Polar regions have two kinds of floating the weakening of the ice shelf. When it
ice. Ice shelves are thick plates of ice that broke, the lake drained and disappeared.
form where glaciers flow into the sea. Sea ice has been faring no better. In
Sea ice forms when seawater gets cold 2000 and again in 2001, people were
16You can also read