GREEN KILLING MACHINES - The impact of renewable energy on wildlife and nature Andrew Montford - The Global Warming Policy ...
←
→
Page content transcription
If your browser does not render page correctly, please read the page content below
GREEN KILLING MACHINES
  The impact of renewable energy on wildlife and nature

  Andrew Montford

The Global Warming Policy Foundation
GWPF Report 36
GREEN KILLING MACHINES
The impact of renewable energy on wildlife and nature
Andrew Montford

ISBN 978-1-9160700-2-8
© Copyright 2019 The Global Warming Policy Foundation
Contents

 About the author                        vi
 Executive summary                       vii
 1   Introduction                         1
 2   Meeting demand from renewables       1
 3   Eco-disasters from eco-gestures     16
 4   Playing with demand                 17
 5   Squaring the circle                 19
 6   Environmentalists plan the future   22
 7   Conclusions                         26
About the author
Andrew Montford is deputy director of the Global Warming Policy Foundation.

vi
Executive summary
Renewable energy has developed itself a reputation as being environmentally friendly. This
report will show that this reputation is entirely undeserved. Far from improving the world
around us, wind, solar, biomass and even hydropower can be highly damaging. A renew-
ables revolution on the scale envisaged by global warming activists will see our landscapes
desecrated, our fields industrialised or turned to monocultures, and our wildlife slaughtered.
     Far from making the world a better place, renewable energy will destroy all we hold dear.
Is this really what environmentalism has come to mean?

                                                                                           vii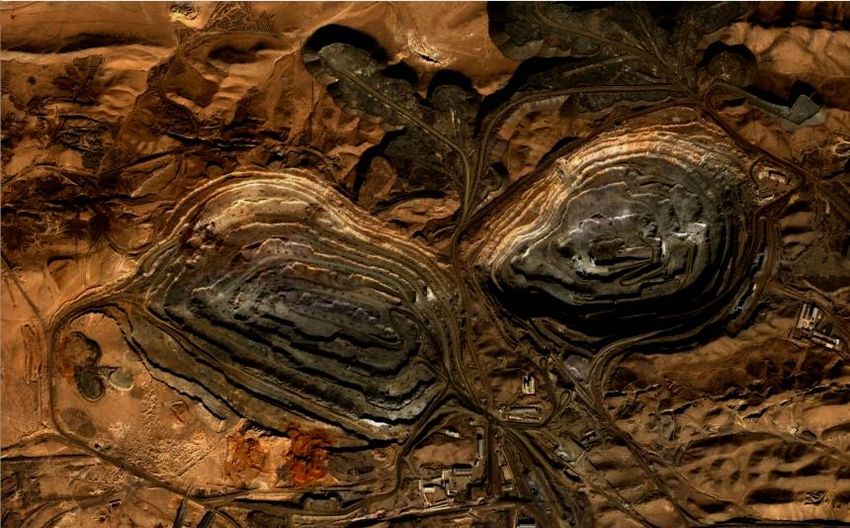
1    Introduction
Worries about global warming have led to a plethora of policy initiatives, but above all to
demands that energy production shift from fossil fuels to carbon-free energy sources, and in
particular to renewables. However, progress has been slow. The reasons are numerous, and
include nimbyism, planning difficulties, problems with integration into distribution grids,
and the very high price of energy from most renewable sources. The percentage of world
energy that is delivered by renewables therefore remains very low: windfarms, for example,
do not even register 1% of energy output. 1
    However, world energy demand is expected to grow by between 10 and 34% in the pe-
riod to 2060.2 Electricity needs are expected to grow even faster, with urbanisation and tech-
nological advances leading to a doubling of demand over the same period. This being the
case, governments are set on a considerable expansion of renewable capacity.
    Renewables have a carefully nurtured ‘green’ image, yet few people can be unaware that
they actually have a significant environmental impact. This report sets out to examine that
impact, in particular in the UK, both now and at the end of several more decades of expan-
sion. It then goes on to examine the response of those green groups whose raison d’être is
supposed to be the protection of the environment.

2    Meeting demand from renewables
How much more renewables capacity might be needed in coming decades? The late Pro-
fessor David Mackay examined how the UK’s energy system might be decarbonised in the
future, publishing his findings in a book entitled Sustainable Energy – Without the Hot Air.3
Mackay, a Cambridge engineer and chief scientist at the UK government’s Department of
Energy and Climate Change, looked at several different energy futures. However, he did so
only from an engineering point of view; the cost of the change – almost certainly mind-
boggling – did not form part of his analysis. He also freely admitted that he was being wildly
optimistic about what might be achieved. Nevertheless, his work is widely respected on all
sides for its plain and honest approach to the problems of decarbonisation.
    In the first part of his book, Mackay tries to determine just how much energy could theo-
retically be delivered by individual renewable technologies (finding that the total fell some
way short of what might have been hoped for). In this paper, I use Mackay’s analysis to show
the effects such a ‘maxing out’ might have on the environment. In the second part of his
book, Mackay looks at various ways of balancing energy supply and demand, using blends of
renewable and other energy sources and dramatic changes to the nature of demand. Others
have attempted similar analyses using Mackay’s data, and different assumptions and tech-
nology mixes. Therefore, a second focus of this paper is to examine what some of these
(allegedly) practical decarbonised energy systems might do to our surroundings.

Wind
With windfarms having sprouted in large numbers across the UK, the public is familiar with
the effect they have on landscapes. The impact is primarily from the turbines themselves,
but also from having to clear forests to make space for the windfarms, building access roads
and lastly, but by no means least, from the networks of electricity pylons that are required
to connect the turbines to the electricity grid. 4 However, there is also a considerable, and
detrimental environmental effect that goes largely unseen.

                                                                                            1
There are wildlife impacts, for example. The impact on bats is thought to be particularly
serious, with turbines causing pressure waves that make their lungs implode. One recent
study raised the possibility that whole populations of some bat species might be threat-
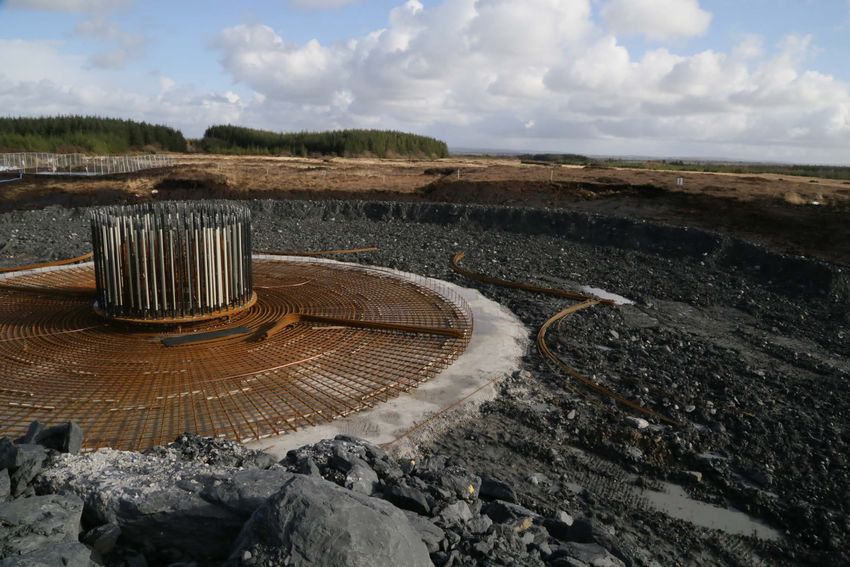
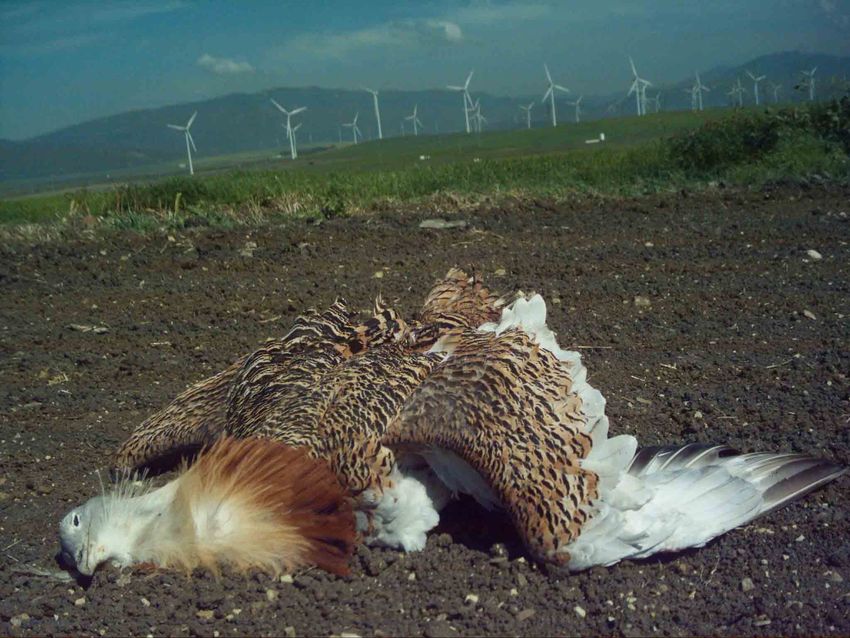
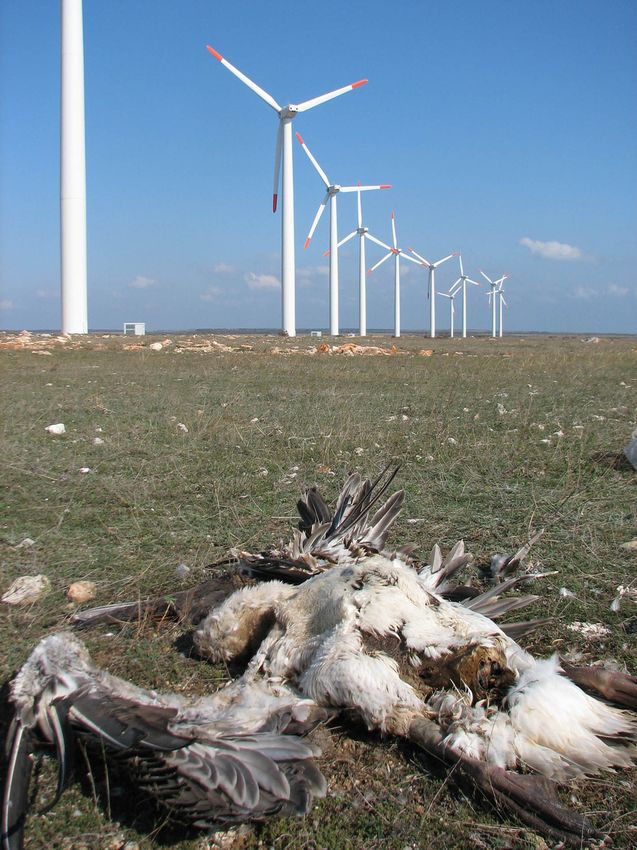
ened.5 Birds, and particularly raptors, may collide with turbines: direct collision might cause
20 avian fatalities per turbine per year although considerably higher numbers have been
mooted. There is a further death toll from power lines, with rates estimated at up to 100
per km/yr, mostly through collision. 6 The Beauly–Denny interconnector, which runs across
the Highlands of Scotland to connect windfarms in the north with consumers in the south,
might be expected to cause 11,000 avian fatalities each year. 7
Other effects are thought to be likely, but are either not yet proven or will only be seen
once there are more windfarms. For example, it has been shown that the noise from off-
shore windfarms can disturb marine mammals, but long-term detrimental impacts have not
yet been demonstrated. Barrier and displacement effects on birds have been demonstrated
though. One study found that gulls, white-tailed eagles, northern gannets and skuas are par-
ticularly sensitive to the presence of windfarms, 8 and a recent report suggested that more
raptors are now being killed by windfarms than through persecution 9 (some species sim-
ply fly around them though10 ). Rogue gamekeepers who persecute raptors are pursued by
bird NGOs with the full force of the law. Inexplicably, the same NGOs are all but blind to the
destruction wrought by windfarm operators.
Another disastrous impact of wind turbines comes from their manufacture. They use
extraordinary quantities of resources; an onshore turbine, for example, might need 1400
tonnes of concrete and 80 tonnes of steel in its foundations alone. 11 Production of neither
of these commodities is traditionally viewed as ‘green’. For offshore turbines, the figures are
considerably larger. 3000-tonne concrete bases are already being installed, and bases many
times bigger being considered.12 Floating wind turbines are no better: those in the recently
opened Hywind pilot project off Peterhead have steel bases that are 91 m long and weigh
nearly 3500 tonnes.13
The magnets used incorporate large quantities of neodymium. Most of the world pro-
duction of this rare earth element comes from Inner Mongolia, where mineral extraction has
had an appalling effect on the environment (the image overleaf shows a rare earth mine in
Baotou, Inner Mongolia).
Mackay imagined covering the windiest 10% of the UK with turbines. 14 In keeping with
the theme of his book, this is wildly ambitious, but would barely raise enough energy to
cover the typical commute to work, 15 and certainly not enough to get home again. This is a
very poor return for such a large area of land. However, the situation is even worse, because
as a glance at Figure 1 shows, the windiest areas of the UK are the upland areas like the
Cairngorms, the Pennines and the Welsh Mountains, and the west Coast of Scotland.
Most of these areas are likely to be off limits for windfarm development because of their
environmental sensitivity, so delivering the paltry amounts of energy envisaged will require
use of less windy areas and a correspondingly larger land area. And yes, we can reduce the
environmental impact by going offshore, but even if we ignore the cost implications, think
about the environmental impact. To cover just the energy requirements of daily commutes,
we would need a 4-km wind band of turbines right round the UK in shallow waters, and
another 9-km strip in deeper waters. 16 Hundreds of millions of tonnes of concrete or steel
would be required.
It barely needs to be pointed out that the environmental impact of such changes would
be devastating. Figure 2 reworks the UK windspeed map, highlighting the windiest 10% of
Opposite: How many more dead birds? 3Figure 1: UK wind speed map
Windier areas are in darker shades of blue. Source: Met Office.
the UK land area, as mooted by Mackay. Assuming that much of this area turns out to be
off limits to development, then the country would be forced to go into less windy areas: the
area in grey is the next windiest 20% of the UK. As can be seen, the Southern Uplands, much
of the highlands of Scotland, and the Welsh mountains would still have to be completely
industrialised. At this level of windfarm installation, the politically correct refrain of conser-
vation organisations like the Royal Society for the protection of birds (RSPB) – that windfarms
are acceptable if correctly sited – are likely to become meaningless. Most locations on which
windfarms could plausibly be built would be covered in turbines in practice.
Mackay’s 61,000 turbines might be expected to cause upwards of 1 million avian fatali-
ties per year and perhaps even several million. 17 Although appalling, it is worth noting that
these numbers are small compared to the estimates of the numbers of garden birds taken
by domestic cats each year - perhaps as many as 55 million.18 However, it is worth noting
that cats tend to take weak and sickly individuals; 19 wind turbines and electricity cables are
not so discriminating. In addition, while cats will take common garden species, windfarms
tend to affect:
• species that are rarer or populations that are already under pressure
• species that, because of their foraging habits or sensitivity to disturbance, are likely to
be heavily impacted.
One study suggests that the birds most sensitive to windfarms live in precisely those areas
where they will have to be installed in practice (see Figure 3). 20 There will simply be no escape
for many of our rarest bird species. The result is likely to be a disaster. Is this what the RSPB
really, really wants?
Opposite: Rare earth mine in Baotou 5Figure 2: Where can we put all those turbines?
The windiest 10% of the UK is shaded black. The next windiest 20% is in grey.
Bats would not escape either. Although bats are not found on the highest mountains, 22
as noted above, these windiest areas are likely to be off limits to windfarms anyway. How-
ever, as wind farms are pushed down into less windy areas, they will increasingly come into
contact with bats. For example, the distribution of the Pipistrelle bat, one of the UK’s most
common species, shows a considerable overlap with areas that are going to have to be used
for wind farms. One recent study estimated that the existing wind turbine fleet in the UK
might be slaughtering 80,000 bats per year. 23 With Mackay envisaging an increase of nearly
an order of magnitude in the number of turbines, it is conceivable that 700,000 bats per
year would be killed by the renewables drive, a startling number, when set against a total
estimated UK bat population of 2.6 million individuals. 24
And while it might appear that putting wind turbines out at sea is a more benign ap-
proach (if a much more expensive one), in fact it is likely that there would still be an ap-
6Highly windfarm sensitive
Moderately windfarm sensitive
Others
Figure 3: Distribution of windfarm-sensitive bird species across Scotland. 21
palling price to be paid by wildlife, because where birds and marine mammals can take de-
tours around small windfarms, installations on the scale envisaged by Mackay would almost
certainly make it impossible for wildlife to avoid. Who knows what the impact might be?
And all this to deliver just one third of energy demand. 25
Solar
With solar panels now widely installed around the world, the impacts are, as for wind tur-
bines, relatively well understood. The impacts are slightly different for the three main tech-
nologies:
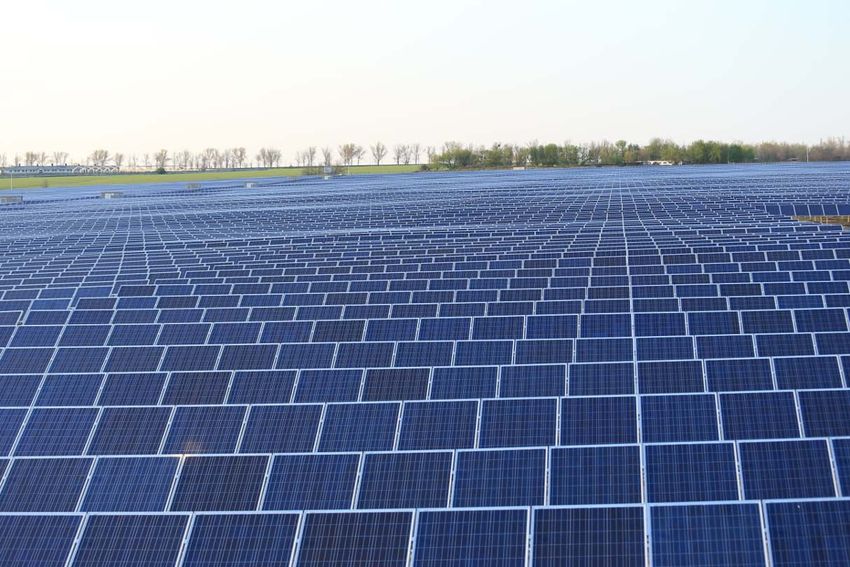
• solar photovoltaics (PV), the familiar solar panels in vast farms or on domestic rooftops
• concentrating solar power (CSP) installations, in which mirrors focus the rays of the
sun to a point, heating water, which then drives turbines
• simple heating of domestic hot water using rooftop panels.
For solar PV, the most obvious impact is on the landscape, with a PV installation requiring
many acres of space. They are entirely alien to natural landscapes. In addition, there may be
some impacts on wildlife: with loss of biodiversity and collision impacts for birds mooted.
Barrier effects similar to those caused by windfarms are also likely.
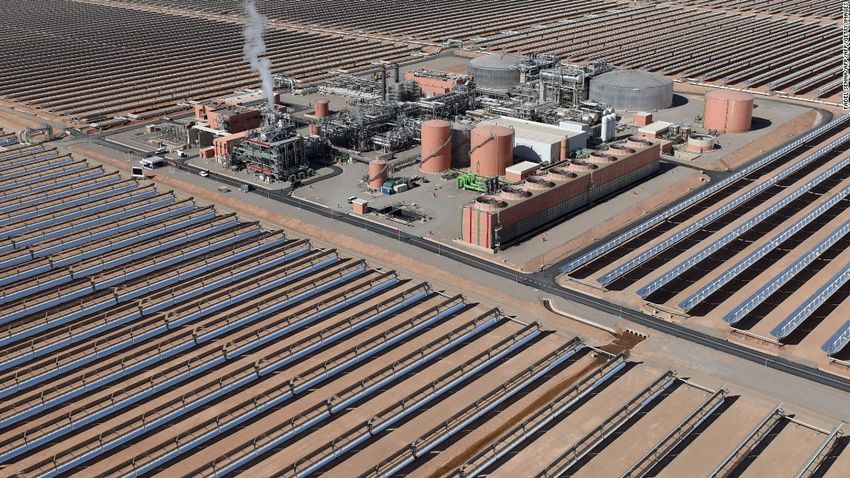
Most of these effects are also relevant to solar CSP installations. This technology is even
more land-hungry than solar PV, because they are even more inefficient – the approach is
therefore to set up enormous CSP installations in places where land is cheap and the sun
shines a lot, typically deserts. However, despite popular belief, deserts are rarely empty. The
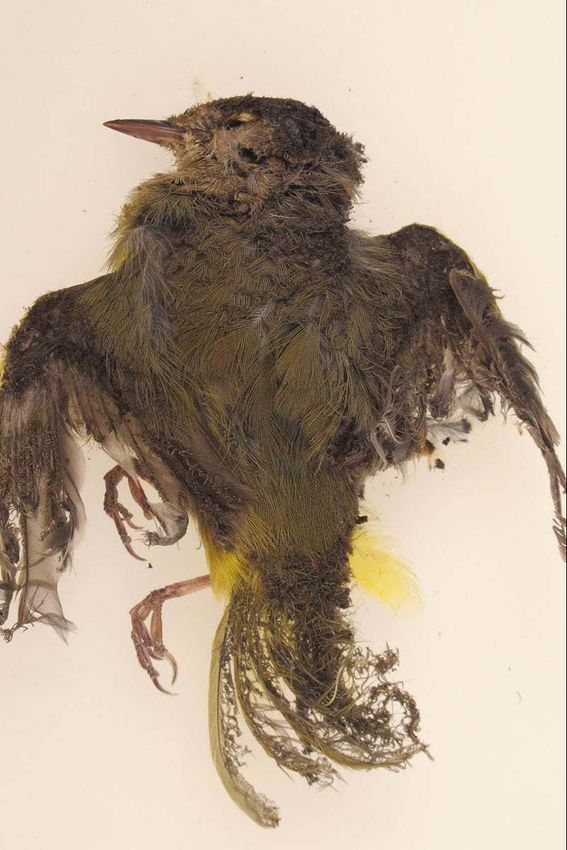
media have carried prominent stories about birds being literally burned up on the wing as
they pass through the concentrated solar rays, with staff at the sites referring the corpses
spinning to the ground as ‘streamers’ (see opposite p. 9). Subsequent research has found
that in many cases, the flight feathers were only singed, leading to a loss of the ability to fly
7Figure 4: Common pipistrelle bat distribution.
Source: Bat Conservation Trust.
and a slow death through starvation or predation. 26 It was noted during planning for the
Ouarzazate solar power station in Morocco that there was a substantial risk to local nest-
ing birds in the area, including the rare mourning wheatear. The project has gone ahead
anyway.27
The manufacturing processes for photovoltaic panels are also far from green. Many pan-
els are manufactured from silicon, which goes through a two-stage refining process to bring
it up to the high levels of purity required. The first stage takes place in an arc furnace, using
prodigious amounts of energy, the second also requires high temperatures and involves use
of strong acids.
Another environmental impact that is only now beginning to be understood is the prob-
lem of what to do with solar panels at the end of their lives. It has already been shown that
hazardous materials are washed out of broken solar panels in a matter of weeks, 28 so the is-
sue is likely to become a worldwide problem as earlier generations of panels reach the end of
their lives. Mountains of redundant solar panels are already appearing in some countries. 29
While recycling processes do exist, they involve a combination of expensive mechanical pro-
cedures and environment-unfriendly chemical ones. And because many of the products of
these processes – silicon for example – are low value, the pressure to cut corners, to landfill,
or simply to leave the panels to decay will be intense. 30
So what will the UK look like if we push solar energy as far as we can? David Mackay
considered covering 5% of the UK with solar PV farms, which would deliver enough energy
Opposite: Carpet the south with these? 9to get the typical commuter to work and back again. Covering every south-facing roof as
well would deliver a little more. 31
5% of the UK is a significant area, equivalent to Cambridgeshire, Gloucestershire, Lan-
cashire and Staffordshire combined. 32 According to Mackay, this level of ambition would
require the UK to install 100 times more solar PV than has been installed worldwide to date.
Technology offers no way out either because, as Mackay notes, solar panels are already close
to their theoretical maximum efficiency in converting light to electrical energy. Solar PV may
become cheaper in future, but will still require just as much land.
As Mackay notes, the idea that we do any of this is rather implausible. 33 He does suggest
that wind turbines could be installed on the same sites as solar panels, but in the UK at least,
the places of high insolation (Figure 5a) are not the same as the windiest places (see Figure 1),
so in reality the land required for solar farms would probably have to be in the south of
the UK, where there is already considerable pressure on the natural world from housing.
And if the best quality farmland is to be kept for food production, then solar panels will
have to go on poorer quality land (Figure 5b). The overlap between high insolation and
poor-quality land puts many much-loved landscapes under threat. Dartmoor? Exmoor? Do
environmentalists really want to see precious landscapes covered in solar panels (and all the
pylons and wires required to connect them to the grid)? In what world would this protect
rural England, or the birds and other animals that live in it?
Non-agricultural Grade 4
Grades 1–3 (best) Grade 5 (worst)
(a) Insolation is highest in the south. . . (b) . . . where land quality tends to be high
Figure 5: Where should the solar panels go?
Opposite: Thousands more ‘streamers’? 11Large-scale hydro
Hydroelectric power plays a key part in electricity generation around the world. In particular,
countries that are lauded for generating electricity almost entirely from renewables can only
do so because they have ample hydroelectric resources. Costa Rica, the best known example,
also has a significant amount of geothermal energy available.
The impacts of large-scale hydro projects are significant. Many are a result of the con-
struction phase, but the unavoidable changes to ecosystems caused by hydroelectric dams
are now seen as very serious, with one green NGO citing ‘permanent loss of freshwater
and terrestrial habitats, drainage of wetland and bogs, and subsequent loss of habitat and
species diversity’.34 A recent scientific review of the sustainability of large-scale hydro power
spoke of dams:
disrupting river ecology, causing substantial deforestation, generating loss of aquatic
and terrestrial biodiversity, releasing large amounts of greenhouse gases, displacing
thousands of people, and affecting the food systems, water quality, and agriculture near
them.35
Fish migration can be blocked entirely, and the use of fish passes may only provide a par-
tial solution. There can be ongoing problems with siltation and accumulation of nutrients
behind the dam, depriving ecosystems and farmers further downstream of the benefits. Hy-
droelectric dams also emit carbon dioxide and methane, thus making it hard to understand
why climate campaigners tend to see them as part of the solution rather than part of the
problem.
A recent article by the doyen of environmental reporters, Fred Pearce, explained how
damming of rivers in the Sahel region, south of the Sahara, had caused enormous damage
to ecosystems and a great deal of human suffering:
By blocking rivers, [dams] are drying out lakes, river floodplains, and wetlands on which
many of the poorest in the region depend. The end result has been to push more and
more young people to risk their lives to leave the region. . . The Manantali Dam is esti-
mated to have caused the loss of 90 percent of fisheries and up to 618,000 acres previ-
ously covered by water.36
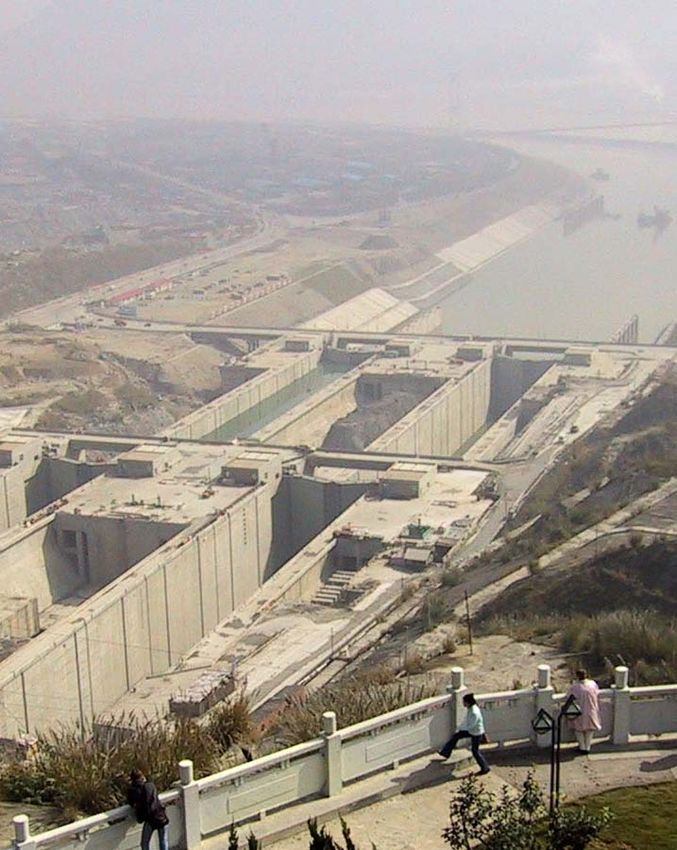
An article in Scientific American wondered if the Three Gorges Dam in China represented,
not a way of saving the planet, but an environmental disaster. 37 The dam has a capacity of
22.5 GW. A large gas-fired power station is only one tenth of the capacity, but has consider-
ably less than one tenth of the environmental impact.
As Mackay points out, generation of hydropower needs two things: a large quantity of
rainfall and a large drop in altitude. These requirements essentially rule out any schemes
placed in lowland Britain: the amount of electricity generated would simply be too small.
However, even in highland areas of Britain, there is not much scope for generating large
quantities of electricity. If every river was dammed and every drop of water was collected
and exploited, you still might only get 7 kWh/day. In reality, a much smaller catchment would
prove to be exploitable and Mackay guesses this might generate as little as 1.5 kWh/day. This
is a paltry return for such a large environmental impact.
Damming most of the rivers in the West Highlands (where power per unit area is great-
38
est ) with the accompanying ‘permanent loss of freshwater and terrestrial habitats, drainage
of wetland and bogs, and subsequent loss of habitat and species diversity’ is clearly not
what most environmentalists imagine their brave new green world would look like. In real-
ity, concern over the environmental impacts of hydroelectric schemes is now so great that
12 Opposite: How many more dams?new large-scale schemes are now mostly restricted to the developing world, where the dev-
astation is kept out of sight.
Nevertheless, the green enthusiasts in Whitehall still think it would be possible to double
the hydroelectric capacity in the UK, mostly through relatively small projects, 39 so there re-
mains considerable scope for this particular renewable technology to destroy more pristine
environments.
Tidal
Tidal power comes in three main variants:
• barrages, which capture a body of water in an estuary at high tide and release it through
turbines in the barrage to generate power
• tidal lagoons, which are similar, but with artificial bodies of water created by building
retaining walls
• tidal flow, where turbines are placed directly in streams of moving water to generate
power in much the same way as a wind turbine.
Despite decades of research, all of these technologies remain in their infancy, with no tidal
stream plants or lagoons in commercial operation and few barrages. The impacts are there-
fore relatively poorly understood. 40 However, for all three types of tidal power, impacts on
fish and mammals (sound, strike, loss of habitat) and sedimentation, are considered possi-
ble,41,42 and indeed some environmental NGOs have described these technologies as ‘high
risk’.43
The evidence44 from the Rance tidal barrage in France, which has been operational since
1966, suggests that there will be:
• severe disruption during construction and then ten years to re-establish equilibrium
• profound changes to ecosystems, with loss of flat fish and sand eels
• fish mortality due to turbines, and sudden changes in water levels
• siltation, converting land within the basin into salt marsh, and causing loss of fish nurs-
eries and bird feeding grounds
• a new equilibrium ecosystem very different to what was there before.
Computer simulations of the effects of tidal flow energy have suggested that the impacts are
so significant that the amount of energy extracted from the tides might need to be severely
restricted, typically to about 20% of the theoretical maximum and sometimes less. 45 An anal-
ysis from the RSPB has found that as little as 168 km 2 of the UK’s waters can be categorised as
‘prime opportunity’ for tidal stream once the environmental and other constraints are taken
into account.46
Mackay is relatively optimistic about tidal power, and in particular tidal stream power,
possibly because it is less likely to come up against public opposition – the environmental
costs are out of sight and out of mind – and possibly also because, as noted above, his anal-
ysis does not consider costs. He estimates that it might be possible to generate 11 kWh/day,
with 9 kWh/day of this coming from tidal stream plants located at key points in the seas
around the UK. It is worth noting, however, that he cannot assess whether any of these sites
are exploitable in practice, and he was presumably unaware of the need to restrict output
to limit environmental damage.
14Another 1.5 kWh/day would be delivered by turning the Wash and Morecambe Bay into
tidal lagoons, and a little more from a Severn barrage. The Severn barrage scheme was of
course cancelled in 2014, after an outcry over the potential environmental damage, but pro-
posals along similar lines have been mooted since the 1920s and are resurrected every five
years or so.
The Rance barrage is a small scheme, with a tidal basin of some 22 km 2 . The Severn bar-
rage scheme on the other hand, would have been a colossal 500 km 2 , with the environ-
mental impacts to match. It would have led to the loss of the intertidal mudflats along
the estuary, with a devastating effect on bird and fish species. It would potentially also
have increased flooding upriver as far as Gloucester. MPs who looked at the Rance barrage
professed themselves shocked by the environmental impact. 47 It is little wonder that the
scheme was quashed. Nevertheless, proposals for tidal barrages continue to be mooted,
with the Dee, Solway and Humber estuaries all proposed as plausible sites. Lagoons have
been proposed for Cardiff, Newport, Bridgwater Bay, Colwyn Bay, and West Cumbria, with
another in Swansea now moving closer to reality. 48 The RSPB has described tidal lagoons
as a high-risk technology in terms of environmental impact. With so many vast schemes
possible, the chance of devastation is dramatic.
Biomass and biofuels
Since the European Union and environmentalists started to encourage the use of liquid bio-
fuels some ten years ago, a plethora of allegedly ‘green’ technologies have been promoted:
domestic and industrial biomass boilers, liquid biofuels, and so on. As the ‘industry’ has ex-
panded, the adverse effects of such policies have become clear.
In the UK, government policy to increase domestic energy prices to encourage efficiency
has led to a boom in the installation in wood-burning stoves, and the inevitable felling of
woodlands to fuel them.49 On a larger scale, the Drax power station in Yorkshire consumes
wood on such a scale that pellets are being imported from North America, the forests there
being clearcut to meet Drax demand. 50 Unfortunately, the carbon emissions of biomass
appear to be similar to those of coal, and therefore approximately double those of gas, 51
and the associated particulate emissions are said by one concerned NGO to be ‘worse than
coal’.52 As an energy source, biomass seems to have few redeeming features. Nevertheless,
the devastation is being replicated elsewhere. In France, the Gardanne power station will
soon burn 850,000 tonnes of wood each year, half of it imported. 53 Even tree stumps are
being extracted to burn, leaving nothing for the soil fauna and leading to loss of soil fertil-
ity and increased erosion. In its Black Book of Bioenergy., wildlife NGO Birdlife International
notes that not even protected forests are escaping the axe in the rush to ‘earn’ renewable
energy subsidies.54
Outside of the developed world, biomass burning is of course even less benign. In poorer
countries, some 2.5 billion people rely on biomass for cooking, with wood, charcoal and
dung the main forms used.55 Charcoal production is often inefficient and leads to deforesta-
tion, while burning dung rather than ploughing it back into fields makes the soil less fertile.
Meanwhile, the rush to increase the use of liquid biofuels has led to hikes in food prices
and starvation across the world, land grabbing in Africa and elsewhere, and the felling of
rainforests to make way for oil palm plantations, which one writer has described as ‘one of
the 21st century’s greatest ecological disasters’. 56 Nearly half of palm oil consumption in
Europe is for incorporation in biodiesel, 57 and the EU has only recently moved towards a
15phase out of palm oil in biofuel by 2021. And all this environmental destruction actually
seems to have exacerbated the global warming problem: according to one report, carbon
dioxide emissions from biofuels are significantly higher than those from diesel, with palm
oil the worst biofuel of all.58
All this destruction is virtually pointless. As Mackay notes, biofuels are an extraordinar-
ily inefficient way of generating energy – like so many other renewables their demand for
land makes them almost entirely uneconomic: if we took all of the UK’s agricultural land,
we could generate barely enough energy to power our commuter’s journey home each day.
Nevertheless, most observers of the market for renewable energy expect dramatic increases
in the use of biofuels. For example, the World Energy Council suggests an increase by a factor
of seven by 2030.59 So while environmentalist concerns have caused ‘one of the 21st cen-
tury’s greatest ecological disasters’, it appears that this is just the beginning of a headlong
rush into environmental armageddon. The demand for land to support the biofuels expan-
sion will increase inexorably and more precious wild places will be lost. The UKERC Energy
Data Centre has suggested that marginal lands like the African savannah and the Brazilian
cerrado might have to be brought into play, although caveating this idea with a note that
the concerns over the environmental impact might be considerable. 60
3 Eco-disasters from eco-gestures
Small scale and in-river hydro
Small-scale hydro is often presented as more benign than many other forms of renewable
energy, but the impacts on fish seem just as serious, and possibly more so, because mitiga-
tion measures are seen as less urgent. 61 Once they get larger, the impacts on the landscape
can be severe. The Bute Inlet scheme in Canada (now aborted) involved the building of 443
km of power lines, 267 km of roads, and 142 bridges, as well as diverting 17 different rivers. 62
Mackay notes that these schemes will always be irrelevant to national energy genera-
tion:63 a seven-fold increase in capacity would still only deliver 1.5 kWh/day. Nevertheless,
the Environment Agency has identified as many as 26,000 suitable sites. This seems like quite
a lot of rural development and quite a lot of damage to the natural world for very little return.
Wave
While wave power is often touted as being likely to play a major role in the future energy
mix in the UK, in fact it has never been deployed on a commercial basis, so any assessment
of the likely impacts is largely theoretical. Possible impacts include coastal erosion, possible
pollution from equipment, impact on fish and the wider marine ecosystem, noise, as well as
effects on local industries such as fishing and leisure.
Mackay points out that the amount of power that could be extracted from wave power
is very limited. A boom along half of the UK’s Atlantic seaboard could deliver a meagre
4 kWh/day even with absurdly optimistic predictions about efficiency. So wave power is es-
sentially irrelevant to the UK’s future. However, this doesn’t mean it will not be tried and that
the environment will not have to endure the unpleasant side effects.
164 Playing with demand
Mackay is not oblivious to the impossibility of the UK meeting current energy demand using
renewables, and the second part of his book is an attempt to try to make ends meet. He
does this using a multi-pronged approach. Firstly he reduces his target from the energy
required for a typical wealthy person to the amount required on average, losing in particular
the enormous energy footprint of the long-haul flights that are mostly the preserve of the
better-off. And while the lifestyles of today’s rich might normally be expected to be enjoyed
by many more people in future, it is not unreasonable of Mackay to try to match current
overall demand.
He reduces demand by assuming massive changes to the economy, with transport mostly
electrified (producing efficiency gains since electric motors are more efficient than internal
combustion engines) and heating either not required (through better insulated homes) or
produced by heat pumps. And even then, as he freely admits, the energy embedded in im-
ports and food is not taken into account in his figures, so it remains somewhat doubtful
whether he really has ‘squared the circle’.
Electric vehicles
Playing with demand in this way has not been a happy approach in the past. One early at-
tempt to reduce carbon emissions in the UK was the Blair government’s decision to encour-
age adoption of diesel cars, on the grounds that their carbon emissions were considerably
lower than those of their petrol counterparts. The move is now widely seen as an environ-
mental disaster: the high levels of particulate emissions from diesel engines are said to be
causing 40,000 deaths from respiratory disease every year (although see below). The mayor
of London, Sadiq Khan, even declared it a public health ‘emergency’. 64 The result has, of
course, been further pressure to switch to electric vehicles.
Unfortunately for their backers, there is now scientific evidence emerging that EVs are
not actually better than their fossil-fuel equivalents on the particulates front. Contrary to
popular belief, the vast majority of transport-related particulate emissions are not from the
engines, but instead from tyre and brake wear and so on. 65 However, because EVs are cur-
rently on average 25% heavier than ordinary cars, their non-exhaust particulate emissions
completely counteract their cleaner exhausts. In other words, the switch to EVs currently
looks as though it will make little difference to particulate emissions.
What about the other environmental impacts of EVs? There are already strong hints that
they are not going to be nearly as benign as their backers claim. Indeed, quite the opposite.
The batteries in Tesla electric cars include substantial amounts of lithium and cobalt, and are
said by the US Environmental Protection Agency to have:
. . . the highest potential for environmental impacts [including] resource depletion, global
warming, ecological toxicity, and human health impacts.
Environmentalists are already concerned about the impacts of mining of both elements,
with one lurid report describing ‘plumes of sulphur dioxide choking the skies, churned earth
blanketed in cancerous dust, [and] rivers running blood-red’. 66 Meanwhile, cobalt mines in
the Democratic Republic of the Congo have been accused of using child slave labour and
having appalling working conditions. 67 The copper-and-cobalt mining areas around the
Congolese city of Lubumbashi are said in one study to be ‘among the ten worst polluted
places in the world’.68
17And all this before the projected 50–100-fold increase in EV numbers in the next decade
and a half.69
And the rest
Other aspects of Mackay’s attempts to reduce demand are less alarming. In terms of envi-
ronmental impact, insulating old houses and installing heat pumps are largely benign ap-
proaches, although there are other concerns, not least the cost. Ground-source heat pumps
tend to be inadequate in very cold weather and so require backup from traditional heat
sources. Blown cavity wall insulation frequently leads to damp and is therefore potentially
disastrous for homeowners. One estimate suggests as many as three million homes may
have been affected.70 But these are not the concern of the environmentalist.
5 Squaring the circle
After proposing all these measures to reduce demand, Mackay ultimately comes up with a
series of plans to meet the remaining demand, and invites interested members of the public
to come up with their own proposals too. To facilitate this, he and his colleagues at the then
Department of Energy and Climate Change set up the 2050 Calculator website, 71 a simple
web interface that allows users to develop their own plans to meet the government’s decar-
bonisation target while balancing supply and demand.
As far as Mackay’s own example plans are concerned, some elements are consistent. One
of these is the idea of using 30,000 km 2 – focusing on poorer quality agricultural land – to
grow wood and special energy crops such as miscanthus grass. As noted above, the problem
with this idea is that most of the poor-quality land – agricultural grades 4 and 5 – is off-limits,
being of environmental importance or otherwise unsuitable for cultivation of energy crops.
That leaves 85,000 km2 of suitable land in Great Britain, the vast majority of it in England. 72
A small part of this is high-grade land, which will not be used unless the price is right. That
means that most of the land used will be of grade 3, which is described as ‘moderate’ or
‘good’ land. This is the bread and butter of British farming, representing the vast majority of
agricultural land. But a third of it would be used, under Mackay’s plans, for a single crop. It’s
hard to equate this with care for the environment.
Another common element is that a proportion of biofuels is used in the transport sys-
tem. Unfortunately, this would require use of a further 12% of the UK’s land area, another
30,000 km2 of grade 3 land.73
The numbers don’t really give a feel for the impact, so Figure 6a tries to do this. Each
square is approximately 1000 km2 and there are 60 of them, 30 light blue for biofuels and
30 dark blue for biomass. The distribution is intended to be approximately representative of
where the suitable land is located, so the mountainous regions, scenic districts in the South-
West and the high-quality farmland of Cambridgeshire are avoided. Data on land availability
in Northern Ireland is not consistent with the rest of the UK, 74 but I have assumed that some
energy crops will be planted there. What is clear is that much of the UK would essentially
become a monoculture.
After that, the environmental impact varies depending on which of Mackay’s plans is
looked at. For example, in Plan G, he proposes generating 32 kWh/day from wind power.
The area required would depend on where the windfarms were located, but it is presum-
ably unlikely to be onshore, since so much of the suitable land is environmentally sensi-
Opposite: EVs still produce particulates 19tive. Figure 6b assumes that they would be placed in deeper offshore waters and the 26
1000 km2 squares shown represent the area Mackay suggests would be required, with place-
ments based those shown in his map. 75 With this arrangement, birds in Scotland are largely
unaffected, but it is hard to imagine that traversing 20 miles of wind turbines 76 might not
be a problem for birds further south, such as the gannets that feed on the Dogger Bank. 77
You could build more windfarms but in smaller blocks and spread them out more, but then
more birds are affected. The choice is between a cull of a large population or a massacre of
a smaller one. Enthusiasts for wind power must choose.
From the text of Mackay’s book it is possible to get a sense that he realises the absurdity of
most renewables. In several of his plans he uses a large proportion of nuclear energy and/or
‘clean coal’. However, his book was published in 2009, thus predating the shale revolution.
Mackay later became something of an enthusiast for shale gas, noting its carbon footprint
was much better than that of coal, 78 so it is likely that he would have switched to natural gas
in these plans.
But circumstances have also changed for another of Mackay’s ideas. While he had limited
enthusiasm for solar panels in the UK – as we have seen, his ideas for bioenergy mean that
there was essentially no space for this other than a small amount produced by covering all
rooftops with solar panels – he was keen on the idea of importing solar energy from other
countries. As he pointed out, the world’s current energy needs can theoretically be provided
from a mega-CSP power station with an area of 1 million km 2 (a square measuring 1000 ×
1000 km); its future energy could come from two such areas. Whether this is at all plausible
in the political world that exists after the Arab Spring is another question.
And the environment suffers too, despite the popular idea that deserts are empty voids.
In the USA, the Ivanpah CSP station had to be scaled back because of the risk to the endan-
Biofuels
Biomass
Wind turbines
(a) (b)
Figure 6: Impact of renewables.
(a) 60,000 km of biofuels and biomass; (b) 26,000 km 2 of offshore wind turbines.
2
Opposite: Ourzazate: 1 million km 2 of this? 21gered desert tortoise; similar problems have affected many other CSP power stations. 79
And there is little popular understanding of another environmental problem with solar
power stations: they actually consume quite a lot of water. With CSP, most of this is for the
cooling systems, but some is also needed to ensure cleanliness of the mirrors so that power
output is maintained at high levels. The huge Ouarzazate 1 station in Morocco has an area of
4.5 km2 and uses 1.7 million m3 of water per year80 – much more than an equivalent coal-fired
power station. It is no accident that the plant is built near a major reservoir. Scaling these
values up, Mackay’s mega CSP plants would use 756 billion m 3 of water per year, which is
nearly a third of the amount of water that falls in the Arab world each year (2576 billion m 3 ).
The idea of scaling up Ouarzazate I is therefore obviously absurd. 81 Fortunately, the second
and third phases of the Ouarzazate station use a dry cooling system, which although using
less water, is also less efficient at generating electricity. And solar PV appears to be little
better. The Adani solar power station in Tamil Nadu, India, uses 200,000 litres of water per
day to keep the panels clean.82
It is probably also not fair to try put the energy burden of the whole world in North Africa
– Americans and Asians have their own deserts. Mackay says that 340,000 km 2 might be
required to power Europe and North Africa; scaling up on the basis of a dry-cooled power
station suggests that 6 billion m3 of water might be needed. This is about 12% of what North
Africa currently extracts in ground and surface water. 83 In a such a dry region, this is probably
unsustainable and almost certainly environmentally disastrous.
6 Environmentalists plan the future
Mackay would probably not disagree with most of what I have written above. As he put it in
his book:
If you don’t like these plans, I’m not surprised. I agree that there is something unpalat-
able about every one of them. Feel free to make another plan that is more to your liking.
While many might use a stronger term than ‘unpalatable’, this section examines a few of the
proposals put forward by others. Usefully, a range of pathways are presented on the 2050
Calculator webpage, and several of these come from green NGOs, so we can see how envi-
ronmentalists hope to balance the competing demands of humanity, the natural world, and
their own fundraising rhetoric. The proposals I will consider come from Friends of the Earth
(FoE), the Sustainable Energy Association (SEA), and the Campaign to Protect Rural England
(CPRE). In addition, I will discuss an RSPB plan, which although based on the 2050 calcula-
tor is not published in the same format. 84 Unfortunately, the 2050 Calculator does allow
users a considerable degree of leeway about how they make ends meet, and all three green
NGOs exploit this to the maximum. For example, the core of FoE’s plan is a near-halving of
demand,85 achieved by moving passengers to public transport and road freight to rail, elec-
trifying transport, manufacturing and cooking, and reducing average room temperatures to
17◦ C. This is, of course, all rather implausible.
In addition, the calculator allows choices in energy generation that are hard to justify with
current levels of technology. A significant proportion of FoE’s energy is going to be supplied
by gas/biogas power stations equipped with carbon capture and storage (CCS), despite the
fact that CCS for gas may never be economic at the low load factors envisaged (and despite
FoE’s vehement opposition to shale gas developments). 86 Wave and tidal stream turbines
are also assumed to carry a share of the burden, despite never having been proven at scale.
22With so many drawing board technologies being considered it is hard to understand why
nuclear fission is not on the list too.
Nevertheless, even with these dramatic reductions in demand, the green NGOs still come
up with plans that will alarm anyone who cares about the natural world.
Bioenergy
Both FoE and CPRE plan to plant vast areas of bioenergy crops. 87 This seems an inexplicable
position for organisations that claim to be opposed to monocultures. 88 Indeed, in the case
of CPRE it would appear to be a direct contravention of their mission to protect rural Eng-
land: biofuels on this scale would have an appalling impact on landscapes, wildlife and rural
economies. What is worse, the underlying calculations assume that there will be compound
growth in yields, sustained for over 50 years. 89 This gives – on paper at least – a considerable
reduction in the amount of land required, but if the improvement does not materialise (and
we should remember that most green groups oppose genetically modified crops, the most
likely source of yield gains), a much larger area will have to be taken out of food production
and replaced with energy crops. Rural England will lose, and the campaign for its protection
will be the culprit.
The RSPB, who, you might imagine, would be keen to avoid covering agricultural land
with energy crop monocultures, claims that it will use much less land 90 for energy crops.
However, it is only able to do this by assuming implausibly high energy yields per acre. 91
In reality, they would probably need 10,000 km 2 to generate the power they want. Given
that they have identified only a fraction of that area with a low ecological risk to birds and
wildlife,92 its own plans would be just as damaging to landscapes, wildlife and of course birds
as those of CPRE and FoE.
But all of these groups pale into insignificance next to the Renewable Energy Association
(REA), which believes that we should cover a quarter of the UK’s main agricultural land in
energy crops. One wonders what CPRE has to say about this.
Onshore wind
Green groups are also surprisingly keen on onshore wind, with FoE wanting 9000 turbines
and the RSPB envisaging up to 17,000. As we have seen, these windfarms are going to kill
large numbers of birds and bats and cause terrible pollution in China. Thousands of square
kilometers of mountain landscapes would be desecrated. 93 The blow is softened somewhat
because the calculator assumes that onshore wind farms can capture energy at a rate of
2.5 W/m2 , implying land use of 4000 and 7000 km 2 for FoE and the RSPB, respectively. How-
ever, Mackay has stated that 2 W/m 2 is the absolute maximum likely onshore – a typical value
for an existing windfarm would be 1.4 W/m 2 , and these figures are likely to be lower in fu-
ture as the best sites are increasingly occupied and windfarms need to be installed on lower
ground.94 Thus the correct figures for the land required may well be at least 5000 km 2 for
FoE and 8000 km2 for the RSPB.95
Offshore wind
Offshore wind is a similar story, with FoE and the REA wanting 12,000 5.8-MW turbines oc-
cupying 13,000 km2 and the CPRE wanting even more. The RSPB’s High Onshore scenario
23sees only 4 km2 of turbines, although there are 33,000 km 2 in its High Offshore plan, which
would present a considerable barrier to ocean birds and mammals. 96
The areas involved are monstrous enough. Now consider the pollution. A 2 MW wind
turbine apparently includes around 350 kg of neodymium in its magnet. If we scale that
up proportionally for the larger turbines needed, a ton of neodymium may be required for
each machine in the RSPB’s plans. With an optimistic lifetime of 20 years, that will mean
between 1000 and 3000 tons per year of extra production. World production is currently
21,000 tons per year, so we are considering a 10% increase in world production to meet the
extra demand from the UK alone. It is hard to imagine the environmental devastation if other
countries plan their energy systems on the same basis.
Large-scale hydro
Despite the RSPB’s horror of hydroelectric schemes, other green groups seem quite keen
to use them. FoE envisages a near-threefold expansion of large-scale hydropower, with
100 km2 of new reservoirs exploiting – and if the RSPB is to be believed, irreparably dam-
aging – a catchment area of 5500 km 2 .
And recall that these figures are predicated on reducing demand by more than 40%,
which many would suggest take them into the realms of the implausible. Add to that the
reliance on technologies that are unproven at scale (CCS and storage, tidal flow, wave) or
that are likely to be impractical (solar in deserts) and the whole exercise starts to look like
fantasy. When reality bites, the impact will once again be felt by the natural world.
What happens to our wild places?
In the 2050 Calculator, the ‘Other’ land category - those areas not used for agriculture, set-
tlements or forest – is expected to shrink dramatically under every land-use scenario. This
category includes the wild areas so beloved of the general public and, of course, environ-
mentalists too. CPRE and FoE have both opted for a scenario that involves the loss of 37%
of these areas. The Campaign for Sustainable Energy’s choice leads to losses of 44%. With
‘friends’ like this, who needs enemies?
Table 1: Land requirements for green groups’ energy plans.
FoE CPRE SEA RSPB*
Area required (000 km2 )
Onshore wind 6 1 1 9 Assuming 1.4 W/m 2
Biofuels 12 12 24 10 Correcting for no yield gain
Forest 30 30 34 ? Per calculator
Hydro catchment 5 3 3 3 Per calculator
Total onshore impact
Offshore wind 13 14 13 4 At 2.5 W/m2 (per calculator)
Energy crops overseas† 13 13
Energy imports 1 1 1
*High Onshore scenario. The RSPB and SEA envisage 13,000 km 2 being in other countries,
†
thus damaging their wildlife and landscapes rather than ours.
Opposite: Concreting the moors for turbine foundations 24The best case envisaged is a loss of 30% of these areas. With a more aggressive approach
to shifting land into the service of the atmosphere, losses of over 40% are envisaged. It is
quite possible that the losses of wild places will be worse still, since the 2050 Calculator as-
sumes that food yields will improve by a minimum of 0.9% per annum, an improvement of
more than 50% by 2050. In some scenarios, it assumes improvements of 1.5% per annum,
and more than 80% more food per acre by 2050. These values are 2–4 times higher than
those envisaged in the literature. 97 It is quite possible that we might need to find another
10,000 km2 of land for food, or import it from elsewhere. In either case, the natural world will
be the loser.
7 Conclusions
David Mackay knew all this. Just before his untimely death he gave an interview to the en-
vironmentalist, Mark Lynas. A report of the encounter quoted him as follows:
There is this appalling delusion that people have that we can take this thing that is cur-
rently producing 1% of our electricity and we can just scale it up and if there is a slight
issue of it not adding up, then we can just do energy efficiency. . . Humanity really does
needs to pay attention to arithmetic and the laws of physics – we need a plan that adds
up.98
It must be clear that the renewables sums do not add up (and indeed that many green
organisations pay no attention to arithmetic!). Mackay was convinced that the future lay
with nuclear power and fossil fuels, the emissions of the latter mitigated with CCS.
Nevertheless, the ‘appalling delusion’ that the future will be powered by renewables still
forms the central plank of the energy policies of almost every UK political party. Almost every
green NGO still claims to support the idea too. ‘The UK can be almost entirely powered by
renewables’, says Greenpeace.99 ‘We can now see a future where almost all our electricity
comes from the wind, wave and sun’, says Friends of the Earth 100 (a very different tale to
the results they published for the 2050 Calculator, in which fossil fuels continue to provide
around 40% of supply, most of it imported 101 ). Only the ‘miraculous’ intervention of CCS
prevents this being a problem.
We expect little from militant campaigning groups like Greenpeace and Friends of the
Earth. Their continued existence depends on maintaining a steady income, which depends
in turn on being able to scare members of the public into handing over their money. How-
ever, we normally expect higher standards from the more ‘respectable’ participants in the
environmental debate. So it is hard to understand why the RSPB and the CPRE are willing to
continue to support the expansion of renewables.
It is beyond doubt that onshore technologies such as wind, biofuels and solar, if deployed
on the scale envisaged by these two organisations, would have an appalling effect on the
natural world. The birds and rural landscapes that these two eminent bodies claim to protect
would suffer unimaginably.
And the reality would be much, much worse than this. The environmentalists’ plans rely
on fossil fuels equipped with CCS for a very significant proportion of their energy supply:
40% in the plans of FoE and CPRE. Yet CCS is currently a mirage, and an extraordinarily ex-
pensive one too.102 So the output of renewables would almost certainly have to be at nearly
twice the level in these plans, which, as noted above, already assume reductions in demand
that border on the absurd.
26If the country really were powered by renewables on the required scale, the result would
be devastation. Tens of thousands of square kilometres of the UK would be ruined. The wilful
blindess of the RSPB and CPRE to the wholesale destruction they are supporting is wholly
culpable. It appears as if they have simply decided to betray their members and sacrifice
what they were sworn to protect, because some scientists told them it would be hotter in a
century’s time. How shameful.
27Notes 1. Ridley M. Wind turbines are neither clean nor green and they provide zero global energy. The Spectator, 13 May 2017. 2. BP Statistical Review of World Energy (2015) https://www.bp.com/content/dam/bp/pdf/ energy-economics/statistical-review-2015/bp-statistical-review-of-world-energy-2015-fu ll-report.pdf. 3. Mackay D. Sustainable Energy – Without the Hot Air. UIT Cambridge, 2009. The book is freely available on the web at www.withouthotair.com. 4. Although sometimes power lines are buried. This reduces the visual impact, but adds significantly to the cost. 5. Frick WF et al. Fatalities at wind turbines may threaten population viability of a migratory bat. Biological Conservation, 2017; 209: 172–177. 6. http://datazone.birdlife.org/sowb/casestudy/powerlines-pose-a-threat-to-italian-birds. The authors reported results for high-voltage (HV, 40–380 kV) and medium-voltage (MV, 1– 40 kV) lines. There were minimum fatality rates of up to 0–87/km through collision and 2– 20/km through electrocution. 7. Allowing half of the 100 deaths per km cited in the previous reference for the 220 km length of the interconnector. 8. Furness RW et al. (2013) Assessing vulnerability of marine bird populations to offshore wind farms. Journal of Environmental Management, 119, 56–66. 9. Cramb A. (2014) Wind turbines have killed more birds of prey than persecution this year. Telegraph, 29 October. http://www.telegraph.co.uk/news/uknews/scotland/11196172/Wi nd-turbines-have-killed-more-birds-of-prey-than-persecution-this-year.html. 10. Drewitt AL and Langston RHW (2006) Assessing the impacts of wind farms on birds. Ibis (2006), 148, 29–42. 11. Figures from http://penycymoedd.vattenfall.co.uk/constructing-turbine-foundations- in-pictures/, with their 600 m3 value for concrete converted to tonnes. 12. Ruiz de Temiño Alonso, I. Gravity base foundations for offshore wind farms. MEng disser- tation, University of Cantabria. https://repositorio.unican.es/xmlui/bitstream/handle/10902 /3429/Ruiz%20de%20Temi%C3%B1o%20Alonso%20Ismael.pdf. 13. https://www.offshorewind.biz/2017/05/29/statoil-floats-first-hywind-scotland-found ations-off-stord/. 14. Mackay gives the area occupied by the 140 turbines of the Whitelee windfarm at 55 km 2 , which amounts to 2.5 turbines per square kilometre. 10% of the UK is 24,250 km 2 , so cover- ing it would take 61,000 turbines. 15. Mackay suggests that this is around 25 km. 16. According to Mackay, wind around the UK could deliver 16 kWh/day, which would re- quire some 44,000 3-MW turbines, occupying an area two thirds the size of Wales or a strip 4 km wide around the whole of Great Britain. Deeper waters might deliver a larger figure of 32 kWh/day, but the turbines required would then occupy a strip of water 9 km wide around Britain. 17. Figures of 20 per turbine are plausible. See discussion in Drewitt AL and Langston RHW. Op. cit. 18. RSPB. Are cats causing bird declines? https://www.rspb.org.uk/get-involved/communi ty-and-advice/garden-advice/unwantedvisitors/cats/birddeclines.aspx. 19. Ibid. 28
20. Bright J et al. (2008) Map of bird sensitivities to wind farms in Scotland: A tool to aid
planning and conservation. Biological Conservation 141; 2342–2356. http://www.academia
.edu/download/45616197/Map_of_bird_sensitivities_to_wind_farms_20160514-29229-1s
ngoj5.pdf.
21. https://www.rspb.org.uk/globalassets/downloads/documents/positions/climate-cha
nge/wind-power-publications/rspb-and-snh-report-2006-bird-sensitivity-map-to-provide
-locational-guidance-for-onshore-wind-farms-in-scotland.pdf.
22. Swift, SM. Bat species in Scotland. Scottish Natural Heritage. http://www.snh.gov.uk/d
ocs/C208532.pdf.
23. Knapton, S. (2016) Wind farms could be killing 80,000 bats a year, new study finds. Daily
Telegraph, 7 November.
24. Harris S, Morris P, Wray S and Yalden D. (1995) A review of British mammals: population
estimates and conservation status of British mammals other than cetaceans. Joint Nature
Conservation Committee.
25. Mackay suggests kWh/person per day figures of 20 (onshore), 16 shallow offshore and
32 Deep offshore, against total demand of 195.
26. Kagan, RA, et al. (2014) Avian mortality at solar energy facilities in southern California:
a preliminary analysis. National Fish and Wildlife Forensics Laboratory. http://docketpublic
.energy.ca.gov/publicdocuments/09-afc-07c/tn202538_20140623t154647_exh_3107_kag
an_et_al_2014.pdf.
27. African Development Bank (2014) Ouarzazate Solar Power Station Project II: Summary
Environmental And Social Impact Assessment.
28. Wetzel, D. Studie warnt vor Umweltrisiken durch Solarmodule. Die Welt, 13 May 2018. ht
tps://www.welt.de/wirtschaft/article176294243/Studie-Umweltrisiken-durch-Schadstoffe-i
n-Solarmodulen.html. See also the English language discussion of this article at http://no
trickszone.com/2018/05/23/new-study-solar-module-owners-sitting-on-a-pile-of-hazardo
us-lead-and-cadmium/.
29. Tomioka, O. Japan tries to chip away at mountain of disused solar panels. Nikkei Asian
Review, 8 November 2016. https://asia.nikkei.com/Tech-Science/Tech/Japan-tries-to-chip-
away-at-mountain-of-disused-solar-panels.
30. Tian Min, general manager of Nanjing Fangrun Materials, quoted in Chen S, China’s
ageing solar panels are going to be a big environmental problem. South China Morning
Post, 30 July 2017.
31. A maximum of another 5 kWh/day.
32. Cambridgeshire 3389, Gloucestershire 3149, Lancashire 3075 and Staffordshire 2713.
Total = 12,326 km2 .
33. ‘I feel a bit irresponsible as I include this estimate... – paving 5% of the UK with solar
panels seems beyond the bounds of plausibility in so many ways.’
34. Roddis P et al. (2016) The RSPB’s 2050 Energy Vision: Technical Report. Royal Society for
the Protection of Birds, 2016.
35. Moran EF et al. (2018) Sustainable hydropower in the 21st century, Proceedings of the
National Academy of Sciences Nov 2018, 201809426.
36. Pearce, F. How Big Water Projects Helped Trigger Africa’s Migrant Crisis. Yale Environ-
ment 360, 17 October 2017. https://e360.yale.edu/features/how-africas-big-water-project
s-helped-trigger-the-migrant-crisis.
37. Hvistendahl M. China’s Three Gorges Dam: an environmental catastrophe? Scientific
American, 25 March 2008.

                                                                                            29
You can also read