Greenhouse gas footprint is far too high
←
→
Page content transcription
If your browser does not render page correctly, please read the page content below
Vol. 16, No. 3, 2021

                                                                                                                                       swiss-academies.ch

Tackling climate change and biodiversity loss
jointly
Climate change and biodiversity loss pose threats to humankind. As these two crises are interlinked and mutually
reinforcing, they also need to be tackled jointly. This requires multiple coordinated approaches as well as systemic
thinking and action. Measures to combat climate change and biodiversity loss can be mutually supportive; however,
if they are not coordinated, there is a risk that the crises may be intensified as a result of unintended effects and
conflicts arising from competing goals. The most effective measures are those which address the root cause of both
crises – our unsustainable way of life – and involve a fundamental shift towards sustainable resource consumption
that respects planetary boundaries. Both at home and abroad, Switzerland is a higher-than-average contributor to
both of these crises – but it is also significantly affected by the impacts. In addition to having a major international
responsibility, it is therefore very much in Switzerland’s own interest to play a pioneering role in efforts to protect
the climate and biodiversity.

1     Greenhouse gas footprint is far too high                                              ing planetary boundaries would require annual per capita
                                                                                            global emissions not to exceed 0.6 tonnes of CO2 equiva-
The global average temperature is now approximately 1°C                                     lents.4 While emissions remain at a much higher level, cli-
above pre-industrial levels,1 while in Switzerland the average                              mate-related risks to health, food security, water supplies
temperature has risen by 2°C since measurements began in                                    and ecosystem stability will continue to increase.1
1864.2 This is mainly attributable to the use of fossil fuels,
leading to increased emissions of greenhouse gases (GHG).                                   In Switzerland, the impacts of climate change in recent dec-
                                                                                            ades have already been all too evident: heatwaves have
Switzerland’s GHG footprint is many times higher than the                                   been more frequent and intense, the zero-degree level has
global average and significantly above that of EU countries.3                               risen by around 300 to 400 metres, and the total volume of
In 2018, each person in this country was responsible for the                                Swiss glaciers has declined by more than 60% since 1850.2
emission of over 13 tonnes of CO2 equivalents, taking into                                  Dry summers, heavy rainfall, tropical days (30°C or more)
account emissions generated abroad by domestic consump-                                     and low-snowfall winters are likely to become more com-
tion. This massively exceeds safe boundary levels: respect-                                 mon.5

Ismail SA, Geschke J, Kohli M et al. (2021) Tackling climate change and biodiversity loss jointly • Swiss Academies Factsheet 16 (3)
2 Millions of species at risk of extinction of both crises. These adverse influences can reinforce each
other (Figure 1).
Worldwide, species extinction rates are currently around 100
to 1000 times higher than natural background rates.6 In the For example, the drainage of peatlands for agricultural pur-
coming decades, up to 1 million of an estimated 8 million poses leads to the loss of highly specialised species and also
animal and plant species are threatened with extinction.7 to the release of GHG (Box 2). The additional GHG emissions
The global loss of biodiversity since the 1970s has led to intensify climate change, which in turn impairs the ecosys-
a decline in vital ecosystem services: the regulation of cli- tem services of peatlands, and so forth. At a certain point,
mate, water/air quality and detrimental organisms, and the changes occurring in ecosystems become irreversible.13 Such
mitigation of extreme weather events, are increasingly im- ‘tipping points’ of global significance include, for example,
paired.7 Among the direct drivers of global biodiversity loss the thawing of permafrost peatlands at high latitudes,14, 15
are changes in land and sea use, direct exploitation of or- increased shrub cover in the tundra or major forest fires,16
ganisms, climate change, pollution and invasive alien spe- leading to the release of vast amounts of stored carbon into
cies.7 the atmosphere as GHG.17
Biodiversity is also under severe pressure in Switzerland.8
Half of all the habitat types and a third of the 10,350 species 4 Climate change threatens biodiversity
evaluated to date are classified as threatened.9, 10 Particu-
larly affected are aquatic, wetland and farmland species. Climate change influences habitats and the seasonal be-
Among OECD countries, Switzerland has one of the highest haviour of species, altering their growth, productivity and
proportions of threatened species. In addition, the extent geographical distribution (Box 1). It accelerates changes in
and quality of the country’s protected areas are not suffi- community composition, as well as local extinction, in all
cient to ensure that the conservation goals which it has set habitats.18 Interactions between species are sometimes dis-
for itself are achieved.11 With its high levels of consumption, rupted – for example, if the activity of pollinators no longer
Switzerland also contributes to global losses of biodiversity. coincides with the flowering period, or if there are temporal
On a per capita basis, the country’s biodiversity footprint or spatial mismatches between predators and their prey.19, 20
also vastly exceeds planetary boundaries.12
In response to warmer temperatures in the mountains,
many species are shifting towards higher altitudes.21 As a
3 Drivers interact, reinforcing each other result, over the last 100 years, plant species richness has
increased on summits in the Central Alps – partly because
The underlying causes of climate change and biodiversity existing specialist species are not immediately displaced.22
loss are an unsustainable way of life and economic activ- However, if average global temperatures rise by 2.2 °C, the
ity. For decades, humans have been overexploiting natural treeline elevation will shift upward by approx. 400 metres.
resources, thus undermining the foundations of human wel- Worldwide, around half of the alpine area is likely to be-
fare.7 Such overexploitation gives rise to the direct drivers come mountain forest,23 and in the long term the extent of
Indirect drivers Direct drivers Global crises
Values and Main causes
behaviours
Politics GHG emissions Decreased carbon
Use of fossil fuels
sequestration
Technology
Climate change
Land and sea use Direct exploitation
Business change
Habitat
degradation/loss
Society Unsustainable
production, trade, Pollution
Biodiversity loss
consumption
Reduced ecosystem
Invasive species functioning
Reduction
in human
welfare
Figure 1: Currently prevailing societal values and behaviours lead to the unsustainable use of natural resources (indirect drivers). This overexploitation gives rise
to the factors that impair the stability and functioning of the climate and ecosystems (direct drivers). These can reinforce each other, thus intensifying climate
change and biodiversity loss. In turn, a changing climate and declining biodiversity adversely affect the direct drivers – a downward spiral. But the consequenc-
es of the global crises also have an impact on our way of life and hence on the underlying indirect drivers.Swiss Academies Factsheets 16 (3), 2021
Box 1: Climate change undermines the rock ptarmigan’s camouflage
Switzerland is home to around 40% of the global popula-
tion of rock ptarmigan. Between 1990 and 2017, their num-
bers declined by about 30%.33 The rock ptarmigan is now
classified as near threatened34 and is a national priority
species.35
Climate change could put further pressure on this spe-
cies. Climate models predict that its potential habitat in
Switzerland could decrease by up to two thirds by 2070.36
However, the problem does not arise merely from higher
temperatures. The birds can survive in areas which would
normally be too warm as long as sufficient shade is avail-
able.37 It is rather indirect factors linked to climate change
– such as earlier snowmelt – that contribute to their de-
cline: if the snow disappears while the birds are still in
their white winter plumage, then their camouflage is lost
and they will be more easily detected by predators. The
advance of climate change is thus increasing the pressure
on a species already threatened by other factors such as
winter sports and hunting.
Photo: Oliver Born
habitats lying above the treeline will consequently be mark- 122.6 megatonnes41 stored in agricultural mineral soils and
edly reduced. 30 megatonnes in peatland soils42 (Box 2).
Many species cannot keep up with the rapid pace of cli- The preservation of intact and restoration of degraded eco-
mate change.20 The most vulnerable are those with low systems sequesters carbon and reduces CO2 concentrations
genetic variation, a low reproduction rate, poor dispersal in the atmosphere. Such so-called nature-based solutions
capacity and narrow ecological niches.24 They are displaced (NbS)43 also include green spaces and waterbodies in cities
by (generally common) species with greater adaptive ca- or agricultural areas. As well as counteracting biodiversity
pacity, leading to ecosystem homogenisation.25, 26, 27 With loss, these approaches can help to reduce the effects of cli-
the current trajectory of global warming (average increase mate change (Box 2). For example, protection forests, river
of 3.2 °C by 2100), around 49% of insect species, 44% of restoration or peatland rewetting can mitigate the impacts
plant species and 26% of vertebrate species are project- of droughts, storms and flooding. In urban areas, NbS can
ed to lose more than half of their geographical range.28 In help to reduce the heat island effect and regulate the water
addition, native species are at greater risk, while invasive cycle.
alien species are expected to benefit.29, 30 Mires, forests, dry
grasslands, springs, surface waters and rocks have a high To what extent CO2 can be removed from the atmosphere
proportion of species with narrow ecological niches and are via NbS or engineering solutions is currently difficult to es-
therefore considered to be climate-sensitive habitats.31, 32 timate. Measures of this kind should not blind us to the fact
that – in addition to sustainable management of land and
water resources – rapid replacement of fossil fuels by re-
5 Biodiversity mitigates climate change newables remains indispensable.44, 45, 46
and its impacts
The atmosphere and the biosphere interact closely. Terres- 6 Strengthening synergies, minimising
trial ecosystems and marine sediments are the largest car- conflicts due to competing goals
bon reservoirs and CO2 sinks. Carbon is also dissolved in wa-
ter. About half of the carbon released into the atmosphere Climate change is currently the third most important – and
as a result of fossil fuel burning and land-use changes is from 2050 is likely to be the leading – cause of the biodi-
absorbed by vegetation and the oceans (Figure 2).38 versity crisis.7 For this reason, in the long term, measures
to combat climate change, such as the promotion of renew-
Vast amounts of carbon are also stored by the biosphere ables, will also counter biodiversity loss. At present land-
in Switzerland. The largest reservoir is the forest, with 155 use changes which lead to the degradation and loss of eco-
megatonnes of carbon stored in live and dead trees and systems, are the main factors contributing to biodiversity
around 175 megatonnes in forest soils.39, 40 Non-forest soils loss.7 As they impair ecosystems’ capacity to store carbon
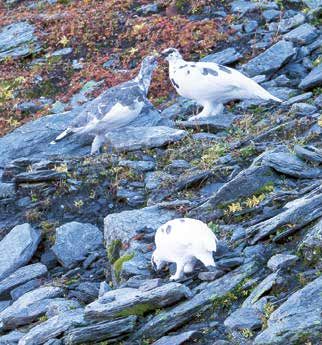
represent the second-largest carbon reservoir, with approx. and absorb CO2, they also drive climate change. The mainte-Fossil CO₂ Land Atmospheric CO₂ Ocean
Anthropogenic fluxes
+4.9 2009–2018
3.2 2.5
(2.6–3.8) (1.9–3.1) (average GtC per year)
0.1 9.5 1.5
(9.0–10.0) (0.8–2.2)
Carbon cycling
120 90 (GtC per year)
120 90
Rivers 860
and lakes Stocks GtC
Marine
Gas reserves Vegetation Coasts biota
385–1135 450–650 10–45 Surface 3
sediments Organic
Oil reserves Soils 1750
175–265 1500–2400 carbon
700 Dissolved
Coal reserves Permafrost Budget imbalance +0.4 inorganic carbon
445–540 1700 38,000
Figure 2: Anthropogenic perturbation of the global carbon cycle. In the natural cycle, carbon circulates between the atmosphere, land and oceans (thin bars).
In the oceans, carbon is stored either dissolved in water or fixed in biomass. Human activities – especially the use of fossil fuels and changes in land use –
lead to the release of additional carbon, only some of which is subsequently stored by vegetation and the oceans (thick bars). In this schematic representa-
tion adapted from Friedlingstein et al. 201938 the estimates are expressed as gigatonnes of carbon (GtC), averaged globally for the period 2009–2018.
A conversion factor of 3.664 is applied to convert the amount of carbon to CO2 emissions.
nance of intact and the restoration of degraded ecosystems 7 Need for transformation of society
are therefore key measures to combat both of these crises.
However, measures to protect the climate and biodiversity Climate change and biodiversity loss are increasingly caus-
may not only generate synergies, but also adversely affect ing economic damage and unpredictable changes in socie-
the achievement of the other (competing) protection goal ty.60, 61 Among the top global risks identified by the World
(Box 3). Economic Forum are climate action failure, infectious dis-
eases, environmental degradation, biodiversity loss and
This is illustrated by a qualitative assessment of the effects extreme weather events.62
of eight selected measures in the areas of energy, ecosys-
tems, behaviour and economic policy (Figure 3). With opti- In view of the predicted impacts, business as usual is not
mal implementation, all these measures have the potential an option. The Intergovernmental Panel on Climate Change
to contribute to synergistic management of both crises. To and the Intergovernmental Science-Policy Platform on Bi-
this end, conflicts arising from competing goals need to be odiversity and Ecosystem Services agree that, as well as
minimised, with measures being coordinated and synergies numerous individual measures, there is a need for a fun-
strengthened. Negative effects of measures are frequently at- damental change in our way of life.7, 57 This is the only way
tributable to land-use conflicts between conservation, decar- in which production and consumption can be brought to a
bonisation and food production. However, unwanted changes level that respects planetary boundaries.
in behaviour may also nullify desired effects, e.g. if, when re-
sources are used more efficiently, the resultant savings lead Per capita, both at home and abroad, the Swiss popula-
to an increase in consumption (rebound effect). If insufficient tion is a higher-than-average contributor to GHG emissions2
attention is paid to minimising negative effects in the other and to biodiversity loss.63 At the same time, biodiversity is
area when measures are implemented, the climate or biodi- at particular risk in Switzerland,11 and climate warming is
versity crisis may even be further intensified. above the global average.2 Not least because of the coun-
try’s topography, this gives rise to considerable environ-
The effects of virtually any measure thus depend on the mental risks. Thus, urban areas, as well as agriculture and
overall framework and the type of implementation. Systemic forestry, are increasingly threatened by storms, landslides
thinking and action are needed to identify intended and unin- and flooding, and winter tourism is affected by the rising
tended effects, and to minimise conflicts arising from compet- temperatures.
ing goals. Even if individual measures are particularly impor-
tant, multiple coordinated approaches are required to address As well as having a major international responsibility,
the two crises.57, 58 In order to develop sustainable solutions, therefore, it is very much in Switzerland’s own interests to
transdisciplinary sustainability research should increasingly play a pioneering role in efforts to protect the climate and
be promoted in addition to disciplinary approaches, taking all biodiversity.
relevant perspectives into account.59Swiss Academies Factsheets 16 (3), 2021
Box 2: Peatlands are important for agriculture – Box 3: Prioritising renewable energy production
but also for the climate and biodiversity at existing sites
Peatlands only cover around 3% of the world’s land The transition to renewable energy supplies requires
area,47 but they store approx. 21% of global soil car- large areas and is thus in competition with land use for
bon,48 which explains the importance of protecting conservation or agricultural purposes. If priority is accord-
those peatlands which remain intact. Worldwide, the ed to areas already under some form of land use as sites
rewetting of peatlands could reduce GHG emissions by for electricity production, such conflicts can be effective-
1.91 (0.31 –3.38) gigatonnes of CO2 equivalents per year ly managed and synergies exploited. For example, solar
– more than twice as much as was emitted by global power systems can be installed on existing buildings and
aviation in 2019.49 infrastructure or combined with the cultivation of certain
In Switzerland, most peatlands have been drained for crops (agrophotovoltaics).52 As the expansion of renewa-
agricultural use. But as soil oxygen levels rise, organic ble energy requires vast amounts of raw materials – often
carbon is broken down, producing CO2 and nitrous ox- from sensitive ecosystems – there is also a need for a shift
ide (N2O), which are released into the atmosphere as towards sustainable mining.53, 54
GHG. Switzerland’s agriculturally used peatlands emit In Switzerland, small-scale hydropower plants make up
0.77 megatonnes of CO2 equivalents per year, represent- the largest proportion of hydroelectric plants, but only ac-
ing around 14% of total annual emissions from agricul- count for 10% of total hydropower output.55 They are often
ture.40 Intact peatlands are also becoming increasingly harmful to river ecosystems.56 Relative to the electricity
dry as a result of artificial drainage50 and are turning generated, the numerous small-scale plants probably have
into GHG sources. a greater impact on biodiversity than a small number of
Protected mires (raised bogs and fens) occupy just large plants. In addition, ecological compensation meas-
0.5% of the total area of Switzerland, but they harbour ures are more readily justifiable economically in the case
around 25% of its threatened plant species.51 In addi- of large plants.56 Small-scale hydropower plants should
tion, intact peatlands mitigate the impacts of climate therefore only be maintained or expanded on river sec-
change: given their capacity to store water, they can tions which are already severely degraded, and – in terms
reduce local flood peaks and release water to adjacent of additional damage to ecosystems – the expansion of
areas during dry periods. existing large plants would appear to be more efficient.
Energy Ecosystems Behaviour Economic policy
Transition Habitat protection and Reducing consumption Greening of finance
to renewables increased connectivity and production
Increasing fossil Restoration New dietary patterns Abolishing harmful
fuel prices reducing emissions subsidies
and land use
Distribution Mean evaluation Range of
of evaluation evaluation
Biodiversity +3 Implementation Biodiversity
+3 optimal
Climate
Climate 0 inadequate
-3
-3 0
Figure 3: Qualitative evaluation of selected measures to protect the climate and biodiversity. The authors estimated the effects for the climate and biodiversity
using a 7-point scale (–3 = strongly negative, –2 = negative, –1 = somewhat negative, 0 = neutral, +1 = somewhat positive, +2 = positive, +3 = strongly positive).
In each case, they evaluated an optimal implementation, where unintended negative effects are minimised, and an inadequate implementation, where negative
effects in the other area are accepted. With optimal implementation, all the measures considered show positive to strongly positive effects on protection of the
climate and biodiversity. By contrast, with inadequate implementation, various measures may intensify the crises.In seeking to curb climate change and biodiversity loss, the following steps are important:
→ Transformative change to a sustainable economic system: → Environmental regulations for the financial sector: The
The economic development of countries and companies financial sector has a major influence on economic activ-
must also be measured by their management of natural ities which are harmful to biodiversity and the climate.
resources. One recent approach calls for the inclusion of This is also true for Switzerland, where finance is the
environmental and biodiversity assets in national and cor- third largest sector.70 Switzerland is supporting education
porate accounting systems.64 This could help to take nega- and training measures71 and the ENCORE tool, which high-
tive externalities into account in the setting of prices. Still lights the impact of environmental change on the econo-
more comprehensive is the concept of ‘doughnut econom- my.72 Binding environmental regulations could make the
ics’, in which development is to take place both within the Swiss financial sector an international pioneer in the rap-
environmental planetary boundaries and with minimum idly growing market for sustainable financial products.
social standards being met.65 Accordingly, this also encom- → Reduced consumption of meat and dairy products: Nat-
passes goals for the GHG and biodiversity footprint. ural ecosystems must no longer be converted to plan-
→ No subsidies harmful to the climate and biodiversity: tations, arable land or livestock farms. The agricultural,
Switzerland and other countries around the world spend forestry and fishing sectors must sustainably manage
much more on environmentally harmful subsidies than those areas already in use. This also requires changes in
on measures to protect the climate and biodiversity.66, dietary habits.
67
To avoid conflicts with environmental goals, national → More funding for conservation: To achieve conservation
subsidies need to be reformed. goals, Switzerland and other countries around the world
→ Radical reduction of GHG emissions: Only rapid decar- need to invest many times the amount that is currently
bonisation can curb climate change.1 Agricultural GHG expended.73, 74, 75 Measures such as protected areas, res-
emissions (including methane and nitrous oxide) from toration or increased connectivity, as well as the promo-
land-use change in Switzerland and abroad are also to tion of biodiversity in all sectors including forestry and
be minimised. agriculture and urban development, scarcely involve any
→ Overcoming land-use conflicts: The use of land for build- conflicts with the goal of climate protection – on the con-
ings, transport, food production, climate protection and trary, they often have a significant potential to prevent
biodiversity conservation needs to be coordinated.58, 68 GHG emissions arising from ecosystem degradation57 or
With its National Soil Strategy, Switzerland has defined to mitigate the impacts of climate change.
the ambitious goal of achieving ‘no net soil loss’ by 2050.69
SDGs: The UN's International Sustainable Development Goals
With this publication, the Swiss Academy of Sciences contributes to SDGs 13, 14 and 15
‘Take urgent action to combat climate change and its impacts’, ‘Conserve and sustainably use the oceans, seas and marine resources for sustainable
development’, and ‘Protect, restore and promote sustainable use of terrestrial ecosystems, sustainably manage forests, combat desertification, and halt and
reverse land degradation and halt biodiversity loss.’
> sustainabledevelopment.un.org
> eda.admin.ch/agenda2030/en/home/agenda-2030/die-17-ziele-fuer-eine-nachhaltige-entwicklung.html
1 – 75 References are included in the online version at biodiversity.scnat.ch/publications/factsheets
IMPRESSUM
PUBLISHER AND CONTACT NOTE
Swiss Academy of Sciences (SCNAT) • Swiss Biodiversity Forum This factsheet was prepared with the financial support of the FOEN. The
and ProClim – Forum for Climate and Global Change SCNAT bears sole responsibility for the content.
House of Academies • Laupenstrasse 7 • P.O. Box • 3001 Bern • Switzerland EDITING
+41 31 306 93 40 • biodiversity@scnat.ch • biodiversity.scnat.ch Andres Jordi (SCNAT) • Ursula Schöni (Swiss Biodiversity Forum, SCNAT)
@biodiversityCH
TRANSLATION
RECOMMENDED FORM OF CITATION Acheson Translations & Editing
Ismail SA, Geschke J, Kohli M et al. (2021) Klimwandel und Biodiversitäts
verlust gemeinsam angehen. Swiss Academies Factsheet 16 (3) LAYOUT
Olivia Zwygart (SCNAT)
AUTHORS
Sascha A. Ismail (Swiss Biodiversity Forum, SCNAT) • Jonas Geschke (Univer- ILLUSTRATIONS AND INFOGRAFICS
sity of Bern) • Martin Kohli (ProClim, SCNAT) • Eva Spehn (Swiss Biodiversity Hansjakob Fehr, 1kilo
Forum, SCNAT) • Oliver Inderwildi (ProClim, SCNAT) • Maria J. Santos (Uni- ISSN (print): 2297–8283 • ISSN (online): 2297–1831
versity of Zürich) • Jodok Guntern (Swiss Biodiversity Forum, SCNAT) • Sonia
I. Seneviratne (ETHZ) • Daniela Pauli (Swiss Biodiversity Forum, SCNAT) • DOI: 10.5281/zenodo.5145162
Florian Altermatt (University of Zürich, EAWAG) • Markus Fischer (University
of Bern)
REVIEW
Peter Edwards (ETHZ) • Christian Körner (University of Basel) • Carsten Cradle to CradleTM-certified and climate-neutral factsheet,
Loose (WBGU) • Astrid Schulz (WBGU) printed by Vögeli AG in Langnau.Vol. 15, No. X, 2020
References
1 IPCC (2018) Summary for Policymakers. In: Global warming of 1.5 °C. 18 IPBES ECA (2018) The IPBES regional assessment report on biodi-
An IPCC Special Report on the impacts of global warming of 1.5 °C versity and ecosystem services for Europe and Central Asia. Fischer
above pre-industrial levels and related global greenhouse gas emis- M, Rounsevell M, Torre-Marin Rando A et al. (eds.). IPBES-Secretariat,
sion pathways, in the context of strengthening the global response Bonn, Germany.
to the threat of climate change, sustainable development, and efforts 19 HilleRisLambers J, Harsch MA, Ettinger AK, Ford KR, Theobald EJ (2013)
to eradicate poverty (Masson-Delmotte V, Zhai P, Pörtner HO et al. How will biotic interactions influence climate change–induced
[eds.]). World Meteorological Organization, Geneva, Switzerland, range shifts? Annals of the New York Academy of Sciences, 1297
32 pp. (2013) 112–125.
2 BAFU (2020) Klimawandel in der Schweiz. Indikatoren zu Ursachen, 20 Vitasse Y, Ursenbacher S, Klein G et al. (2021) Phenological and ele-
Auswirkungen, Massnahmen. Umwelt-Zustand Nr. 2013: 105 S. vational shifts of plants, animals and fungi under climate change
3 BAFU (2021) Indikator Wirtschaft und Konsum, Treibhausgas-Fuss- in the European Alps. Biological Reviews, 000–000. doi: 10.1111/
abdruck. https://www.bafu.admin.ch/bafu/de/home/themen/ brv.12727
thema-wirtschaft-und-konsum/wirtschaft-und-konsum--daten-- 21 Roth T, Plattner M, Amrhein V (2014) Plants, birds and butterflies:
indikatoren-und-karten/wirtschaft-und-konsum--indikatoren/indika- short-term responses of species communities to climate warming
tor-wirtschaft-und-konsum.pt.html/aHR0cHM6Ly93d3cuaW5kaWthd- vary by taxon and with altitude. PLoS ONE 9: e82490.
G9yZW4uYWRtaW4uY2gvUHVibG/ljL0FlbURldGFpbD9pbmQ9R1cwM-
TYmbG5nPWRlJlN1Ymo9Tg%3d%3d.html, retrieved 21.06.2021 22 Wipf S, Stöckli V, Herz K, Rixen C (2013) The oldest monitoring site of
the Alps revisited: accelerated increase in plant species richness on
4 Dao H, Friot D, Peduzzi P, Bruno C, Andrea DB, Stefan S (2015) Environ- Piz Linard summit since 1835. Plant Ecology & Diversity 6: 447– 455.
mental limits and Swiss footprints based on Planetary Boundaries.
UNEP/GRID-Geneva & University of Geneva, commissioned by the 23 Körner C (2021) Alpine Plant Life. Functional Plant Ecology of High
Swiss Federal Office for the Environment (FOEN), Geneva, Switzerland. Mountain Ecosystems. 3rd Edition. Springer Nature Switzerland.
82 pp. 500 pp.
5 NCCS (Hrsg.) (2018) CH2018 – Klimaszenarien für die Schweiz. National 24 Pacifici M, Foden WB, Visconti P et al. (2015) Assessing species vul-
Centre for Climate Services, Zürich. 24 S. nerability to climate change. Nature Climate Change, 5(3), 215–224.
6 Ceballos G, Ehrlich PR, Barnosky AD, García A, Pringle RM, Palmer TM 25 Both C, Bouwhuis S, Lessells CM, Visser ME (2006) Climate change
(2015) Accelerated modern human–induced species losses: Entering and population declines in a long-distance migratory bird. Nature,
the sixth mass extinction. Science Advances 1, e1400253. 441(7089). 81-83.
7 IPBES (2019) Summary for policymakers of the global assessment 26 Willis CG, Ruhfel B, Primack RB, Miller-Rushing AJ, Davis CC (2008)
report on biodiversity and ecosystem services of the Intergovern- Phylogenetic patterns of species loss in Thoreau’s woods are driven
mental Science-Policy Platform on Biodiversity and Ecosystem by climate change. Proceedings of the National Academy of Sciences,
Services. (IPBES Secretariat, Bonn, Germany). 105(44), 17029–17033.
8 FOEN (pub.) (2017) Biodiversity in Switzerland: Status and Trends. 27 Nussey DH, Postma E, Gienapp P, Visser ME (2005) Selection on
Federal Office for the Environment, Bern. State of the environment heritable phenotypic plasticity in a wild bird population. Science,
no. 1630: 60 p. 310(5746), 304-306.
9 Delarze R, Eggenberg S, Steiger P et al. (2016) Rote Liste der Lebens- 28 Warren R, Price J, Graham E, Forstenhaeusler N, VanDerWal J (2018)
räume der Schweiz. Aktualisierte Kurzfassung zum technischen Be- The projected effect on insects, vertebrates, and plants of limiting
richt 2013 im Auftrag des Bundesamtes für Umwelt (BAFU), Bern: 33 S. global warming to 1.5 C rather than 2 C. Science, 360 (6390), 791-795.
10 Cordillot F, Klaus G (2011) Gefährdete Arten in der Schweiz. Synthese 29 Walther GR, Post E, Convey P et al. (2002) Ecological responses to
Rote Listen. BAFU, Bern. 111 S. recent climate change. Nature, 416 (6879), 389-395.
11 OECD (2017) OECD Environmental Performance Reviews: Switzerland 30 Alexander JM, Lembrechts JJ, Cavieres LA et al. (2016) Plant invasions
2017. OECD Publishing, Paris. 48 p. into mountains and alpine ecosystems: current status and future
challenges. Alpine Botany:1-15.
12 BAFU (2021) Indikator Wirtschaft und Konsum, Biodiversitäts-Fuss-
abdruck. https://www.bafu.admin.ch/bafu/de/home/themen/ 31 Vittoz P, Cherix D, Gonseth Y, Lubini V, Maggini R, Zbinden N, Zum-
thema-wirtschaft-und-konsum/wirtschaft-und-konsum--daten--in- bach S (2013) Climate change impacts on biodiversity in Switzer-
dikatoren-und-karten/wirtschaft-und-konsum--indikatoren/ land: A review. Journal for Nature Conservation, 21, 154–162.
indikator-wirtschaft-und-konsum.pt.html/aHR0cHM6Ly93d3cua- 32 Essl F, Rabitsch W (2013) Biodiversität und Klimawandel: Aus-
W5kaWthdG9yZW4uYWRtaW4uY2gvUHVibG/ljL0FlbURldGFpbD- wirkungen und Handlungsoptionen für den Naturschutz in Mit-
9pbmQ9R1cwMTQmbG5nPWRlJlN1Ymo9Tg%3d%3d.html, retrieved teleuropa. Springer-Verlag, Heidelberg. 458 S.
21.06.2021 33 Schmid H, Kestenholz M, Knaus P, Rey L, Sattler T (2018) Zustand
13 Lenton TM, Rockström J, Gaffney O, Rahmstorf S, Richardson K, der Vogelwelt in der Schweiz: Sonderausgabe zum Brutvogelatlas
Steffen W, Schellnhuber HJ (2019) Climate tipping points — too risky 2013–2016. Schweizerische Vogelwarte, Sempach. 648 S.
to bet against. Nature, 575, 592-595. 34 Keller V, Gerber A, Schmid H, Volet B, Zbinden N (2010) Rote Liste
14 IPCC (2013) The Physical Science Basis. Contribution of Working Brutvögel. Gefährdete Arten der Schweiz, Stand 2010. Bundesamt für
Group I to the Fifth Assessment Report of the Intergovernmental Umwelt, Bern, und Schweizerische Vogelwarte, Sempach. Umwelt-Voll-
Panel on Climate Change. Stocker TF, Qin D, Plattner G-K et al. (eds). zug Nr. 1019. 53 S.
Cambridge University Press, Cambridge, and New York, 1535 pp. 35 BAFU (2019) Liste der National Prioritären Arten und Lebensräume.
15 Settele JR, Scholes R, Betts S et al. (2014) Terrestrial and inland In der Schweiz zu fördernde prioritäre Arten und Lebensräume.
water systems. In: Climate Change 2014: Impacts, Adaptation, and Bundesamt für Umwelt, Bern. Umwelt-Vollzug Nr. 1709: 99 S.
Vulnerability. Part A: Global and Sectoral Aspects. Contribution of Wor- 36 Revermann R, Schmid H, Zbinden N, Spaar R, Schröder B (2012) Hab-
king Group II to the Fifth Assessment Report of the Intergovernmental itat at the mountain tops: how long can Rock Ptarmigan (Lagopus
Panel on Climate Change (Field CB, Barros VR, Dokken DJ et al. [eds.]). muta helvetica) survive rapid climate change in the Swiss Alps? A
Cambridge University Press, Cambridge New York, multi-scale approach. Journal of Ornithology, 153(3), 891-905.
pp. 271-359.
37 Visinoni L, Pernollet CA, Desmet J-F, Korner-Nievergelt F, Jenni L
16 IPCC (2014) Climate Change 2014: Impacts, Adaptation, and Vulnera- (2015) Microclimate and microhabitat selection by the Alpine Rock
bility (WGII). Chapter 4 «Terrestrial and inland water systems». Ptarmigan (Lagopus muta helvetica) during summer. Journal of
www.ipcc.ch/report/ar5/wg2 Ornithology 156: 407–417.
17 Zimov SA, Schuur, EAG, Chapin FS (2006) Permafrost and the global 38 Friedlingstein P, Jones MW, O'sullivan M et al. (2019) Global carbon
carbon budget. Science 312, 1612–1613. budget 2019. Earth System Science Data, 11(4), 1783-1838.Swiss Academies Factsheets 16 (3), 2021
39 Brändli U-B, Abegg M. Allgaier Leuch B (Red.) (2020) Schweize- 57 Pörtner HO, Scholes RJ, Agard et al. (2021) IPBES-IPCC co-sponsored
risches Landesforstinventar. Ergebnisse der vierten Erhebung workshop report on biodiversity and climate change; IPBES and
2009–2017. Birmensdorf, Eidgenössische Forschungsanstalt für IPCC. 24 pp.
Wald, Schnee und Landschaft WSL. Bern, Bundesamt für Umwelt. 58 WBGU – German Advisory Council on Global Change (2021) Rethink-
341 S. ing Land in the Anthropocene: from Separation to Integration.
40 Hagedorn F, Krause H-M, Studer M, Schellenberger A, Gattinger A WBGU, Berlin, 367 pp.
(2018) Boden und Umwelt. Organische Bodensubstanz, Treib- 59 Wuelser G, Chesney M, Mayer H, Niggli U, Pohl C, Sahakian M, Stauf-
hausgasemissionen und physikalische Belastung von Schweizer facher M, Zinsstag J, Edwards P (2020) Priority Themes for Swiss
Böden. Thematische Synthese TS2 des Nationalen Forschungspro- Sustainability Research. Swiss Academies Reports 15 (5), 51 pp.
gramms «Nachhaltige Nutzung der Ressource Boden» (nfp 68), Bern.
93 S. 60 Stern N, Stern NH (2007) The economics of climate change: the
Stern review. Cambridge University press. 579 pp.
41 Leifeld J, Bassin S, Fuhrer J, (2005) Carbon Stocks in Swiss Agri-
cultural Soils Predicted by Land-Use, Soil Characteristics, and 61 Dasgupta P (2021) The economics of biodiversity: the Dasgupta
Altitude. Agriculture Ecosystems & Environment 105, 255-266. review. HM Treasury, London. 610 pp.
42 Wüst-Galley C, Leifeld J (2017) Entwicklung der Kohlenstoffvorräte 62 WEF (2021) The Global Risks Report 2021, 16th Edition.
und Treibhausgasemissionen der Moorböden seit 1850. World economic Forum, Geneva. 96 pp.
In: Stuber M, Bürgi M (Eds.), Vom eroberten Land zum Renaturie- 63 Frischknecht R, Nathani C, Alig M, Stolz P, Tschümperlin L, Hellmüller
rungsprojekt - Geschichte der Feuchtgebiete der Schweiz seit 1700, P (2018) Umwelt-Fussabdrücke der Schweiz. Zeitlicher Verlauf 1996-
Paul Haupt Verlag, Bern 2015. Zusammenfassung. Bundesamt für Umwelt, Bern. Umwelt-
43 Cohen-Shacham E, Walters G, Janzen C, Maginnis S (2016) Zustand. Nr. 1811: 22 S.
Nature-based solutions to address global societal challenges. 64 Turnhout E, McElwee P, Chiroleu-Assouline M et al. (2021) Enabling
IUCN: Gland, Switzerland, 97 pp. transformative economic change in the post-2020 biodiversity
44 Akademien der Wissenschaften Schweiz (a+)(2018) Emissionen agenda. Conservation Letters, e12805.
rückgängig machen oder die Sonneneinstrahlung beeinflussen: Ist 65 Raworth K (2017) Doughnut Economics: Seven Ways to Think Like
«Geoengineering» sinnvoll, überhaupt machbar und, wenn ja, zu a 21st-Century Economist. Chelsea Green Publishing. 384 pp.
welchem Preis? Swiss Academies Factsheets 13 (4). 66 OECD (2019) Biodiversity: Finance and the economic and business
45 Rogelj J, Popp A, Calvin KV, Luderer G, Emmerling J, Gernaat D, Tavoni case for action. Report prepared for the G7 Environment Ministers’
M (2018) Scenarios towards limiting global mean temperature Meeting. OECD. (2020). 94 pp.
increase below 1.5 C. Nature Climate Change, 8(4), 325-332. 67 Gubler L, Ismail SA, Seidl I (2020) Biodiversitätsschädigende
46 WBGU (2021) Über Klimaneutralität hinausdenken. Politikpapier Subventionen in der Schweiz. Grundlagenbericht. WSL Berichte. 96.
12. Berlin: Wissenschaftlicher Beirat der Bundesregierung Globale 216 S.
Umweltveränderungen. 19 S. 68 Abegg B, Fuhrer J, Reynard E, Sartoris A (2012) Lösungsansätze für
47 Yu Z, Loisel J, Brosseau DP, Beilman DW, Hunt SJ (2010) Global die Schweiz im Konfliktfeld erneuerbare Energien und Raum-
peatland dynamics since the Last Glacial Maximum. Geophysical nutzung. Akademien der Wissenschaften Schweiz. 79 S.
research letters, 37(13). L13402 69 Swiss Federal Council (2020) Swiss National Soil Strategy for sus-
48 Scharlemann JP, Tanner EV, Hiederer R, Kapos V (2014) Global soil tainable soil management. Bern, 68 pp.
carbon: understanding and managing the largest terrestrial car- 70 BAK Economics (2019) Volkswirtschaftliche Bedeutung des
bon pool. Carbon Management, 5(1), 81-91. Schweizer Finanzsektors. 53 S.
49 Leifeld J, Wüst-Galley C (2021) Moorschutz ist Klimaschutz. Hotspot 71 BAFU (2020) Nachhaltigkeit in der Aus- und Weiterbildung im
43, S.6 Finanzbereich in der Schweiz. Analyse und Empfehlungen.
50 Bergamini A, Ginzler C, Schmidt BR et al. (2019) Zustand und Umwelt-Info Nr. 2004. 52 S.
Entwicklung der Biotope von nationaler Bedeutung: Resultate 72 NCFA (2021) Natural Capital Finance Allinance.
2011–2017 der Wirkungskontrolle Biotopschutz Schweiz. https://encore.naturalcapital.finance/en/about, retrieved 22.06.2021
WSL Ber. 85. 104 S.
73 CBD (2020) Estimation of resources needed for implementing the
51 Klaus G (Red.) (2007) Zustand und Entwicklung der Moore in der Post-2020 Global Biodiversity Framework. Preliminary second
Schweiz. Ergebnisse der Erfolgskontrolle Moorschutz. Umwelt- report of the Panel of Experts on Resource Mobilization. (CBD/
Zustand Nr. 0730. Bundesamt für Umwelt, Bern. 97 S. SBI/3/5/Add.2 8 June 2020). Convention on Biological Diversity.
52 Frauenhofer ISE (2018) Agrophotovoltaics: High Harvesting Yield 16 pp.
in Hot Summer of 2018. https://www.ise.fraunhofer.de/en/ 74 Martin M, Jöhl R, Bonnard L, Borgula A, Grosvernier P, Volkart G,
press-media/press-releases/2019/agrophotovoltaics-hight-harves- Robert Y (2017) Biotope von nationaler Bedeutung - Kosten der
ting-yield-in-hot-summer-of-2018.html, retrieved 21.06.2021 Biotopinventare. Expertenbericht zuhanden des Bundes, erstellt im
53 Bennun L, van Bochove J, Ng C, Fletcher C, Wilson D, Phair N, Carbone Auftrag des Bundesamtes für Umwelt (BAFU). 2. Auflage, 2017. 68 S.
G (2021) Mitigating biodiversity impacts associated with solar and 75 Ismail S, Schwab F, Tester U. Kienast F, Martinoli D, Seidl I (2009)
wind energy development. Guidelines for project developers. Gland, Kosten eines gesetzeskonformen Schutzes der Biotope von
Switzerland: IUCN and Cambridge, UK: The Biodiversity Consultancy. nationaler Bedeutung. Technischer Bericht. Eidgenössische For-
229 S. schungsanstalt für Wald, Schnee und Landschaft WSL, Birmensdorf,
54 IEA (2021) The Role of Critical Minerals in Clean Energy Transitions. Pro Natura, Basel, und Forum Biodiversität, SCNAT, Bern. 122 S.
IEA, Paris. 283 S.
55 BFE (2019) Sektion Wasserkraft: Wasserkraftpotenzial der Schweiz:
Abschätzung des Ausbaupotenzials der Wasserkraftnutzung im
Rahmen der Energiestrategie 2050. Bern. 31 S.
56 Wolter C, Bernotat D, Gessner J, Brüning A, Lackemann J, Radinger J
(2020) Fachplanerische Bewertung der Mortalität von Fischen an
Wasserkraftanlagen. Bonn (Bundesamt für Naturschutz). BfN-Skrip-
ten 561, 213 S.You can also read