Climate drivers of large magnitude snow avalanche years in the U.S. northern Rocky Mountains
←
→
Page content transcription
If your browser does not render page correctly, please read the page content below
www.nature.com/scientificreports
OPEN Climate drivers of large magnitude
snow avalanche years in the U.S.
northern Rocky Mountains
1,2* 1
Erich H. Peitzsch , Gregory T. Pederson , Karl W. Birkeland2,3, Jordy Hendrikx 2
&
Daniel B. Fagre1
Large magnitude snow avalanches pose a hazard to humans and infrastructure worldwide. Analyzing
the spatiotemporal behavior of avalanches and the contributory climate factors is important for
understanding historical variability in climate-avalanche relationships as well as improving avalanche
forecasting. We used established dendrochronological methods to develop a long-term (1867–2019)
regional avalanche chronology for the Rocky Mountains of northwest Montana using tree-rings from
647 trees exhibiting 2134 avalanche-related growth disturbances. We then used principal component
analysis and a generalized linear autoregressive moving average model to examine avalanche-climate
relationships. Historically, large magnitude regional avalanche years were characterized by stormy
winters with positive snowpack anomalies, with avalanche years over recent decades increasingly
influenced by warmer temperatures and a shallow snowpack. The amount of snowpack across the
region, represented by the first principal component, is shown to be directly related to avalanche
probability. Coincident with warming and regional snowpack reductions, a decline of ~ 14% (~ 2% per
decade) in overall large magnitude avalanche probability is apparent through the period 1950–2017.
As continued climate warming drives further regional snowpack reductions in the study region our
results suggest a decreased probability of regional large magnitude avalanche frequency associated
with winters characterized by large snowpacks and a potential increase in large magnitude events
driven by warming temperatures and spring precipitation.
Snow avalanches affect transportation corridors and settlements throughout the world. For example, avalanches
impact numerous roadways and subsequently commerce in the western United States1–5. Understanding ava-
lanche processes and contributory climate and weather factors aids in local and regional avalanche forecasting
operations and furthers our understanding of how changing climate related avalanche activity may impact society.
Although weather directly influences snowpack structure and avalanches on daily to seasonal timescales, climate
works as a background influence on snowpack characteristics that can ultimately drive the avalanche climate
(e.g., coastal, continental)6–8 or prevalent avalanche problem type9. In addition, variability in synoptic-scale
atmospheric circulation and persistent climate modes (i.e., ocean–atmosphere teleconnections such as the El
Niño Southern Oscillation (ENSO) and the Pacific Decadal Oscillation (PDO)) can have substantial effects on
snowpack processes10–16 as well as avalanche frequency and b ehavior17–20.
Recent studies in North America investigating the association between avalanche activity and long-term
climate drivers highlight a complex relationship that is challenging to disentangle from short-term synoptic-
scale weather patterns. Mock and Birkeland7 used principal component analysis (PCA) in their investigation
of atmospheric circulation and avalanche climate associations and found the Pacific-North American (PNA)
teleconnections (both phases) to be correlated with several avalanche-climate patterns. Fitzharris and Schaerer20
associated major avalanche winters at Rogers Pass, British Columbia, Canada, with either strong zonal flow that
brought heavy snow and rising temperatures, or periods of sustained meridional flow resulting in extended cold
and below average snowfall followed by wet storm systems from the Pacific. In Glacier National Park (GNP),
Montana, Butler21 suggested these same patterns produce winters with extensive avalanching using historical
local media reports, National Park Service ranger logs, and local accounts. The complexity of associating climate
drivers or changes in climate to subsequent effects on large magnitude avalanching warrants careful analysis
and cautious inference.
1
U.S. Geological Survey Northern Rocky Mountain Science Center, 215 Mather Dr., West Glacier, MT 59936,
USA. 2Snow and Avalanche Lab, Department of Earth Sciences, Montana State University, Bozeman, MT,
USA. 3U.S.D.A. Forest Service National Avalanche Center, Bozeman, MT, USA. *email: epeitzsch@usgs.gov
Scientific Reports | (2021) 11:10032 | https://doi.org/10.1038/s41598-021-89547-z 1
Vol.:(0123456789)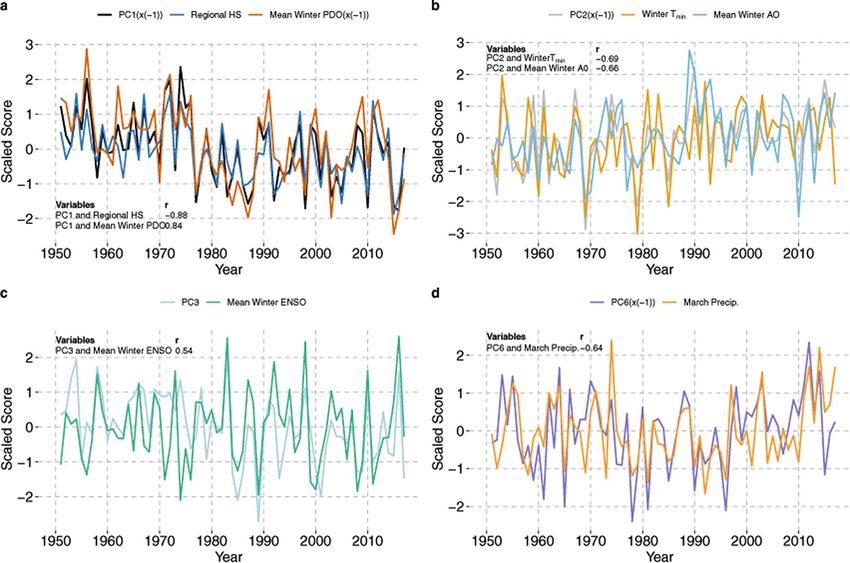
www.nature.com/scientificreports/
The effects of climate change and increasing winter air temperature on avalanche activity trends have only
recently been examined. Bellaire et al.22 analyzed weather, snow, and avalanche data from Glacier National Park,
British Columbia, Canada, between 1965 and 2014 and found several significant trends for weather and snowpack
variables consistent with a warming climate, such as warmer temperatures and less snowfall over monthly and
seasonal scales. Across the European Alps, studies on climate change effects on snow avalanches have come to
differing conclusions. For example, in the Swiss Alps, Laternser and S chneebeli23 found a gradually increasing
mean snow depth, persistence of continuous snow cover, and the number of snowfall days to increase until the
1980s, after which a significant decrease in each variable was evident. Though snow conditions had changed over
a 50-year period, an associated long-term change in avalanche activity was not discernable24, indicating these
indirect measures of accumulated snowpack may not capture conditions relevant to regional avalanche genera-
tion, or that changes in climate were not yet significant enough to change regional avalanche characteristics.
In the French Alps, Eckert et al.25 found a general decrease in dry snow avalanches since the mid-1970s as well
as an increase in runout altitude (i.e., a decreased runout distance), of infrequent, large magnitude avalanches
from 1980 to 2000, suggesting a potential change in avalanche character from dry snow to wet snow avalanches.
Similarly, Pielmeier et al.26 found an increase in the proportion of wet snow avalanches in the Swiss Alps from
1952 to 2013. Eckert et al.27, however, found no discernible change in overall avalanche occurrence processes
that could be associated with climate change over the past 60 years in the northern French Alps.
In regions with no avalanche data or a sparse observation network, large magnitude avalanches can be inferred
from dendrochronological data (i.e., snow avalanche impacted tree-ring data). This technique not only provides
a record of large magnitude avalanche frequency with annual resolution, but also the ability to produce spatial
reconstructions of events if sampled appropriately and strategically. Using the concept of the scale t riplet28, we
designed and sampled a regional network of 12 avalanche paths in the northern Rocky Mountains in northwest
Montana, USA (Fig. 1)29,30. We strategically designed the sampling so that the avalanche occurrence data inher-
ently reflects large magnitude avalanche activity on the local scale as well as the regional scale. The objective in
our study is to examine broad-scale climate drivers of snow avalanches across a region with similar topography,
snow characteristics, and climate influences. Therefore, the spatial extent of our samples matches the scale inher-
ent in the explanatory climate variables we chose to examine. In addition, we define large magnitude avalanches
as avalanche events characterized by low and variable frequency with a high capacity for d estruction31. Given our
sampling strategy and locations, a large magnitude avalanche would generally translate to a size three or greater
on the destructive classification scale32. This study focuses on regional large magnitude avalanches derived from
tree rings (hereafter regional avalanches).
From this regional tree-ring generated spatiotemporal avalanche dataset30, we address the following regional
large magnitude avalanche-climate related questions: (1) are there specific seasonal climate or atmospheric cir-
culation variables that contribute to years with common avalanche events across the region?, and (2) can we use
climate-avalanche relationships to quantify and detect changing probabilities of avalanche activity through time?
Results
Regional avalanche chronology. To construct a regional large-magnitude avalanche chronology, we
analyzed 673 total samples (614 cross sections and 59 cores) from 647 trees for growth disturbances (GD) related
to avalanche damage. Within these samples we identified 2134 GDs covering a period of record spanning 1636
to 2017. The oldest tree sampled was 367 years old, and the mean age of the sampled trees was 73 years. The most
common species in our dataset is Abies lasciocarpa (ABLA, sub-alpine fir) followed by Pseudotsuga menziesii
(PSME, Douglas-fir) and Picea engelmannii (PCEN, Engelmann spruce). The oldest growth disturbance response
dates to 1655. Using an It index that provides an indication of the number of GDs per samples alive in any given
year combined with a minimum number of GDs based on sample size helped to distinguish actual avalanche sig-
nal from noise. In addition to this double threshold, a weighted index Wit, accounts for the quality classification
threshold of each GD (see Peitzsch et al.29 for specific equations) and results in the identification of 30 regional
large-magnitude avalanche years over 1867 to 2017 (Fig. 1, Table 1).
Climate conditions characterizing avalanche years. Using the Wilcoxson rank-sum test, we inves-
tigated whether significant differences in mean climate conditions occurred in avalanche versus non-avalanche
years. Years characterized by large magnitude avalanches most often had greater mean seasonal maximum snow
water equivalent (SWEmax) and maximum snow depth ( HSmax), particularly early in the record (Fig. 2a,b). How-
ever, recent decades also show large magnitude avalanches during years of below average SWEmax and H Smax.
SWEmax and H Smax exhibit negative trends over the period of record (1950–2017), and winter (December
through March) mean total precipitation exhibits a slight positive trend in the region (Supplementary Table S1).
Significant (p < 0.05) differences in climate between avalanche and non-avalanche years exist for monthly total
precipitation in January and March, as well as for annual winter precipitation totals (Fig. 2c, Supplementary
Table S2). Accordingly, significant (p < 0.05) differences also exist between 11 related ocean–atmosphere indices
and atmospheric circulation variables (Fig. 3, Supplementary Table S2). No significant differences in relationship
to avalanche occurrence, however, are observed for the other monthly precipitation and temperature variables.
General relationships reflect ocean–atmosphere teleconnections related to winters with above (below) average
SWEmax and H Smax and the occurrence (lack) of regional large magnitude avalanches. More detailed investiga-
tion of climate-avalanche relationships is provided in the following sections.
Multivariate analysis of surface and teleconnected climate conditions related to avalanche
years. The surface climate variables and teleconnected indices exhibiting a significant difference between
avalanche year types were used in a principal component analysis (PCA) to (1) identify dominant relationships
Scientific Reports | (2021) 11:10032 | https://doi.org/10.1038/s41598-021-89547-z 2
Vol:.(1234567890)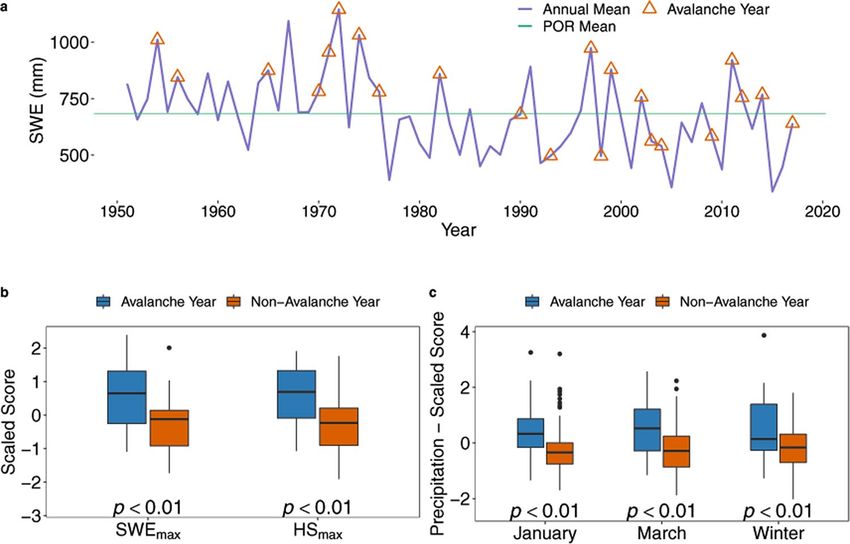
www.nature.com/scientificreports/
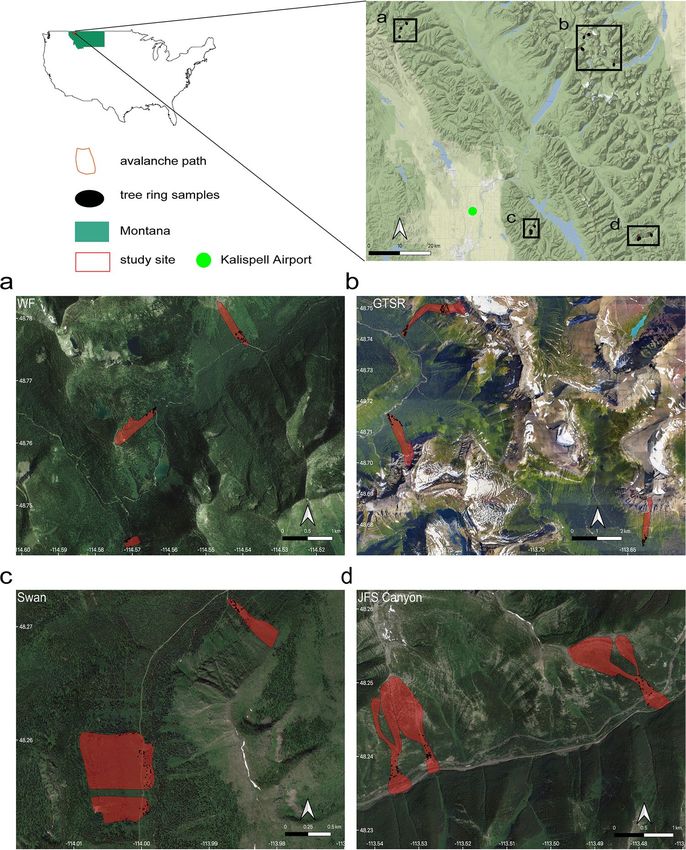
Figure 1. Study site. The red rectangle in the state of Montana designates the general area of the four
sampling sites. The sites from upper left working clockwise are: (a) Red Meadow, Whitefish Range (WF), (b)
Going-to-the-Sun Road (GTSR), central Glacier National Park (GNP), (c) Lost Johnny Creek, northern Swan
Range (Swan), and (d) John F. Stevens (JFS) Canyon, southern GNP. Black dots represent sample locations.
Abbreviated names of each path are in white text adjacent to red polygons (paths). Satellite and map imagery: ©
Google64 Maps produced using ggmap in R65.
WF GTSR Swan JFS Region
# of avalanche years 12 14 13 18 30
RI—median 7 8 4 3 3
RI—mean 6.27 11.35 11.25 4.94 5.21
RI—min 2 1 1 1 1
RI—max 13 53 54 16 53
1/RI 0.14 0.13 0.25 0.33 0.33
σ 3.69 13.48 15.70 4.60 9.53
Table 1. Avalanche chronology characteristics for the various sub-regions and overall region. RI = return
interval.
Scientific Reports | (2021) 11:10032 | https://doi.org/10.1038/s41598-021-89547-z 3
Vol.:(0123456789)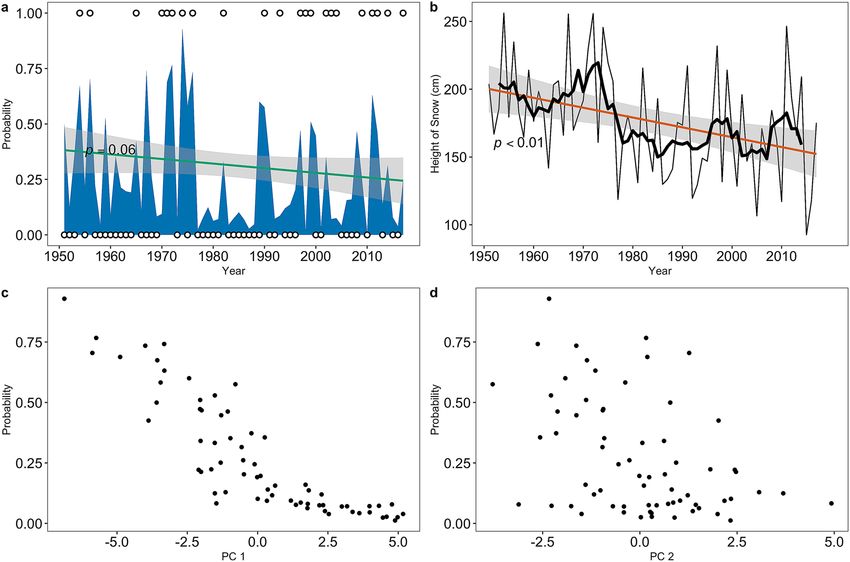
www.nature.com/scientificreports/
Figure 2. Time series and boxplots of snowpack and winter precipitation. Time Series of snow water equivalent
(SWE) (a) with avalanche years represented by red triangles and the annual mean SWE for the period of record
(green horizontal line). SWE values between avalanche (blue box) and non-avalanche (red box) years for (b)
regional maximum snow water equivalent ( SWEmax) and maximum snow depth (HSmax), and (c) significant
monthly and winter precipitation totals. Horizontal black lines in the boxplots represent median values. (a)
Displays only 23 out of 30 identified avalanche years because the analyzed period of record of SWE and HS
begins in 1950 due to sparse data prior to 1950.
Figure 3. Boxplots of atmospheric variables and indices exhibiting a significant (p = 0.05) difference between
conditions occurring in avalanche (blue) versus non-avalanche (red) years using the Wilcoxon rank-sum
test. Sample size varies due to varying periods of record for each variable (Supplementary Table S6). Y-axis is
the normalized indices of all variables for direct comparison. Full descriptions of results of each atmospheric
variable are shown in Supplementary Table S2.
Scientific Reports | (2021) 11:10032 | https://doi.org/10.1038/s41598-021-89547-z 4
Vol:.(1234567890)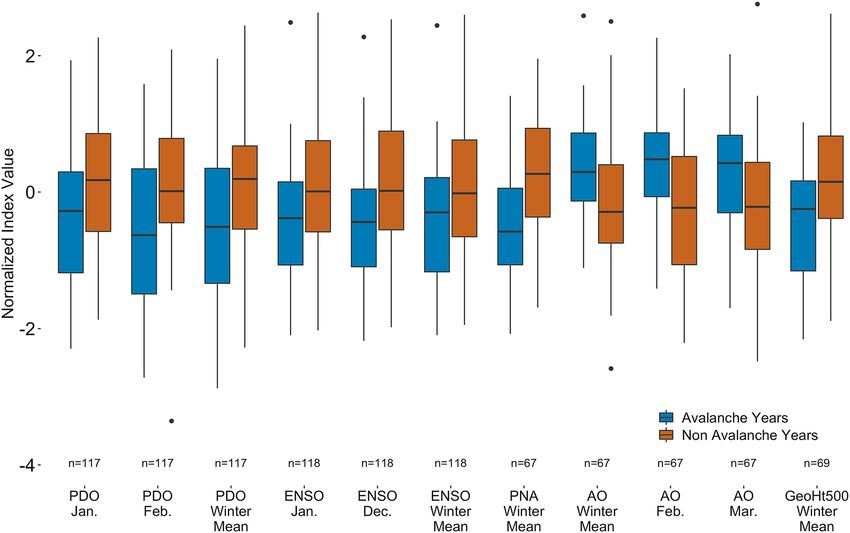
www.nature.com/scientificreports/
Figure 4. Time series plots of select principal components (PCs). (a) PC1 is negatively correlated with HSmax
and positively correlated with mean winter PDO. PC1 and mean winter PDO are inverted (i.e. x(− 1)) to show
decreasing trend of HSmax. (b) PC2 is negatively correlated with February, March, and winter mean AO. PC2 is
inverted (i.e. x(− 1)) to show increasing temperature trend. (c) PC3 is positively correlated with ENSO mean
winter ENSO index. (d) PC6 is negatively correlated with March precipitation. PC6 is inverted (i.e. x(− 1))
to show correspondence with March precipitation patterns. These plots show only the greatest one or two
contributors given the strong correlation of these variables to the rest of the top five contributors within each
principal component (see Supplementary Figure S1).
within and between variables and (2) reduce the number of strongly co-linear potential predictors in a general-
ized linear modeling framework exploring climate-avalanche relationships. From 1950 to 2017, the PCA results
in six principal components (PC1–PC6) with eigenvectors greater than one, capturing ~ 83% of the total variance
across our climate datasets (Supplementary Figure S1). The first two principal components alone account for
more than half of the variance within the dataset (~ 54%).
PC1 is representative of total winter precipitation and accumulated snowpack (Fig. 4a). The largest five
climate related variables contributing to PC1 (r2 ~ 94%) are HSmax, February PDO, SWEmax, PDO winter mean,
and PNA winter mean (Fig. 4a and Supplementary Figure S1). Accordingly, ocean to atmosphere teleconnected
indices such as the PDO and PNA are highly correlated (r = 0.74) with each other, as is the associated linkage
between atmospheric circulation (i.e., the PNA) and regional HSmax (r = − 0.62) (Supplementary Figure S2). PC1
is negatively correlated with HSmax and SWEmax (r = − 0.88 and − 0.85, respectively) and positively correlated
with February PDO, PDO winter mean, and PNA winter mean (r = 0.87, 0.84, and 0.82, respectively) (Fig. 4a
and Supplementary Figure S3).
PC2 reflects winter temperatures and the atmospheric circulation indices most influential in driving year-to-
year winter temperature variability (Fig. 4b). The largest five contributors ( r2 ~ 90%) to PC2 reflect the importance
of temperature in driving the variability within PC2 and include winter mean minimum temperature (Tmin),
February Arctic Oscillation (AO), mean winter AO, March AO, and winter mean maximum temperature (Tmax)
(Fig. 4b and Supplementary Figure S1). PC2 is negatively correlated with February, March, and winter mean AO
(r = − 0.68, − 0.63, and − 0.66, respectively) as well as winter T min and Tmax (r = − 0.69 and − 0.62, respectively)
(Fig. 4b).
Strong El Nino Southern Oscillation (ENSO) driven inter-annual (sub-decadal) variability in winter precipita-
tion totals are captured and represented in PC3 (Fig. 4c). Accordingly, the largest five contributors (r2 ~ 83%) to
PC3 include January ENSO, winter mean ENSO, December ENSO, January total precipitation, and total winter
precipitation (Fig. 4c). January ENSO, winter mean ENSO, and December ENSO are positively correlated with
PC3 (r = 0.56, 0.55, and 0.53, respectively). January precipitation and total winter precipitation are also positively
correlated with PC3 (r = 0.5 and 0.41, respectively).
Late winter or early spring precipitation, particularly in the month of March is captured by PC6 (Fig. 4d).
Though PC6 only accounts for 4.5% of the total variance in the climate dataset, this statistic simply reflects inde-
pendence of individual monthly winter season precipitation totals from other climate variables, it’s later shown
to be an important predictor of avalanche probability. The contribution of March precipitation to PC6 explains
Scientific Reports | (2021) 11:10032 | https://doi.org/10.1038/s41598-021-89547-z 5
Vol.:(0123456789)www.nature.com/scientificreports/
Figure 5. Regional avalanche probability and the major contributing variables. (a) Probability of an avalanche
year in blue (white circles; 1 = observed avalanche year, 0 = observed non-avalanche year) using the generalized
linear autoregressive moving average model. The green line represents a generalized linear model trend with
95% CIs shaded in gray. The p-value of 0.06 suggests a decreasing trend. (b) Time series of maximum snow
depth (HSmax) (cm) (a major contributor to and function of the first principal component (PC1)) during the
period of record. The red line represents a generalized linear model trend with 95% confidence intervals shaded
in gray. The p-value of < 0.01suggests a decreasing trend. The black line denotes a 6-year moving average to the
time series. (c) The probability of an avalanche year as a function of the values of PC1. (d) The probability of an
avalanche year as a function of the values of the second principal component (PC2).
nearly half the variance ( r2 ~ 41%). Other major contributors to PC6 include monthly precipitation values from
November, December, January, and February (total r 2 ~ 89%). PC6 is most strongly and negatively correlated
with March precipitation (r = − 0.64) (Fig. 4d).
Finally, a subset PCA on the post-1990 dataset was run and compared against a pre-1990 subset since after
1990 many avalanche years coincide with lower SWEmax. The subset analysis exhibited similar patterns in both
explained variance as well as contributions from all PCs (Supplementary Table S3).
Non‑stationary climate drives the changing probability of avalanche years. In developing more
quantitative relationships between climate conditions and large magnitude avalanche years, we fit a Generalized
Linear Autoregressive Moving Average (GLARMA) model to the first six orthogonal PCs. The best-fit GLARMA
model (lowest Akaike information criterion: 73.1) contains a moving average (MA) order of 6 with significant
p-values from the Likelihood ratio and Wald tests (p = 0.01 and 0.01, respectively), suggesting the model is suit-
able. The model identifies PC1 snowpack (p < 0.01), PC2 temperature (p = 0.07), and PC6 late winter/spring
precipitation (p = 0.04) as the most significant variables out of the potential six input principal components
(Supplementary Table S4).
The resulting estimates of the probability of an avalanche year through time exhibit a slight negative trend
over the 1950 to 2017 time period (tau = -0.16, Sens slope = − 0.002, p = 0.06) (Fig. 5a). This roughly translates to
a 2% reduction in avalanche probability per decade, and ~ 14% overall reduction over the period of record. The
trend of HSmax, the largest contributor to and function of the other atmospheric index and variable contributors
of PC1, decreases over time (tau = − 0.25, Sens slope = − 0.73, p < 0.01) (Fig. 5b). Accordingly, the probability of
an avalanche year decreases as PC1 become more positive (r = − 0.87) (Fig. 5c). As PC1 becomes more positive,
HSmax and S WEmax both decrease, and the PDO and PNA indices become more positive. The probability of a large
magnitude avalanche year and PC2 are moderately negatively correlated (r = − 0.43) (Fig. 5d), reflecting the influ-
ence of warmer winter temperatures. PC6 is weakly negatively correlated (r = − 0.35) with avalanche probability
throughout the entire time series. However, we identified a positive trend (p = 0.02) trend from 1980 to 2017 in
the March precipitation signal and examined large magnitude avalanche probability as a function of PC6 from
1980 to 2017. This resulted in a significant (p = 0.06) negative (decreasing) trend of PC6 through this condensed
Scientific Reports | (2021) 11:10032 | https://doi.org/10.1038/s41598-021-89547-z 6
Vol:.(1234567890)www.nature.com/scientificreports/
time series, which is negatively correlated with March precipitation. A slight but significant relationship exists
between PC6 and the probability of large magnitude avalanche years from 1980 to 2017 (r = − 0.5, p < 0.01).
One of the expectations of a changing climate is an increase in intense or extreme precipitation events. To
address this potential influence, we examined winter daily precipitation at a valley station (Kalispell, Montana
(901 m)) from 1950 to 2017 (the period of record for our study). We then estimated trends using the non-para-
metric Mann–Kendall test for the top 1% (n = 49) and top 10% (n = 476) of winter days with positive precipitation
values and found no evidence for significant trends in either daily precipitation record (Mann–Kendall, p = 0.71
and p = 0.87, respectively). We also examined winter daily snow water equivalent (SWE) accumulation at the
Flattop Mountain Snow Telemetry (SNOTEL) site (1920 m) from 1970 to 2021. We calculated and tested the top
1% (n = 93) and top 10% (n = 908) of winter days with positive SWE accumulation and again found no significant
trends in either daily SWE record (Mann–Kendall, p = 0.46 and p = 0.69, respectively).
Finally, to identify potential conditions unique to large magnitude regional avalanches during low snowpack
conditions we examined and compared the surface climatology of years with and without regional avalanche
events. Results failed to yield anything of significance related to potential climate triggers of large-magnitude
avalanches occurring during recent low snowpack conditions. However, we also note the small sample size of
avalanche years (n = 7) in this subset of our dataset, which is likely insufficient for statistical comparison.
Discussion
We used avalanche damage events recorded in tree-ring samples from 12 avalanche paths to derive a regional
large magnitude avalanche chronology for the U.S. northern Rocky Mountains. Our results illustrate that specific
seasonal climate and atmospheric circulation variables contribute to years with common avalanche events across
the region. H
Smax and SWEmax exhibit negative trends throughout the period of record in our region with large
magnitude avalanches occurring, on average, during years with greater H Smax and S WEmax. However, over recent
decades (and H Smax and SWEmax decreases), years characterized by large magnitude avalanches and negative
snowpack anomalies become more frequent. This suggests that regional avalanches can and do occur during years
with below average snowpack. Snow structure is an important factor in avalanche release, and with a prerequisite
weak layer in the snowpack, one loading event (i.e., storm) can initiate an avalanche. If that weak layer is deep
in the snowpack, even a below average snowpack can produce a large magnitude regional avalanche event. In
this study region, sufficient snowpack structure data are non-existent prior to the early twenty-first century.
In our PCA and subsequent GLARMA analysis assessing climate relationships to regional avalanche activity,
PC1 and PC2 explain nearly 55% of the variance of the data. The largest contributors to PC1 associated with
large magnitude avalanche years are positive anomalies of HSmax and SWEmax, and negative anomalies of the
PDO and PNA (Fig. 4a). These contributors suggests that PC1 represents snowfall and storminess. Years with a
negative PDO index, a pattern of Pacific climate variability based on sea surface temperature anomalies in the
North Pacific33, are characterized by relatively persistent low pressure anomalies centered over western North
America, which is conducive to more frequent Arctic air outbreaks. More frequent cold air outbreaks in the
region provide more opportunity for faceted snow crystal growth leading to the development of weak layers
in the snowpack and the preservation of snow cover later in the winter when accumulation is g reatest34. This
potential snowpack structure, combined with positive snowpack anomalies ( HSmax and S WEmax) associated with
PC1, provides the ideal ingredients for large magnitude avalanches: deep snowpack, potential weak layer deep
in the snowpack, and abundant snowfall (or at least one large storm/snow loading event). The PNA, associ-
ated with strong fluctuations in the east Asian jet stream and the jet exit region, influences precipitation in the
northwestern United States. The positive phase of the PNA contributes to a decreasing fraction of snowfall in
winter precipitation and an increase in storms with anomalously high freezing l evels11, while the negative phase
is associated with an intensification of a trough in the North Pacific setting the stage for increased precipitation
in the western United S tates7.
Our results are consistent with earlier work that suggests the PDO and related PNA atmospheric pattern
as potential drivers of snowpack change in the northern Rockies on multi-decadal scales11. Winters associated
with positive snowpack anomalies, avalanche extremes, and increased storminess tend to be associated with
negative PDO and PNA conditions in the northern U.S. Rocky Mountains7,10,17. The positive phase of these
indices is associated with generally low snowpack, positive atmospheric height anomalies, and above-average
temperatures over western Canada and the western U.S. Reardon et al.35 also found avalanche activity in southern
GNP, Montana, documented in tree-ring records from the Shed 10-7 path (also used in this study) and historical
records, correlated with positive snowpack anomalies associated with negative PDO and PNA values. This is also
broadly consistent with the climate avalanche relationships shown by Butler21 for GNP, Montana, and Fitzharris
and Schaerer20 in the Canadian Selkirk Mountains, located 400 km to the northwest of GNP.
Contributing ~ 14% of the explained variance in the climate dataset, PC2 represents the influence of warm-
ing temperatures on large magnitude avalanche years in our dataset. The major atmospheric contributor in PC2
to warm winter temperatures are positive anomalies in the AO (Fig. 4b). The positive phase of the AO is often
associated with fewer cold air outbreaks in the mid-latitudes, while during the negative phase, the jet stream shifts
toward the equator delivering more frequent outbreaks of colder air. The main avalanche years associated with
PC2 are 1990, 2002, and 2003 (Supplementary Figure S3b). Avalanche events in 1990 and 2003 occurred during
winters with above average temperature, and all 3 years are associated with positive February, March, and winter
mean AO conditions. The contribution of temperature and the AO to PC2 within the GLARMA model suggests
that several of the avalanche years, particularly in recent decades, are potentially driven by anomalous warm-
ing events. Whether this principal component is associated with wet snow avalanches is difficult to determine.
We are unable to distinguish between wet and dry snow avalanches from the tree-ring record, though the more
recent observational record from John F. Stevens Canyon (JFS) sub-region provides some insight. Both dry and
Scientific Reports | (2021) 11:10032 | https://doi.org/10.1038/s41598-021-89547-z 7
Vol.:(0123456789)www.nature.com/scientificreports/
wet slab avalanches occurred during the major March 2003 avalanche cycle in southern Glacier National Park
that destroyed mature forests and closed a major transportation c orridor1. Though warming winter tempera-
tures represented by PC2 explain a small proportion of overall variance of our climate data, it may become an
increasingly important driver of large magnitude avalanche years. For example, our results highlight that large
magnitude avalanches can occur during years with below average snowpack (n = 7) (e.g., after ~ 1989), and some
of those years correspond to warm temperature anomalies shown in PC2 and increasing spring precipitation. As
winter and spring temperatures continue to warm in the region36, temperature may become a more influential
driver of large magnitude avalanche years.
The results of the Wald and Likelihood Ratio tests suggest a good GLARMA model fit indicating significant
relationships exist between surface climate conditions and regional large magnitude avalanche years. The model
estimates avalanche probability using a 6-year moving average term and the snowpack (PC1), winter tempera-
ture (PC2), and early spring precipitation (PC6) as significant predictor variables. In related work, Ballesteros-
Canovas et al.37 first used a GLARMA model to estimate the probability of avalanche years in the western Indian
Himalayas and found increasing winter air temperature to be the sole significant predictor of avalanche years.
Our results show a more nuanced and complicated relationship than increasing air temperature contributing
directly to an increase in wet snow avalanche activity through time. Specifically, the significance of PC6 in the
GLARMA model shows that precipitation is also an important factor, particularly spring precipitation in the
month of March. At present, increasing temperatures appear to correspond with a small subset of recent ava-
lanche years, while positive snowpack anomalies and low-pressure persistence over the region are the dominant
driver of large magnitude avalanche years.
We demonstrate that it is possible to quantify non-stationary trends in climate-avalanche relationships and
estimate changing probabilities of avalanche activity through time using the GLARMA model. We find a slight,
but significant, decrease (~ 2% per decade, ~ 14% over the period of record) in the probability of large magnitude
avalanche years from 1950 to 2017 (Fig. 5a). This result contrasts with a study using a smaller sample size of
tree-ring records across a much smaller spatial extent in the western Himalaya in India that found increasing
probability of avalanche a ctivity37. However, our results showing decreasing avalanche probability relate to a
study in the French Alps where a decrease in dry snow avalanche activity was documented over the mid-1970s
to the early twenty-first c entury25. In terms of documented changes in avalanche activity, rather than avalanche
probability, other regional studies in western Canada and Europe, using historical observational records, found
no trend in avalanche activity22,24,27. These studies, however, investigated potential changes in avalanche frequency
across all size classes of avalanches, not just large magnitude avalanches.
The decrease in HSmax and SWEmax through time corresponds directly to the estimated year-to-year and long-
term decrease in avalanche probability. This relationship is also described by Dixon et al.38 who found decreased
avalanche activity during El Niño years in Glacier National Park, which are typically characterized by negative
snowpack anomalies. The implication of further warming driven decreases in snowpack is the likely reduction
in future large magnitude avalanche activity across the region.
Annual snowpack loss exists throughout the western U.S. except for the highest elevations39,40. Though the
probability of large magnitude avalanche years decreases through time as snowpack decreases, our results indicate
large magnitude avalanches can occur during years of below average snowpack. This can partially be explained
by warmer temperatures (the largest contributor to PC2) causing wet storms, or rain-on-snow events trigger-
ing large magnitude avalanches. In other words, though a decreasing probability of large magnitude avalanche
years corresponds to snowpack decreases, warming temperatures can contribute to large magnitude avalanche
years—at least over the near-term—through different mechanisms that are perhaps compensating for the effect
of snowpack losses.
In addition, lower elevation snowpacks are more susceptible to a warming climate and exhibit greater snow-
pack loss12,40,41, but higher elevations are projected to experience stable or increasing snowpack due to increased
precipitation across the r egion42. Future precipitation projections and recent observations also indicate a smaller
fraction of precipitation falling as snow, particularly at lower e levations39,43. These projections and observations
align with our results in that a slight increase in precipitation translates to snow in many of the avalanche path
starting zones but less snow throughout the track and runout zone. The increased surface roughness at lower
elevations due to the presence of vegetation is likely to decrease avalanche runout distances. The potential effect
this increased roughness has on large magnitude avalanche occurrence is that large avalanches may still initiate
at upper elevations but may not be able to reach lower elevations due to lack of snow cover in the lower track
and runout zones.
Finally, we examined all avalanche and non-avalanche years associated with low snowpack anomalies for a
surface climatology signal to help explain the occurrence of large magnitude avalanches during those years. The
small sample size of avalanche years (n = 7) in this subset of conditions, however, limits our ability to accurately
discern any significant climatic drivers potentially related to large magnitude avalanches during low snowpack
conditions. Given the lack of snow structure data we are limited in our interpretation of whether the seven ava-
lanche years can be attributed to one large storm and antecedent weak snowpack during an otherwise low snow
year or to a general change in avalanche character. Given that our results suggest temperature (as part of PC2) is
a significant driver of large magnitude avalanche years, it is possible that large magnitude avalanche years asso-
ciated with negative snowpack anomalies are due to a changing avalanche character. In other words, there may
be a shift from large magnitude avalanche years influenced primarily by storminess and abundant snowfall to
large magnitude avalanche years increasingly influenced by warmer temperatures and wet snow avalanches. This
possible shift coincides with other studies in the French Alps where the proportion of powder snow avalanches
decreased25, and Swiss Alps where wet snow avalanche activity increased since the mid-1900s26.
Our analysis shows an increase in March precipitation from ~ 1980 to 2017. The relationship of PC6, of
which March precipitation is the largest contributor, with avalanche probability from 1980 to 2017 suggests
Scientific Reports | (2021) 11:10032 | https://doi.org/10.1038/s41598-021-89547-z 8
Vol:.(1234567890)www.nature.com/scientificreports/
that increasing spring precipitation is a partial driver of large magnitude avalanches during years with negative
snowpack anomalies. The influence of spring precipitation on the probability of a large magnitude avalanche
year during the latter part of our time series combined with warming temperatures provides further evidence for
a potentially increasing influence of wet snow avalanches. This potential increase in wet snow avalanches may
partially explain and buffer further decreases in the probability of large magnitude avalanche years through time.
This study provided insight into the complex climate drivers of large magnitude avalanche years, but disen-
tangling the climate signal from the more frequent and influential weather signal when analyzing avalanches
remains difficult. Simply one large storm in a season combined with a snowpack with antecedent weak layers
can cause a large magnitude avalanche. However, widespread large magnitude avalanching is only likely to be
captured with a large enough sampling extent and intensity. Our regional sampling strategy allowed for a more
scale appropriate assessment of regional avalanche activity and related climate drivers. The large spatial extent,
sample size, and the nested sampling of sub-regions aligns with the synoptic influence of climate drivers.
We used a regional avalanche chronology that extends back to 1867, but high-quality observational climate
record lengths required climate-avalanche analyses be conducted over 1950 to 2017. The large sample size and
regional spatial extent are inherent strengths of this study, yet the non-stationarity of snowpack and temperature
within a changing climate complicates the relationships between large magnitude snow avalanches and synoptic-
rivers44. Future work with longer avalanche datasets could consider further elucidating the effect of
scale climate d
climate drivers on avalanche frequency and avalanche character. In addition, the PCA and subsequent GLARMA
model reasonably explain the historical and recent climate drivers of large magnitude avalanche years in our
dataset, but the model may be limited in predicting large magnitude avalanche years in the future due to climate
non-stationarity and the associated potential changes in avalanche character. Though we did not investigate
changes in runout altitude of large magnitude avalanches, future work could examine the effects of low elevation
snowpack loss in the region on avalanche runout across the region.
Methods
Regional avalanche network. The concept of the scale triplet28 informed how we constructed a net-
work of three individual paths to represent a subregion, then used a network of four distinct subregions (12
paths total) to represent the annual large magnitude avalanche activity representative of the northern Rocky
Mountains in northwest Montana, USA (Fig. 1)30. The four distinct sub-regions are located within three moun-
tain ranges: the Whitefish Range (WF, Red Meadow Creek) and Swan Range (Swan, Lost Johnny Creek) on
the Flathead National Forest, and two sub-regions within the Lewis Range in Glacier National Park (GNP)
(Going-to-the-Sun Road (GTSR) and John F. Stevens Canyon (JFS)). The individual avalanche paths in each
sub-region encompass a range of spatial extents from being located adjacent to one another up to locations as
distant as ~ 10 km apart. The distance between any two sub-regions ranged from ~ 40 to ~ 95 km, and the total
regional extent of the study area encompasses ~ 3500 km2 with an average per path area of 0.35 km2.
Northwest Montana is classified as both coastal transition and intermountain avalanche climates7 and exhibits
characteristics of both continental and coastal climates. Avalanche paths within the study site range from ~ 1100
to 2700 m in elevation and cover all aspects except true North. The mean annual precipitation across the start-
ing zone elevation of the avalanche paths is 1693 m m45, and peak snow water equivalent (SWE) typically occurs
mid- to late-April with a median value of ~ 1100 mm at the highest elevation station (1920 m, 1970–2018)46.
Trees are susceptible to damage from geomorphic processes, such as an avalanche, and individual trees record
the effects of mechanical disturbance caused by external factors. An avalanche may cause wounds on the trunk
or branches. It can also locally destroy the cambium causing disruption of new cell formation. The tree then
produces callus tissue, and the cambium cells overgrow the injury forming a “scar” on the tree-ring. Other types
of mechanical disturbance from avalanches include reaction wood and traumatic resin ducts47.
Within avalanche paths we targeted an even number of samples collected along the margins of each avalanche
path at varying elevations as well as trees located throughout the runout zone. We analyzed 26–109 samples per
avalanche path resulting in 673 total samples from 647 suitable trees. Of those 673 samples, we collected 614
cross sections (91%) and 59 cores (9%). See Peitzsch et al.29 for processing methodology and tree-ring avalanche
signal classification, and Peitzsch et al.30 for further details on cross-dating methods and accuracy calculation
for this dataset.
Data preparation and all analyses were completed in R48. For tree-ring data, we used the package slideRun,
an extension of the burnR library for forest fire history d ata49. We employed a multi-step process to generate a
regional avalanche c hronology . First, we implemented a double threshold a pproach50,51 using the number of
29
growth disturbances (GD) per year and an avalanche index It52 to distinguish between avalanche signals and
noise (i.e., irregular growth, snow creep, non-avalanche disturbance). We then used the individual avalanche path
chronologies derived from the double threshold approach to calculate weighted index factor (Wit, adapted from
Kogelnig-Mayer et al.53 and Favillier et al.51) as a quality control measure to refine the regional and sub-regional
large magnitude avalanche chronologies. We used a threshold of W it = 0.2 to exclude years with low levels of
confidence based on the quality of avalanche signals, as per Favillier et al.51, to provide us with a final avalanche
chronology for four sub-regions and the overall region.
Climate and snow data. We used historical U.S. Department of Agriculture National Resource Conser-
vation Service (NRCS) snow course data46 from seven middle to upper elevation sites nearest the sub-region
sites. We calculated mean seasonal maximum snow water equivalent (SWEmax) and snow depth (HSmax) at each
of the seven sites and averaged the values to produce an annual time series of seasonal maximum snow water
equivalent representative of the entire region of study (Supplementary Table S5). These snow course sites are
representative of the elevations of the starting zones and tracks of the avalanche paths in this study.
Scientific Reports | (2021) 11:10032 | https://doi.org/10.1038/s41598-021-89547-z 9
Vol.:(0123456789)www.nature.com/scientificreports/
Upper elevation precipitation and temperature records are only available from the early 1980s to present
making them too temporally limited for use in analyses. Therefore, we used temperature records from the Global
Historical Climatology Network (GHCN)39 to derive a longer-term (1900–2017) spatially extensive dataset54 for
the region. To accomplish this, we applied seasonally dynamic winter (December through March) lapse rates to
the Kalispell Glacier Airport site (elevation = 901 m, Fig. 1) for upper elevation sites. Then, we derived tempera-
ture lapse rates for each sub-region using the existing upper elevation network values relative to the Kalispell
site. These upper elevation sites are NRCS SNOTEL sites located throughout the region. We used the gridded
precipitation dataset from Daly et al.55 (Parameter-elevation Regressions on Independent Slope Model [PRISM])
that encompasses the study area with a 4-km resolution45 to estimate winter (December through March) mean
total precipitation values as well as monthly values for November through March. We calculated the mean pre-
cipitation for four grids that represented each sub-region and averaged those values to produce a time series of
monthly (November through March) precipitation representative of the study region.
We obtained monthly and winter mean values for atmospheric circulation and the common indices represent-
ing large-scale, ocean–atmosphere teleconnections that affect western North America climate from the United
States National Oceanic and Atmospheric Administration National Centers for Environmental Information56
(Supplementary Table S6). We included the following variables with demonstrated effects on winter air tem-
perature and precipitation: 500-mb geopotential height anomalies, Arctic Oscillation (AO), El Niño/Southern
Oscillation (ENSO, Niño 3.4 index), Pacific Decadal Oscillation (PDO), and the Pacific-North America Index
(PNA). All data underwent quality control as per Z ahumensky57.
Large magnitude regional avalanche climate and trend analyses. We assessed trends in the fol-
lowing variables: winter SWEmax, winter HSmax, monthly and winter temperature (maximum, mean and mini-
mum), and monthly and winter mean precipitation using a winter season defined to be December–March. To
detect trends in variables, we used the non-parametric Mann–Kendall test58 or the modified Mann–Kendall
test59 if the time series exhibited serial correlation. For the trend tests and all subsequent analyses, we use 0.05 as
a significance level, but do not employ a strict cutoff of 0.0560.
To assess potential climate drivers of regional large magnitude avalanche years, we compared all climate
variables for avalanche years and non-avalanche years using the Wilcoxon rank-sum test61. Climate variables
exhibiting a significant difference between avalanche year types were then used in a principal component analysis
(PCA) along with seasonal temperature and precipitation variables to reduce dimensionality of highly correlated
explanatory variables. Before PCA, all variables were scaled and centered by the mean. The number of principal
components retained exhibited eigenvalues greater than one, or that the combination of the leading principal
components explained at least 80% percent of the total variance62. We performed all analyses over a common
period beginning in 1950 and extending to 2017 since this period provided maximum overlap with available
climate variables. After 1990 several avalanche years coincide with lower SWEmax, so we conducted a PCA on
the post-1990 subset of the data to identify any shifts in the climate-avalanche relationship and compared that
to a pre-1990 subset of the data. We then examined the relationship of these first six axes of the PCA as orthogo-
nal predictors of a binary response (avalanche year/non-avalanche year) by fitting a GLARMA (generalized
autoregressive moving average) model. This technique was used to examine avalanche activity in the western
Himalaya37. We used the glarma package63 in R to specify a binomial distribution with estimation optimized using
the Newton–Raphson iterative method. A likelihood ratio and Wald test allowed us to assess the goodness of
fit. If the p-value was less than 0.05, we rejected the null hypothesis that the model is a generalized linear model
with the same regression structure for the alternative hypothesis supporting the GLARMA model. Autoregres-
sive (AR (φ)) and moving average (MA (θ)) order values were determined from examining autocorrelation and
partial autocorrelation plots. We selected the final model with specific AR and MA terms based on the lowest
Akaike Information Criterion (AIC) score.
Finally, we examined the surface climatology of all avalanche and non-avalanche years associated with nega-
tive snowpack anomalies to help identify potential conditions unique to large magnitude regional avalanches
during low snowpack conditions. We used a Wilcoxon rank-sum test to compare the monthly temperature
and precipitation values corresponding with avalanche and non-avalanche years. We also examined trends in
extreme precipitation events by using the Mann–Kendall test on the largest 1 and 10% winter daily precipitation
from 1950 to 2017 at a valley station (Kalispell, Montana (901 m)) from 1950 to 2017 (the period of record for
our study). We also examined winter daily snow water equivalent (SWE) accumulation at the Flattop Mountain
Snow Telemetry (SNOTEL) site (1920 m) from 1970 to 2021 (the longest running mid to upper elevation site
with precipitation and snow water equivalent measurements in the region).
Disclaimer. Any use of trade, firm, or product names is for descriptive purposes only and does not imply
endorsement by the U.S. Government.
Data availability
Data for this work can be found in ScienceBase repository: Peitzsch, E. H., Stahle, D. K., Fagre, D. B., Clark, A.
M., Pederson, G. T., Hendrikx, J., and Birkeland, K. W.: Tree ring dataset for a regional avalanche chronology
in northwest Montana, 1636-2017. U.S. Geological Survey., U.S. Geological Survey data release, https://doi.org/
10.5066/P9TLHZAI, 2019.
Received: 12 January 2021; Accepted: 27 April 2021
Scientific Reports | (2021) 11:10032 | https://doi.org/10.1038/s41598-021-89547-z 10
Vol:.(1234567890)www.nature.com/scientificreports/
References
1. Reardon, B. A., Fagre, D. B. & Steiner, R. W. Natural avalanches and transportation: a case study from Glacier National Park,
Montana, USA. In Proceedings of the International Snow Science Workshop, Sept. 19–24, Jackson, WY, U.S.A. (ed Elder K) 582–597
(2004).
2. Armstrong, B. R. A quantitative analysis of avalanche hazard on U.S. Highway 550, southwestern Colorado. In Proceedings of the
Western Snow Conference, St. George, Utah, U.S.A., April 14–16, 95–104 (1981).
3. Hendrikx, J., Murphy, M. & Onslow, T. Classification trees as a tool for operational avalanche forecasting on the Seward Highway,
Alaska. Cold Reg. Sci. Technol. 97, 113–120. https://doi.org/10.1016/j.coldregions.2013.08.009 (2014).
4. Wayand, N. E. et al. A meteorological and snow observational data set from Snoqualmie Pass (921 m), Washington Cascades,
USA. Water Resour. Res. 51, 10092–10103 https://doi.org/10.1002/2015WR017773 (2015).
5. Blattenberger, G. & Fowles, R. The road closure decision in Little Cottonwood Canyon. In Proceedings of the International Snow
Science Workshop, Oct. 30-Nov. 3, Snowbird, Utah, U.S.A., 537–547 (1994).
6. Mock, C. J., Carter, K. C. & Birkeland, K. W. Some perspectives on avalanche climatology. Ann. Am. Assoc. Geogr. https://doi.org/
10.1080/24694452.2016.1203285 (2016).
7. Mock, C. J. & Birkeland, K. W. Snow avalanche climatology of the western United States mountain ranges. Bull. Am. Meteorol. Soc.
81, 2367–2392. https://doi.org/10.1175/1520-0477(2000)081%3C2367:SACOTW%3E2.3.CO;2 (2000).
8. Armstrong, R. L. & Armstrong, B. R. Snow and avalanche climates of the western United States: A comparison of maritime, inter-
mountain, and continental conditions. In The Davos Symposium, September, 1986, Avalanche Formation, Movement and Effects,
IAHS Publication Vol. 162, 281–294 (1987).
9. Lazar, B., Greene, E. & Birkeland, K. W. Avalanche problems and public advisories. Avalanche Rev. 31, 14–15 (2012).
10. Pederson, G. T. et al. Climatic controls on the snowmelt hydrology of the northern Rocky mountains. J. Clim. 24, 1666–1687.
https://doi.org/10.1175/2010JCLI3729.1 (2011).
11. Abatzoglou, J. T. Influence of the PNA on declining mountain snowpack in the Western United States. Int. J. Climatol. 31, 1135–
1142. https://doi.org/10.1002/joc.2137 (2010).
12. Pederson, G. T., Betancourt, J. L. & McCabe, G. J. Regional patterns and proximal causes of the recent snowpack decline in the
rocky mountains U.S.. Geophys. Res. Lett. 40, 1811–1816. https://doi.org/10.1002/grl.50424 (2013).
13. McCabe, G. J. Relationships between atmospheric circulation and snowpack in the Gunnison River Basin, Colorado. J. Hydrol.
157, 157–175 (1994).
14. McCabe, G. J. & Dettinger, M. D. Primary modes and predictability of year-to-year snowpack variations in the Western United
States from teleconnections with Pacific ocean climate. J. Hydrometeorol. 3, 13–25. https://doi.org/10.1175/1525-7541(2002)003%
3C0013:PMAPOY%3E2.0.CO;2 (2002).
15. Pederson, G. T. et al. The unusual nature of recent snowpack declines in the North American Cordillera. Science 333, 332–335.
https://doi.org/10.1126/science.1201570 (2011).
16. Mock, C. J. Climatic controls and spatial variations of precipitation in the western United States. J. Clim. 9, 1111–1125 (1996).
17. Birkeland, K. W., Mock, C. J. & Shinker, J. J. Avalanche extremes and atmospheric circulation patterns. Ann. Glaciol. 32, 135–140
(2001).
18. Fitzharris, B. B. & Bakkehoi, S. A synoptic climatology of major avalanche winters in Norway. J. Climatol. 6, 431–446 (1986).
19. Birkeland, K. W. & Mock, C. J. Atmospheric circulation patterns associated with heavy snowfall events, Bridger Bowl, Montana,
USA. Mt. Res. Dev. 16, 281–286 (1996).
20. Fitzharris, B. B. & Schaerer, P. A. Frequency of major avalanche winters. J. Glaciol. 26, 43–52 (1980).
21. Butler, D. R. Snow-avalanche hazards in Glacier National Park, Montana: Meteorological and climatologic aspects. Phys. Geogr.
7, 72–87 (1986).
22. Bellaire, S., Jamieson, B., Thumlert, S., Goodrich, J. & Statham, G. Analysis of long-term weather, snow and avalanche data at
Glacier National Park, B.C. Canada. Cold Regions Sci. Technol. 121, 118–125. https://doi.org/10.1016/j.coldregions.2015.10.010
(2016).
23. Laternser, M. & Schneebeli, M. Long-term snow climate trends of the Swiss Alps (1931–99). Int. J. Climatol. 23, 733–750 (2003).
24. Laternser, M. & Schneebeli, M. Temporal trend and spatial dristribution of avalanche activity during the last 50 years in Switzerland.
Nat. Hazards 27, 201–230 (2002).
25. Eckert, N., Keylock, C. J., Castebrunet, H., Lavigne, A. & Naaim, M. Temporal trends in avalanche activity in the French Alps and
subregions: From occurrences and runout altitudes to unsteady return periods. J. Glaciol. 59, 93–114. https://doi.org/10.3189/
2013JoG12J091 (2013).
26. Pielmeier, C., Techel, F., Marty, C. & Stucki, T. Wet snow avalnache activity in the Swiss Alps—trend analysis for mid-winter season.
In Proceedings of the International Snow Science Workshop, Oct. 7–13, Grenoble, France (eds Naaim-Bouvet, F. et al.) 1240–1246
(2013).
27. Eckert, N., Parent, E., Kies, R. & Baya, H. A spatio-temporal modelling framework for assessing the fluctuations of avalanche
occurrence resulting from climate change: Application to 60 years of data in the northern French Alps. Clim. Change 101, 515–553.
https://doi.org/10.1007/s10584-009-9718-8 (2009).
28. Blöschl, G. & Sivapalan, M. Scale issues in hydrological modelling: A review. Hydrol. Process. 9, 251–290. https://doi.org/10.1002/
hyp.3360090305 (1995).
29. Peitzsch, E. et al. A regional spatiotemporal analysis of large magnitude snow avalanches using tree rings. Nat. Hazard Earth Sys.
21, 533–557. https://doi.org/10.5194/nhess-21-533-2021 (2021).
30. Peitzsch, E. H. et al. Tree ring dataset for a regional avalanche chronology in northwest Montana, 1636–2017. U.S. Geological
Survey. US Geol. Surv. Data Release https://doi.org/10.5066/P9TLHZAI (2019).
31. Germain, D. A Statistical framework for tree-ring reconstruction of high-magnitude mass movements: Case study of snow ava-
lanches in eastern Canada. Geogr. Ann. Ser. B 98, 303–311. https://doi.org/10.1111/geoa.12138 (2016).
32. Greene, E. et al. Snow, Weather, and Avalanches: Observation Guidelines for Avalanche Programs in the United States 3rd edn, Vol.
3 (American Avalanche Association, 2016).
33. Mantua, N. J. & Hare, S. R. The pacific decadal oscillation. J. Oceanogr. 58, 35–44. https://d oi.o rg/1 0.1 023/A:1 01582 06163 84 (2002).
34. Bamzai, A. S. Relationship between snow cover variability and Arctic oscillation index on a hierarchy of time scales. Int. J. Climatol.
23, 131–142. https://doi.org/10.1002/joc.854 (2003).
35. Reardon, B. A., Pederson, G. T., Caruso, C. J. & Fagre, D. B. Spatial reconstructions and comparisons of historic snow avalanche
frequency and extent using tree rings in Glacier National Park, Montana, U.S.A. Arctic Antarctic Alpine Res. 40, 148–160. https://
doi.org/10.1657/1523-0430(06-069)[REARDON]2.0.CO;2 (2008).
36. Pederson, G. T., Graumlich, L. J., Fagre, D. B., Kipfer, T. & Muhlfeld, C. C. A century of climate and ecosystem change in Western
Montana: What do temperature trends portend?. Clim. Change 98, 133–154. https://doi.org/10.1007/s10584-009-9642-y (2010).
37. Ballesteros-Canovas, J. A., Trappmann, D., Madrigal-Gonzalez, J., Eckert, N. & Stoffel, M. Climate warming enhances snow
avalanche risk in the Western Himalayas. Proc. Natl. Acad. Sci. USA 115, 3410–3415. https://doi.org/10.1073/pnas.1716913115
(2018).
38. Dixon, R. W., Butler, D. R., Dechano, L. M. & Henry, J. A. Avalanche hazard in glacier national park: An El Nino connection?.
Phys. Geogr. 20, 461–467 (1999).
Scientific Reports | (2021) 11:10032 | https://doi.org/10.1038/s41598-021-89547-z 11
Vol.:(0123456789)You can also read