Handicapping the Paths for the Pandemic Economy - Decisions Better Faster - Moody's Analytics
←
→
Page content transcription
If your browser does not render page correctly, please read the page content below
Better
                                            Faster
                                          Decisions

Handicapping the Paths for the Pandemic Economy

Mark Zandi, Chief Economist
Cris deRitis, Deputy Chief Economist         June 2020
Moody's Analytics operates independently of the credit ratings activities of Moody's Investors
Service. We do not comment on credit ratings or potential rating changes, and no opinion or
analysis you hear during this presentation can be assumed to reflect those of the ratings agency.
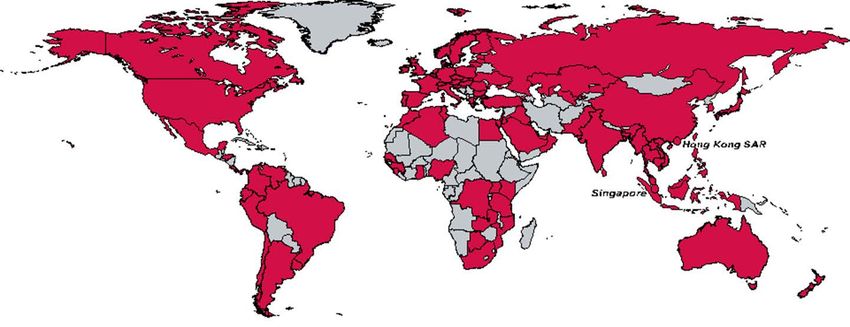
21 Cataclysmic Economic
Why Economics MatterShock…Pandemic Upends Global Economy
Business cycle status as of May 2020
Expansion
Recovery
At risk
In recession
Sources: Moody’s Analytics
June 2020 4U.S. Economy Struggles Most
Unemployment rate through Apr 2020, %
20
U.S. U.S. corrected
18
Canada unemployment rate
16
Germany
14 Australia
12 Japan
10
8
6
4
2
0
07 08 09 10 11 12 13 14 15 16 17 18 19 20
Sources: National statistical bureaus, NBER, Moody’s Analytics
June 2020 5More Infections, Worse Downturn
Confirmed infections per mil inhabitants. For countries with unemployment rate data available for Apr 2020
12 Change in unemployment rate, Apr 2020 to 2019Q4
U.S.
10
Japan y=0.0009x-0.116
8 Taiwan R²=0.29
Canada
South Korea
6
Hungary
4 Hong
Kong Peru
Denmark
2 Poland Russia Sweden Chile
Brazil Switzerland
Germany Netherlands Infections per million inhabitants
0
0 1,000 2,000 3,000 4,000 5,000 6,000
Sources: WHO, Government sources, Moody’s Analytics
June 2020 62 …But the Recession
Why Economics Is Over
MatterGlobal Businesses Re-Open
Google mobility for the workplace, 7-day moving average, 0 = pre-COVID
20
10
0
-10
-20
-30
U.S.
-40
U.K.
-50 Hong Kong
-60 Brazil
-70
-80
March April May
Sources: Google, Moody’s Analytics
June 2020 8U.S. Lockdown Winds Down
Share of GDP and # of counties shutdown
30 2,800
25 2,400
2,000
20
1,600
15
1,200
10
800
# of counties shutdown (R )
5 Share of GDP shutdown, % (L) 400
0 0
17-Mar 24-Mar 31-Mar 7-Apr 14-Apr 21-Apr 28-Apr 5-May 12-May 19-May 26-May
Sources: BEA, NY Times, Moody’s Analytics
June 2020 9Central Banks Erect a Firewall
Assets held outright on the Federal Reserve’s balance sheet, $ tril
7
Credit facilities Repos MBS and Agency Treasuries Other
6
5
4
3
2
1
0
06 08 10 12 14 16 18 20
Sources: Federal Reserve, Moody’s Analytics
June 2020 10Aggressive Global Fiscal Policy Response…
Fiscal support as of Apr 2020, % of 2019 GDP
Japan
U.S.
Australia
South Korea
India
Canada
Brazil
Germany
U.K.
France
China
Mexico
Russia
Italy
Spain
0 5 10 15 20 25
Source: Moody’s Analytics
June 2020 11…That Cushions the Blow (Temporarily)
U.S. Personal income, $ tril, SAAR, change from 2019Q4
4
Rental and interest income Dividend Income Proprietors' income
3 Wage income Pass-through limitation easing Expanded UI benefits
Economic Impact Payments Automatic stabilizers Disposable income
2
1
0
-1
-2
20Q1 20Q2 20Q3 20Q4 21Q1 21Q2 21Q3 21Q4
Sources: BEA, CBO, Moody’s Analytics
June 2020 123 Alternative Paths Matter
Why EconomicsAlternative Scenarios
Updated each month S0 Upside (4th Percentile)
The baseline forecast (50/50 probability) S1 Upside (10th Percentile)
is the “most likely outcome” based on
current conditions and our view of where S2 Downside (75th Percentile)
the economy is headed. S3 Downside (90th Percentile)
We run multiple simulations to develop a S4 Downside (96th Percentile)
probability distribution of outcomes,
S5 Slower-Trend (Narrative)
ranking by unemployment and identifying
percentiles. S6 Stagflation (Narrative)
S7 Next Cycle Recession (Narrative, U.S. Only)
S8 Low Oil Price (Narrative)
CF Consensus Forecast
CS Constant Severity
Scenario Assumptions and Narratives are fully documented.
June 2020 14V, W, U, L? A Swoosh Recovery
U.S. Real GDP, % change from start of recession
20
Baseline (50%ile) S0 (4%ile)
15 S1 (10%ile) S2 (75%ile)
S3 (90%ile) S4 (96%ile)
10
5
0
-5
-10
-15
20 21 22 23 24
Source: Moody’s Analytics
June 2020 15Commercial Real Estate Market Will Be Slammed
U.S. Commercial property price index, % yr ago
20
10
0
Baseline
-10
Scenario 0
Scenario 1
-20
Scenario 2
-30 Scenario 3
Scenario 4
-40
06 07 08 09 10 11 12 13 14 15 16 17 18 19 20 21 22
Sources: Reis, Moody’s Analytics
June 2020 164 Epidemiological
Why EconomicsAssumptions
MatterU.S. EPI Assumptions
Paths Current S0 S1 BASELINE S3 S4
EPIDEMIOLOGICAL
Total Infections 1.8 mil
1.9 mil 2.2 mil 2.4 mil 3.3 mil 4.1 mil
(Confirmed) (22K/day)
Peak Infections Peak in April Peak in April Peak in April Peak in April Peak in June Peak in June
Case Fatality 5.5% 5.4% 5.6% 6.3% 8.0% 9.3%
Hospitalization Rate 12% 10% 11% 12% 15% 20%
Abatement Date
Abate by June Abate by June Abate by July Abate by August Abate by August
(5 Demand-Side Cross-Currents
Why Economics MatterGlobal Businesses Are Shell-Shocked
% of Moody’s Analytics global bus. survey respondents that are…
90
Investing
80 Hiring
70 Raising prices
60
50
40
30
20
10
0
03 05 07 09 10 12 14 16 18
Source: Moody’s Analytics
June 2020 20Double-Dip Recession Without More Fiscal Support
U.S. real GDP, 2012$ bil
21,000
With anticipated fiscal rescue
20,000 Without anticipated fiscal rescue
19,000
18,000
17,000
19 20 21 22 23
Sources: BEA, Moody’s Analytics
June 2020 216 How Much Structural Damage
U.S. Businesses Are Paying Increasingly Late…
Top 10 weakest and strongest 3-digit NAICS, April 2020
                                                                         Employment             B2B Spending
NAIC    Industry                                                           2019, ths            % Late Change yr ago

721     Accommodation                                                        2,077.4              69.0          44.5
512     Motion picture and sound recording                                     442.8              54.0          32.8
711     Performing arts, spectator sports and related                          516.7              49.2          24.1
722     Food services and drinking places                                   12,068.7              47.6          22.7
712     Museums, historical sites; and similar                                 173.0              46.4          24.1
448     Clothing and clothing accessories stores                             1,299.2              45.3          19.1
315     Apparel manufacturing                                                  110.4              44.7          18.0
323     Printing and related support activities                                424.7              38.8           9.5
482     Rail transportation                                                    174.5              38.2           2.3
481     Air Transportation                                                     503.3              37.6           9.6

        Total                                                              150,935.4              29.4           7.5

454     Nonstore retailers                                                      562.7             26.0           8.2
522     Credit intermediation and related activities                         2,651.2              25.9           6.2
425     Wholesale electronic markets and agents and brokers                    530.9              25.8           3.7
452     General merchandise stores                                           3,037.8              24.1           5.2
321     Wood product manufacturing                                             409.0              23.4           2.0
811     Repair and maintenance                                               1,352.2              22.1           3.6
444     Building material and garden equip. and supplies dealers             1,296.4              20.7           2.3
524     Insurance carriers and related activities                            2,790.1              20.6           4.0
623     Nursing and residential care facilities                              3,378.6              20.1           1.9
441     Motor vehicle and parts dealers                                      2,034.9              18.9           4.5

Note: Excludes NAICs with fewer than 25,000 employees in 2019 and in public administration and agriculture
Sources: Cortera, Moody's Analytics

                                                                                                                       June 2020   23
…and Business Bankruptcies Surge
U.S. monthly Chapter 11 filings as of May 27
35
Businesses with over $50 mil
30
in liabilities
25
20
15
10
5
0
07 08 09 10 11 12 13 14 15 16 17 18 19 20
Sources: Bloomberg, Moody’s Analytics
June 2020 24Running Out of Fiscal Space
Sovereign borrowing capacity given current yields
450
Norway Circle size=Real GDP, $
400
Sweden Y-axis: Fiscal space
350 X-axis: Debt-to-GDP ratio
China
300
U.S.
250
Spain
200 Russia
150 Italy
100 France Greece
Mexico India Brazil
50 Germany Japan
0 Egypt Argentina
Turkey S. Africa
-50
0 50 100 150 200 250
Source: Moody’s Analytics
June 2020 25Globalization Will Be Diminished
Global trade and industrial production, % change yr ago
30
Merchandise world trade, 2010 US$ Industrial production
20
Nov 2018 – Trade War
10
0
Jan 2020 – Covid-19
-10
Data through Mar 2020
-20
01 02 03 04 05 06 07 08 09 10 11 12 13 14 15 16 17 18 19 20
Sources: CPB World Trade Monitor, Moody’s Analytics
June 2020 26Q&A
Further Questions? Contact us at help@economy.com
MORE INFORMATION
moodysanalytics.com/covid19scenarios
Forecasts for 100+ countries are available for download through our
Data Buffet service, via our Excel Add-in or API.
moodysanalytics.com/scenariostudio
Users can also create their own scenarios based off our Global
Macroeconomic Forecast Model using our Scenario Studio platform.
June 2020 27Better
Faster
Decisions
Contact Us: Economics & Business Analytics Offices
West Chester, EBA-HQ London Prague Singapore
+1.610.235.5299 +44.20.7772.5454 +420.22.422.2929 +65.6511.4400
121 North Walnut Street, Suite 500 One Canada Square Washingtonova 17 6 Shenton Way
West Chester PA 19380 Canary Wharf 110 00 Prague 1 #14-08 OUE Downtown 2
USA London E14 5FA Czech Republic Singapore 068809
United Kingdom
New York, Corporate-HQ Sydney Shanghai
+1.212.553.1653 Toronto +61.2.9270.8111 +86.21.6101.0172
7 World Trade Center, 14th Floor 416.681.2133 Level 10 Unit 2306, Citigroup Tower
250 Greenwich Street 200 Wellington Street West, 15th Floor 1 O'Connell Street 33 Huayuanshiqiao Road
New York, NY 10007 Toronto ON M5V 3C7 Sydney, NSW, 2000 Pudong New Area, 200120
USA Canada Australia China
help@economy.com moodysanalytics.com© 2020 Moody’s Corporation, Moody’s Investors Service, Inc., Moody’s Analytics, Inc. and/or their licensors and affiliates (collectively, “MOODY’S”). All securities (including corporate and municipal bonds, debentures, notes and commercial paper) and preferred stock rated by Moody’s Investors Service, Inc.
rights reserved. have, prior to assignment of any rating, agreed to pay to Moody’s Investors Service, Inc. for ratings opinions and services rendered by it fees ranging from
$1,000 to approximately $2,700,000. MCO and MIS also maintain policies and procedures to address the independence of MIS’s ratings and rating
CREDIT RATINGS ISSUED BY MOODY'S INVESTORS SERVICE, INC. AND ITS RATINGS AFFILIATES (“MIS”) ARE MOODY’S CURRENT OPINIONS processes. Information regarding certain affiliations that may exist between directors of MCO and rated entities, and between entities who hold ratings from
OF THE RELATIVE FUTURE CREDIT RISK OF ENTITIES, CREDIT COMMITMENTS, OR DEBT OR DEBT-LIKE SECURITIES, AND MOODY’S MIS and have also publicly reported to the SEC an ownership interest in MCO of more than 5%, is posted annually at www.moodys.com under the heading
PUBLICATIONS MAY INCLUDE MOODY’S CURRENT OPINIONS OF THE RELATIVE FUTURE CREDIT RISK OF ENTITIES, CREDIT COMMITMENTS, “Investor Relations — Corporate Governance — Director and Shareholder Affiliation Policy.”
OR DEBT OR DEBT-LIKE SECURITIES. MOODY’S DEFINES CREDIT RISK AS THE RISK THAT AN ENTITY MAY NOT MEET ITS CONTRACTUAL
FINANCIAL OBLIGATIONS AS THEY COME DUE AND ANY ESTIMATED FINANCIAL LOSS IN THE EVENT OF DEFAULT OR IMPAIRMENT. SEE Additional terms for Australia only: Any publication into Australia of this document is pursuant to the Australian Financial Services License of MOODY’S
MOODY’S RATING SYMBOLS AND DEFINITIONS PUBLICATION FOR INFORMATION ON THE TYPES OF CONTRACTUAL FINANCIAL affiliate, Moody’s Investors Service Pty Limited ABN 61 003 399 657AFSL 336969 and/or Moody’s Analytics Australia Pty Ltd ABN 94 105 136 972 AFSL
OBLIGATIONS ADDRESSED BY MOODY’S RATINGS. CREDIT RATINGS DO NOT ADDRESS ANY OTHER RISK, INCLUDING BUT NOT LIMITED TO: 383569 (as applicable). This document is intended to be provided only to “wholesale clients” within the meaning of section 761G of the Corporations Act
LIQUIDITY RISK, MARKET VALUE RISK, OR PRICE VOLATILITY. CREDIT RATINGS AND MOODY’S OPINIONS INCLUDED IN MOODY’S 2001. By continuing to access this document from within Australia, you represent to MOODY’S that you are, or are accessing the document as a
PUBLICATIONS ARE NOT STATEMENTS OF CURRENT OR HISTORICAL FACT. MOODY’S PUBLICATIONS MAY ALSO INCLUDE QUANTITATIVE representative of, a “wholesale client” and that neither you nor the entity you represent will directly or indirectly disseminate this document or its contents to
MODEL-BASED ESTIMATES OF CREDIT RISK AND RELATED OPINIONS OR COMMENTARY PUBLISHED BY MOODY’S ANALYTICS, INC. CREDIT “retail clients” within the meaning of section 761G of the Corporations Act 2001. MOODY’S credit rating is an opinion as to the creditworthiness of a debt
RATINGS AND MOODY’S PUBLICATIONS DO NOT CONSTITUTE OR PROVIDE INVESTMENT OR FINANCIAL ADVICE, AND CREDIT RATINGS AND obligation of the issuer, not on the equity securities of the issuer or any form of security that is available to retail investors.
MOODY’S PUBLICATIONS ARE NOT AND DO NOT PROVIDE RECOMMENDATIONS TO PURCHASE, SELL, OR HOLD PARTICULAR SECURITIES.
NEITHER CREDIT RATINGS NOR MOODY’S PUBLICATIONS COMMENT ON THE SUITABILITY OF AN INVESTMENT FOR ANY PARTICULAR Additional terms for Japan only: Moody's Japan K.K. (“MJKK”) is a wholly-owned credit rating agency subsidiary of Moody's Group Japan G.K., which is
INVESTOR. MOODY’S ISSUES ITS CREDIT RATINGS AND PUBLISHES MOODY’S PUBLICATIONS WITH THE EXPECTATION AND wholly-owned by Moody’s Overseas Holdings Inc., a wholly-owned subsidiary of MCO. Moody’s SF Japan K.K. (“MSFJ”) is a wholly-owned credit rating
UNDERSTANDING THAT EACH INVESTOR WILL, WITH DUE CARE, MAKE ITS OWN STUDY AND EVALUATION OF EACH SECURITY THAT IS agency subsidiary of MJKK. MSFJ is not a Nationally Recognized Statistical Rating Organization (“NRSRO”). Therefore, credit ratings assigned by MSFJ
UNDER CONSIDERATION FOR PURCHASE, HOLDING, OR SALE. are Non-NRSRO Credit Ratings. Non-NRSRO Credit Ratings are assigned by an entity that is not a NRSRO and, consequently, the rated obligation will not
qualify for certain types of treatment under U.S. laws. MJKK and MSFJ are credit rating agencies registered with the Japan Financial Services Agency and
MOODY’S CREDIT RATINGS AND MOODY’S PUBLICATIONS ARE NOT INTENDED FOR USE BY RETAIL INVESTORS AND IT WOULD BE RECKLESS their registration numbers are FSA Commissioner (Ratings) No. 2 and 3 respectively.
AND INAPPROPRIATE FOR RETAIL INVESTORS TO USE MOODY’S CREDIT RATINGS OR MOODY’S PUBLICATIONS WHEN MAKING AN
INVESTMENT DECISION. IF IN DOUBT YOU SHOULD CONTACT YOUR FINANCIAL OR OTHER PROFESSIONAL ADVISER. MJKK or MSFJ (as applicable) hereby disclose that most issuers of debt securities (including corporate and municipal bonds, debentures, notes and
commercial paper) and preferred stock rated by MJKK or MSFJ (as applicable) have, prior to assignment of any rating, agreed to pay to MJKK or MSFJ (as
ALL INFORMATION CONTAINED HEREIN IS PROTECTED BY LAW, INCLUDING BUT NOT LIMITED TO, COPYRIGHT LAW, AND NONE OF SUCH applicable) for ratings opinions and services rendered by it fees ranging from JPY125,000 to approximately JPY250,000,000.
INFORMATION MAY BE COPIED OR OTHERWISE REPRODUCED, REPACKAGED, FURTHER TRANSMITTED, TRANSFERRED, DISSEMINATED,
REDISTRIBUTED OR RESOLD, OR STORED FOR SUBSEQUENT USE FOR ANY SUCH PURPOSE, IN WHOLE OR IN PART, IN ANY FORM OR MJKK and MSFJ also maintain policies and procedures to address Japanese regulatory requirements.
MANNER OR BY ANY MEANS WHATSOEVER, BY ANY PERSON WITHOUT MOODY’S PRIOR WRITTEN CONSENT.
CREDIT RATINGS AND MOODY’S PUBLICATIONS ARE NOT INTENDED FOR USE BY ANY PERSON AS A BENCHMARK AS THAT TERM IS DEFINED
FOR REGULATORY PURPOSES AND MUST NOT BE USED IN ANY WAY THAT COULD RESULT IN THEM BEING CONSIDERED A BENCHMARK.
All information contained herein is obtained by MOODY’S from sources believed by it to be accurate and reliable. Because of the possibility of human or
mechanical error as well as other factors, however, all information contained herein is provided “AS IS” without warranty of any kind. MOODY'S adopts all
necessary measures so that the information it uses in assigning a credit rating is of sufficient quality and from sources MOODY'S considers to be reliable
including, when appropriate, independent third-party sources. However, MOODY’S is not an auditor and cannot in every instance independently verify or
validate information received in the rating process or in preparing the Moody’s publications.
To the extent permitted by law, MOODY’S and its directors, officers, employees, agents, representatives, licensors and suppliers disclaim liability to any
person or entity for any indirect, special, consequential, or incidental losses or damages whatsoever arising from or in connection with the information
contained herein or the use of or inability to use any such information, even if MOODY’S or any of its directors, officers, employees, agents, representatives,
licensors or suppliers is advised in advance of the possibility of such losses or damages, including but not limited to: (a) any loss of present or prospective
profits or (b) any loss or
damage arising where the relevant financial instrument is not the subject of a particular credit rating assigned
by MOODY’S.
To the extent permitted by law, MOODY’S and its directors, officers, employees, agents, representatives, licensors and suppliers disclaim liability for any
direct or compensatory losses or damages caused to any person or entity, including but not limited to by any negligence (but excluding fraud, willful
misconduct or any other type of liability that, for the avoidance of doubt, by law cannot be excluded) on the part of, or any contingency within or beyond the
control of, MOODY’S or any of its directors, officers, employees, agents, representatives, licensors or suppliers, arising from or in connection with the
information contained herein or the use of or inability to use any such information.
NO WARRANTY, EXPRESS OR IMPLIED, AS TO THE ACCURACY, TIMELINESS, COMPLETENESS, MERCHANTABILITY OR FITNESS FOR ANY
PARTICULAR PURPOSE OF ANY CREDIT RATING OR
OTHER OPINION OR INFORMATION IS GIVEN OR MADE BY MOODY’S IN ANY FORM OR
MANNER WHATSOEVER.
Moody’s Investors Service, Inc., a wholly-owned credit rating agency subsidiary of Moody’s Corporation (“MCO”), hereby discloses that most issuers of debt
June 2020 29You can also read