HAPPY BUDDHA PURNIMA LET YOUR SPIRIT FILL WITH NON-VIOLENCE & TRUTH MAY, 2017 - SMC Global
←
→
Page content transcription
If your browser does not render page correctly, please read the page content below

A W eekly Up d at e f ro m SM C
2 0 1 7 : Issu e 5 7 8 , W eek: 0 8 t h - 1 1 t h M ay                (Fo r p rivat e circu lat io n o n ly)

 W ISE M                                                      N EY
                                                         LET YOUR SPIRIT FILL WITH
                                                         NON- VIOLENCE & TRUTH
                                                         HAPPY
                                                         BUDDHA PURNIMA
                                                              TH
                                                         10        MAY, 2017

                                                                                                         Brand smc 402
From T he Desk Of Edit or
    Contents

                                                                                                      G
                                                                                                                     lobal stock markets largely remained in green in the week gone by as investors
    Equity                                                                          4-7
                                                                                                                     remained optimistic about the health of the global economy. In the monetary
    Derivatives                                                                     8-9
    Commodity                                                                   10-13                                policy review meeting, U.S. Federal Reserve kept policy rates unchanged and
    Currency                                                                         14               said that the near-term risk to the economic outlook appear roughly balanced. As of now it
    IPO                                                                              15               looks Fed's is continuing with its gradual rate hike policy and two more rate hikes in the
    FD Monitor                                                                       16
                                                                                                      calendar year are on the cards and shrinking of the balance sheet would start by the end of
    Mutual Fund                                                                 17-18
                                                                                                      December 2017. Manufacturing activity in the Euro area expanded at the fastest pace in six

                                                                                                      years supported by pick up in new orders and fastest pace of job creation. Chinese stocks
    SMC GLOBAL SECURITIES LTD.
    REGISTERED OFFICES:
                                                                                                      were seen in pressure as the authorities continue to tighten financial market regulation to
    11 / 6B, Shanti Chamber, Pusa Road, New Delhi 110005.
                                                                                                      crackdown on excessive borrowings for speculation in equities.
    Tel: 91-11-30111000, Fax: 91-11-25754365
    MUMBAI OFFICE:
    Lotus Corporate Park, A Wing 401 / 402 , 4th Floor ,                                              Back at home, in order to deal with the problem of nonperforming assets in the banking
    Graham Firth Steel Compound, Off Western Express Highway,
    Jay Coach Signal, Goreagon (East) Mumbai - 400063                                                 system, Union Cabinet got the President assent to the ordinance to amend the Banking
    Tel: 91-22-67341600, Fax: 91-22-67341697
    KOLKATA OFFICE:
                                                                                                      Regulation Act, 1949 for new framework. In addition, Union Cabinet also approved the
    18,Rabindra Sarani, Poddar Court, Gate No-4,5th Floor, Kolkata-700001
                                                                                                      National Steel Policy 2017 that aims to triple the production capacity over the next 13
    Tel : 91-33-39847000 Fax No : 91-33-39847004
    AHMEDABAD OFFICE :                                                                                years. Industrial activity expanded for the fourth consecutive month on the back of growth
    10/A, 4th Floor, Kalapurnam Building, Near Municipal Market,
    C G Road, Ahmedabad-380009, Gujarat                                                               in new orders and improving demand in the month of April as indicated by the Nikkei India
    Tel : 91-79-26424801 - 05, 40049801 - 03
                                                                                                      Manufacturing Purchasing Managers' Index. Meanwhile the Industrial production data to be
    CHENNAI OFFICE:
    Salzburg Square, Flat No.1, III rd Floor, Door No.107, Harrington Road,
                                                                                                      released on 9th May for the month of March will be unveiled on a new series with base year
    Chetpet, Chennai - 600031.
    Tel: 044-39109100, Fax -044- 39109111                                                             2011 – 2012.
    SECUNDERABAD OFFICE:
    206, 3rd Floor, above CMR Exclusive, Bhuvana Towers, S.D.Road,
                                                                                                      On the commodities market front, commodities counter remained in bear grip for the
    Secunderabad - 500003
    Tel: 91-40-30780298/99, 39109536
                                                                                                      continuous third week. CRB closed near 178, which made a high of 197.66 in 2017 so far. The
    DUBAI OFFICE:
    2404, 1 Lake Plaza Tower, Cluster T, Jumeriah Lake Towers,                                        forecast of a normal monsoon, weak demand and rising supply of agri commodities,
    PO Box 117210, Dubai, UAE
    Tel: 97145139780 Fax : 97145139781                                                                following a good crop, led to a fall in prices of the produce. Wheat arrivals have risen
    Email ID : pankaj@smccomex.com
                                                                                                      sharply. Crude oil prices may consolidate in a range on global supply glut and increased US
                smcdmcc@gmail.com
    NEW YORK OFFICE:                                                                                  production. Overall crude oil can trade in range of 2700-3000 in MCX. Base metal counter
    Alliance Bernstein Building
    1345 Avenue of the Americas                                                                       may witness lower level buying after the steep fall, which was seen in the past few weeks.
    Second Floor, New York, NY 10105
    Phone: (212) 878-3684                                                                             New Yuan Loans, CPI of China, ECB's Draghi Speaks in Dutch Parliament, Reserve Bank of
    Toll-Free: (855) 589-1915
    Fax: (866) 852-4236                                                                               New Zealand Rate Decision, BoE Rate Decision, BOE Asset Purchase Target, German GDP,

                                                                                                      CPI, Advance Retail Sales and U. of Michigan Confidence of US etc are few data and events,
    Printed and Published on behalf of
    Mr. Saurabh Jain @ Publication Address                                                            which may keep the investors on toes throughout the week.
    11/6B, Shanti Chamber, Pusa Road, New Delhi-110005
    Website: www.smcindiaonline.com
    Investor Grievance : smc@smcindiaonline.com

    Printed at: S&S MARKETING
    102, Mahavirji Complex LSC-3, Rishabh Vihar, New Delhi - 110092 (India)
                                                                                                                                                                                                         (Saurabh Jain)
    Ph.: +91-11- 43035012, 43035014, Email: ss@sandsmarketing.in

SMC Global Securities Ltd. (hereinafter referred to as “SMC”) is a registered Member of National Stock Exchange of India Limited, Bombay Stock Exchange Limited and its associate is member of MCX stock Exchange Limited. It is also
registered as a Depository Participant with CDSL and NSDL. Its associates merchant banker and Portfolio Manager are registered with SEBI and NBFC registered with RBI. It also has registration with AMFI as a Mutual Fund Distributor.
SMC has applied with SEBI for registering as a Research Entity in terms of SEBI (Research Analyst) Regulations, 2014. SMC or its associates has not been debarred/ suspended by SEBI or any other regulatory authority for accessing /dealing
in securities Market.
SMC or its associates including its relatives/analyst do not hold any financial interest/beneficial ownership of more than 1% in the company covered by Analyst. SMC or its associates and relatives does not have any material conflict of
interest. SMC or its associates/analyst has not received any compensation from the company covered by Analyst during the past twelve months. The subject company has not been a client of SMC during the past twelve months. SMC or
its associates has not received any compensation or other benefits from the company covered by analyst or third party in connection with the research report. The Analyst has not served as an officer, director or employee of company
covered by Analyst and SMC has not been engaged in market making activity of the company covered by Analyst.
The views expressed are based solely on information available publicly available/internal data/ other reliable sources believed to be true.
SMC does not represent/ provide any warranty express or implied to the accuracy, contents or views expressed herein and investors are advised to independently evaluate the market conditions/risks involved before making any
investment decision.
NEWS TREND SHEET
DOMESTIC NEWS
Economy Stocks *Closing Trend Date Rate SUPPORT RESISTANCE Closing
• The Real Estate (Regulation and Development) Act, 2016 (RERA) becomes Price Trend Trend S/ l
effective from May 1, 2017. Each state and UT will have its own Regulatory
Changed Changed
Authority (RA) which will frame regulations and rules according to the Act. It
has been established for regulation and promotion of the real estate sector S&P BSE SENSEX 29859 UP 18.11.16 25627 28600 28000
and to ensure sale of properties, in an efficient and transparent manner.
NIFTY50 9285 UP 27.01.17 8641 8900 8700
• A new National Steel Policy (NSP) 2017 that aims to achieve steel making
capacity of 300 million tonnes (mt) by 2030 with an additional investment of NIFTY IT 10086 DOWN 21.04.17 10008 10500 10600
` 10 lakh crore got the Union Cabinet's green light. NIFTY BANK 22605 UP 27.01.17 19708 21400 21000
Oil & Gas
ACC 1660 UP 27.01.17 1431 1520 1480
• Reliance Industries will sell the natural gas it produces from coal seams in
Madhya Pradesh to its own units in Gujarat and Maharashtra at USD 4.23 per BHARTIAIRTEL 345 UP 03.02.17 354 345 335
million British thermal units.
BHEL 173 UP 27.01.17 140 165 160
Engineering
• L&T Technology Services (LTTS), the engineering services arm of Larsen & CIPLA 550 DOWN 28.04.17 557 575 590
Toubro, signed an agreement to acquire US-based design services provider SBIN 296 UP 02.12.16 254 275 270
Esencia Technologies Inc. The company will pay $27 million (nearly ` 180
crore) to acquire the California-headquartered firm and $15 million (` 100 HINDALCO 186 UP 27.01.17 191 180 175
crore) will be paid upfront. ICICI BANK 299 UP 21.10.16 277 280 270
Pharmaceuticals
INFOSYS 932 DOWN 13.04.17 931 980 1010
• Lupin Goa manufacturing facility underwent an inspection by the US Food
and Drug Administration (USFDA). As per the USFDA, observations are made in ITC 277 UP 13.01.17 250 265 255
Form 483 when investigators feel that conditions or practices in the facility are L&T 1724 UP 13.01.17 1439 1660 1620
such that products may become adulterated or render injuries to health.
Telecom MARUTI 6654 UP 06.01.17 5616 6200 6100
• Reliance Communications is the latest entrant to the telecom war with a new NTPC 160 DOWN 03.03.17 156 168 170
data offering wherein the users in selected states are eligible to get 70 GB of
4G high-speed data valid for 70 days at just ` 148. ONGC 184 DOWN 31.03.17 185 195 200
Retail RELIANCE* 1328 UP 30.12.16 1082 - 1320
• Shoppers Stop has opened 'Bobbi Brown' store at Express Avenue Mall, TATASTEEL 434 DOWN 28.04.17 449 460 475
Chennai. With the opening of this store, the Company has now 8 'Bobbi
*Reliance has boken the support of 1350 Closing as on 05-05-2017
Brown' stores under its operations.
FMCG
• Varun Beverages has set up a new unit for manufacturing of Pepsi range of NOTES:
1) These levels should not be confused with the daily trend sheet, which is sent every morning by e-mail in the name
products at District Hardoi, Uttar Pradesh. of "Morning Mantra ".
2) Sometimes you will find the stop loss to be too far but if we change the stop loss once, we will find more strength
Miscellaneous coming into the stock. At the moment, the stop loss will be far as we are seeing the graphs on weekly basis and
taking a long-term view and not a short-term view.
• Punj Llyod and its JV Partner, Israel Weapon Industries inaugurated the
country's first private sector small arms manufacturing plant in Malanpur in FORTHCOMING EVENTS
Madhya Pradesh. The joint venture company, Punj Llyod Raksha Systems will Ex-Date Company Purpose
be manufacturing small arms for the Indian Defence Forces and also for 9-May-17 GM Breweries Dividend - Rs 3/- Per Share
export. 16-May-17 Godrej Consumer Products Interim Dividend
19-May-17 Nestle India Dividend - Rs 23/- Per Share
INTERNATIONAL NEWS 25-May-17 Merck Dividend-Rs 11/- Per Share (Revised)
• The US Federal Reserve has left interest rates unchanged while signalling 25-May-17 Castrol India Dividend-Rs 4.50 Per Share
that it expects a resilient US economy and solid job market to justify further 31-May-17 Huhtamaki PPL Dividend Rs 3/- Per Share
rate hikes later this year. Meeting Date Company Purpose
• US factory orders crept up by 0.2 percent in March after surging up by a
8-May-17 Canara Bank Results/Dividend
revised 1.2 percent in February. Economists had expected factory orders to
8-May-17 Bharti Infratel Results/Dividend
rise by 0.4 percent compared to the 1.0 percent jump that had been
8-May-17 ABB India Results
reported for the previous month.
9-May-17 Syndicate Bank Results/Dividend
• US productivity fell by 0.6 percent in the first quarter after surging up by a 9-May-17 Shemaroo Entertainment Results/Dividend
revised 1.8 percent in the fourth quarter. Economists had expected 9-May-17 SREI Infrastructure Finance Results/Dividend
productivity to come in unchanged compared to the 1.3 percent jump that 9-May-17 Petronet LNG Results/Dividend
had been reported for the previous quarter. 9-May-17 InterGlobe Aviation Results/Dividend
• US trade deficit narrowed to $43.7 billion in March from a revised $43.8 9-May-17 Godrej Consumer
billion in February. The trade deficit had been expected to widen to $44.5 Products Results/Dividend
billion from the $43.6 billion originally reported for the previous month. The 9-May-17 Bharti Airtel Results/Dividend
report said the value of imports dropped by 0.7 percent to $234.7 billion in 10-May-17 Zee Entertainment
March from $236.4 billion in February. Enterprises Results/Dividend
• US initial jobless claims dropped to 238,000, a decrease of 19,000 from the 10-May-17 Siemens Results
previous week's unrevised level of 257,000. Economists had expected jobless 10-May-17 Idea Cellular Results/Others
claims to dip to 247,000. 10-May-17 Hero MotoCorp Results/Dividend
• UK mortgage approvals declined in March and secured lending increased at a 11-May-17 HCL Technologies Results/Dividend
slower pace, the Bank of England. Mortgage approvals decreased to 66,837 11-May-17 Asian Paints Results/Dividend
in March from 67,936 in February. Economists had forecast approvals to fall 11-May-17 Arvind Results/Dividend
to 67,200. 12-May-17 Dr. Reddy's Laboratories Results/Dividend
• Eurozone retail trade grew at a slower pace in March on weak clothing sales. 12-May-17 Titan Company Results/Dividend
Retail sales climbed 0.3 percent month-on-month in March, slower than the 12-May-17 Jindal Stainless Results
0.5 percent increase seen in February. However, sales were expected to 12-May-17 Dr. Lal Path Labs Ltd. Results/Dividend
remain flat in March. 12-May-17 Havells India Results/Dividend
12-May-17 Aarti Industries Results
4
INDIAN INDICES (% Change) SECTORAL INDICES (% Change)
0.80 0.74 3.00
0.73 2.73
0.69
0.70 0.63 2.50
0.60 2.12
0.60 0.56 2.00
2.00
1.73
0.50
1.50
0.40
1.00 0.79
0.30
0.50
0.20
0.10 0.00
-0.06 -0.04
-0.16
0.00 -0.50 -0.27
Nifty Sensex BSE Midcap BSE Nifty Next S&P CNX
Smallcap 50 500 -1.00
SMC Trend -1.50
Nifty Sensex BSE Midcap BSE Smallcap Nifty Junior S&P CNX 500 -1.68 -1.65
-2.00
Auto Index Bankex Cap Goods Cons Durable FMCG Index Healthcare IT Index Metal Index Oil & Gas Power Index Realty Index
Index Index Index Index
GLOBAL INDICES (% Change)
SMC Trend
2.50 Auto Cap Goods FMCG IT Oil & Gas
Bank Cons Durable Healthcare Metal Power
2.00 Realty
2.00
1.67
1.50 1.30
INSTITUTIONAL ACTIVITY (Equity) ( ` Crore)
1.00
0.00
0.61
0.00
0.46
0.50
0.22 0.28 -93.47
-200.00
0.05
0.00
-400.00 -333.24
-0.50
-600.00
-1.00 -0.87
-800.00
-1.50
Nasdaq Comp. Dow Jones S&P 500 Nikkei Strait Times Hang Seng Shanghai FTSE 100 CAC 40 -1000.00
Comp.
-1200.00 -1113.53
SMC Trend
Friday Monday Tuesday Wednesday Thursday
Nasdaq Nikkei Hang Seng FTSE 100
Dow jones Strait times Shanghai CAC 40
S&P 500
FII / FPI Activity MF Activity
Up Down Sideways
BSE SENSEX TOP GAINERS & LOSERS (% Change) NSE NIFTY TOP GAINERS & LOSERS (% Change)
8.00 6.98 8.00
6.93
5.89
6.00 6.00
4.37 4.19
3.88
4.00 3.23 4.00 3.59
2.52 2.42
2.00 2.00
0.00 0.00
-2.00 -2.00
-1.68
-2.58 -2.45 -2.67
-4.00 -4.00 -3.46
-4.65 -4.66
-6.00 -4.88
-5.55 -6.00
-5.72
-8.00
-8.00
ICICI Bank Adani Ports St Bk of India Hero TCS Lupin Tata Motors Reliance Bharti Airtel Sun ICICI Bank Indiabulls Bank of Grasim Inds Adani Ports Lupin Tata Motors Tata Hindalco Inds. Bharti Airtel
Motocorp Inds. Pharma.Inds. Hous. Baroda Motors-DVR
5
Beat the street - Fundamental Analysis
ICICI BANK LIMITED CMP: 297. 95 Target Price: 374. 00 Upside: 25%
VALUE PARAMETERS Investment Rationale segment is expected to continue to grow by
Face Value (` ) 2.00 Overall, the Bank's retail business is granular and around 15-20% and the portfolio of overseas
52 Week High/Low 299.90/213.20 is growing at a healthy pace. The Bank is growing branches is expected to remain broadly stable in
its wholesale business in a selective manner US dollar terms.
M.Cap (` Cr.) 173573.36
within its strategic priorities. While the Bank has Valuation
EPS (` ) 17.49 diverse revenue streams across its businesses, the Business performance of the bank such as domestic
P/E Ratio (times) 17.04 provisions on corporate loans, dividend from loan growth, overall corporate advances , retail loan
P/B Ratio (times) 1.90 subsidiaries and capital gains, is expected to growth, CASA ratio are continuously improving. On
Dividend Yield (%) 0.84 benefit the bank in coming years. the development front, it is increasing its presence
The bank is targeting double digit growth in fee across the country and in line with that during FY17,
Stock Exchange BSE
income in FY2018, led by retail fees. The overall its total branch network and ATMS reached 4850 and
% OF SHARE HOLDING fee income growth would depend on market 13882 respectively. Moreover, the Bank would focus
conditions, particularly activity in the corporate on fully leveraging existing resources and
% of Holding sector, as well as regulatory measures with infrastructure. Further, it would also look at
respect to various components of fee income. implementing additional cost optimization measures
0
0 0 The bank expects the NPA additions for FY2018 to during the year, while growing its retail franchise.
0.19
8.53
Description as on
be significantly lower than FY2017. It also expects Thus, it is expected that the stock will see a price
Foreign some of the resolutions to get completed and some target of ` 374 in 8 to 10 months time frame on a
30.95 Institutions upgrades from NPAs. However, the provisions are target P/BVx of 2.25x and FY18 BVPS of ` 166.08.
60.34 Govt Holding expected to remain elevated in FY2018, mainly on
Non Promoter Corp. Hold. account of aging of existing of NPAs.
Promoters The bank has continued to focus on resolution & P/ B Chart
Public & Others exposure reduction in identified areas. There has
` in cr been a net reduction in exposure and rating
Actual Estimate upgrade of ` 5629 crore out of stressed loan
FY Mar-16 FY Mar-17 FY Mar-18 portfolio during FY2017.
Net Total Income 25297.20 26104.20 36151.70 The management of the bank would endeavor to
EBITDA 15533.20 - 13999.40 limit the impact on margins and maintain net
EBIT 26609.80 30391.80 19122.00 interest margins above 3% during FY2018.
Pre-Tax Profit 17904.40 - 15082.40 Looking ahead at FY2018, it expects the domestic
Net Income 13780.00 10188.40 10563.80 loan growth at around 15 to 16%, driven by around
EPS 23.57 17.43 18.18 18 to 20% growth in the retail segment. In the
BVPS 162.34 179.64 166.08 corporate segment, it is expecting net growth of
ROE 15.40 - 10.40 around 5-7% in domestic corporate loans. The SME
ASHOK LEYLAND LIMITED CMP: 83. 50 Target Price: 102. 00 Upside: 22%
VALUE PARAMETERS Investment Rationale income, rural development initiatives and
Face Value (` ) 1.00 ∑ Ashok Leyland is one of the leading manufacturers infrastructure development, which will enhance
52 Week High/Low 111.65/73.60 of medium and heavy commercial vehicles in transportation and logistics.
M.Cap (` Cr.) 23763.07
India. ∑ Company sees a lot of opportunities in six key
∑ After achieving its target to become one of the markets, including Middle East, Africa, ASEAN and
EPS (` ) 3.47 top five players in the bus market, the company is SAARC countries. The company is also planning to
P/E Ratio (times) 24.05 aiming to become one of the top 10 M&HCV set up new assembling facilities in African
P/B Ratio (times) 5.99 companies in the next 2-3 years. To support this, countries to cater the domestic market.
Dividend Yield (%) 1.14 the company will invest around ` 500-600 crore Valuation
Stock Exchange BSE every year into development of products and The Company continued to outperform the CV
capacity. industry and has made significant gains in market
% OF SHARE HOLDING ∑ In India, the company is setting up new facilities share and sales volume by focusing on innovation,
at Andhra Pradesh and Telegana at a cost of intensive marketing strategies and network
around ` 80-100 crore each to manufacture buses. expansion. Alongside implementing a considered
Foreign Capacity of the facility would be around 2,200 business growth strategy, the company is rapidly
12.22 buses each a year. establishing robust business processes across the
24.81 Institutions
∑ Recently, the company has launched its Bharat company taking strides into the Digital Age. Thus, it is
9.78 Non Promoter Corporate
Stage (BS) IV trucks using inhouse technology and expected that the stock will see a price target of ` 102
50.38 Holding can convert BS-III vehicles to BS-IV at a much in 8 to 10 months time frame on a target P/BV of 4x
Promoters lower cost than competitors. and FY18 (E) BVPS of ` 25.51.
2.81 ∑ The company is developing new vehicles for the
Public & Others
armed forces, aggressively bidding for new P/ B Chart
contracts and setting up new infrastructure to
` in cr ready itself for a larger a pie of the defence
Actual Estimate business. The defence business is expected to
FY Mar-16 FY Mar-17 FY Mar-18 achieve at least 3 times (revenue growth) in five
Revenue 20,490.40 19,885.00 22,513.10 years. Recently, the company has bagged tenders for
EBITDA 2,932.50 2,312.40 2,643.20 mine protected vehicles and bullet proof vehicles
EBIT 2,408.00 1,852.80 2,149.60 from the security agencies and targets threefold
Pre-Tax Profit 1,626.50 1,818.60 2,193.30 business increase from its defence vertical.
Net Income 1,070.70 1,221.20 1,475.40 ∑ The Union Budget for the financial year 2016-17 is
EPS 3.76 4.50 5.64 positive for the automotive sector with
BVPS 17.54 22.41 25.51
significant growth focus in enhancing farm
ROE 21.10 20.80 20.70
Above calls are recommended wit h a t ime horizon of 8 t o 10 mont hs. Source: Company Websi t e Reut er s Capi t al i ne
6
EQUITY

     ADANI PORTS AND SPECIAL ECONOMIC ZONE LIMITED

                                                                                             The stock closed at ` 344.95 on 05th May 2017. It made a 52-week low at ` 169.70
                                                                                             on 19th May 2016 and a 52-week high of ` 359.25 on 05th April 2017. The 200 days
                                                                                             Exponential Moving Average (EMA) of the stock on the daily chart is currently at
                                                                                             ` 290.70.
                                                                                             It has formed double bottom pattern at lower levels and never looked back
                                                                                             which indicates its potential to remain upwards in the near term. Moreover, it is
                                                                                             very near to its 52 week high of 359 levels, which is achievable in the coming days
                                                                                             Therefore, one can buy in the range of 337-340 levels for the upside target of
                                                                                             357-362 levels with SL below 325.

     AMBUJA CEMENTS LIMITED

                                                                                             The stock closed at ` 246.55 on 05thMay 2017. It made a 52-week low at ` 191 on
                                                                                             22nd November 2016 and a 52-week high of ` 281.70 on 31st August 2016. The
                                                                                             200 days Exponential Moving Average (EMA) of the stock on the daily chart is
                                                                                             currently at ` 232.72.
                                                                                             As we can see on the charts, there is a rise in volumes and price from lower
                                                                                             levels. Moreover, oscillators are also supporting its northward movement.
                                                                                             Therefore, one can buy in the range of 242-244 levels for the upside target of
                                                                                             256-259 levels with SL below 235.

Disclaimer : The analyst and its affiliates companies make no representation or warranty in relation to the accuracy, completeness or reliability of the information contained in its
research. The analysis contained in the analyst research is based on numerous assumptions. Different assumptions could result in materially different results.
The analyst, not any of its affiliated companies, not any of their members, directors, employees or agents accepts any liability for any loss or damage arising out of the use of all or any
part of the analysis research.
SOURCE: CAPITAL LINE

Charts by Spider Software India Ltd

                                                  Above calls are recommended wit h a t ime horizon of 1-2 mont hs

                                                                                                                                                                                          7
DERIVATIVES
WEEKLY VIEW OF THE MARKET
Bears dragged down the market towards the weekend. Nifty has fallen 0.80% on the back of long unwinding and some calls writing.
Consolidation in nifty index has been witnessed post expiry with stock specific moves. Overall derivative data indicates long rollover and most
of the Nifty futures positions had been rolled with the average of 9300-9320 futures. Derivative data indicates bullish scenario to continue
after some consolidation. In the May option contracts, we are seeing options open interest building up in 9500 & 9400 calls and 9000 & 9300
puts, so the range for current expiry could be 9000-9500 with upwards bias. The Implied Volatility (IV) of calls was down and closed at 9.60%
while that for put options closed at 9.70%. The Nifty VIX for the week closed at 11.63. Among Nifty Call options, the 9400-strike call has the
highest open interest of more than 55 lakh shares. On put side, 9300-strike put has the highest open interest of over 48 lakh shares followed by
the 9000-strike put which have OI of over 49 lakh shares respectively. The PCR OI for the week closed up at 1.16 from 1.02 indicating put
writing. On the technical front 9200-9250 spot levels is strong support zone and current trend is likely to continue towards 9450-9500. Any dip
should be used as buying opportunity.
DERIVATIVE STRATEGIES
BULLISH STRATEGY BEARISH STRATEGY
ADANIPORTS ESCORTS ZEEL
BUY MAY 350. CALL 8.40 BUY MAY 600. CALL 18.80 BUY MAY 500. PUT 11.00
OPTION SELL MAY 360. CALL 5.15 SELL MAY 620. CALL 11.80 SELL MAY 490. PUT 7.15
STRATEGY
Lot size: 2500 Lot size: 1100 Lot size: 1300
BEP: 353.25 BEP: 607.00 BEP: 496.15
Max. Profit: 16875.00 (6.75*2500) Max. Profit: 14300.00 (13.00*1100) Max. Profit: 7995.00 (6.15*1300)
Max. Loss: 8125.00 (3.25*2500) Max. Loss: 7700.00 (7.00*1100) Max. Loss: 5005.00 (3.85*1300)
CEATLTD (MAY FUTURE) GRANULES (MAY FUTURE) HINDZINC (MAY FUTURE )
Buy: Above ` 1601 Sell: Below ` 137 Sell: Below ` 249
FUTURE
Target: ` 1640 Target: ` 131 Target: ` 243
Stop loss: ` 1581 Stop loss: ` 140 Stop loss: ` 252
NIFTY OPTION OI CONCENTRATION (IN QTY) CHANGE IN NIFTY OPTION OI (IN QTY)
In lakhs In lakhs
23.38
70.00
25.00
57.26
60.00
50.13
49.56
49.28
47.50
20.00
15.85
45.14
50.00
15.00
40.00
9.54
28.96
27.69
8.00
26.35
6.81
10.00
22.37
5.85
5.59
30.00
5.10
4.98
17.94
3.45
15.29
14.69
13.50
13.21
5.00
1.33
20.00
0.39
0.08
9.80
9.74
9.45
7.74
6.67
5.55
4.42
10.00 0.00
-0.04
-0.23
-0.30
-0.32
-0.30
-0.51
-0.95
-1.36
-2.93
0.00 -5.00
8500 8700 8800 8900 9000 9100 9200 9300 9400 9500 9600 8500 8700 8800 8900 9000 9100 9200 9300 9400 9500 9600
Call Put Call Put
BANKNIFTY OPTION OI CONCENTRATION (IN QY) (MONTHLY) CHANGE IN BANKNIFTY OPTION OI (IN QTY) (MONTHLY)
In 10000 In 10000
120.00 50.00
38.72
97.17
40.00
100.00
25.54
81.84
23.78
30.00
80.00
20.00
4.86
47.28
2.98
2.65
1.70
60.00
1.42
10.00
0.42
0.15
0.20
36.06
31.13
30.49
0.00
40.00
-0.10
-0.06
-0.09
-0.51
-0.56
-0.80
-1.22
17.81
17.66
-2.71
-4.42
-10.00
11.88
11.56
-7.23
8.25
8.54
7.48
7.28
20.00
6.76
5.30
5.21
3.30
3.20
3.14
3.26
-20.00
1.60
-18.74
0.00 -30.00
19000 20000 20500 21000 21500 22000 22200 22300 22400 22500 23000 19000 20000 20500 21000 21500 22000 22200 22300 22400 22500 23000
Call Put Call Put
8
DERIVATIVES
SENTIMENT INDICATOR (NIFTY) SENTIMENT INDICATOR (BANKNIFTY)
04-May 03-May 02-May 28-Apr 27-Apr 04-May 03-May 02-May 28-Apr 27-Apr
Discount/Premium 17.05 28.30 25.50 29.65 14.50 Discount/Premium 10.05 41 53 8.15 -32.65
COST OF CARRY% 0.70 0.71 0.69 0.65 0.61
COST OF CARRY% 0.70 0.71 0.69 0.65 0.61
PCR(VOL) 1.19 1.24 0.99 0.82 1.08
PCR(OI) 1.79 1.66 1.31 1.13 0.83
A/D RATIO(Nifty 50) 1.24 0.95 0.85 1.38 1.06
A/D RATIO(Banknifty) 2.00 1.40 2.00 2.00 2.00
A/D RATIO(All FO Stock)* 1.28 0.84 1.08 1.21 0.86
A/D RATIO# 3.40 2.67 1.44 4.50 2.67
Implied Volatality 9.60 10.08 9.96 9.40 10.02
VIX 11.33 11.53 11.45 10.86 10.86 Implied Volatality 13.72 13.80 13.74 12.44 13.00
HISTORY. VOL 9.75 9.74 10.05 10.35 10.50 VIX 11.33 11.53 11.45 10.86 10.86
*All Future Stock # All BANKING Future Stock
FII’ S ACTIVITY IN NIFTY FUTURE FII’s ACTIVITY IN DERIVATIVE SEGMENT
In Cr. In Cr.
1000
2213
2245
2500
587
403
2000
1406
500
1306
241
1300
1253
1500
63
857
0 1000
500
48
- 500
-439
0
-682
714
-805
- 500
- 1000
-388
-
-1027
- 1000
-873
-1238
- 1500
- 1500
20-Apr 21-Apr 24-Apr 25-Apr 26-Apr 27-Apr 28-Apr 2-M ay 3-M ay 4-M ay 20-Apr 21-Apr 24-Apr 25-Apr 26-Apr 27-Apr 28-Apr 2-M ay 3-M ay 4-M ay
Top long build up Top 10 short build up
LTP % Price Change Open interest %OI Chng LTP % Price Change Open interest %OI Chng
RAYMOND 775.15 3.48% 941600 256.67% BALRAMCHIN 159.6 -2.33% 4924500 150.36%
GODFRYPHLP 1233.35 2.61% 241000 190.36% MCX 1162.35 -5.08% 767000 109.85%
CANFINHOME 2858.85 8.47% 283500 163.72% MGL 1005.15 -2.87% 232800 83.89%
GSFC 143.15 10.63% 5985000 131.71% MRPL 131.2 -2.53% 1768500 82.79%
DCBBANK 193.85 5.07% 5886000 42.95% BERGEPAINT 255.8 -2.68% 519200 81.54%
PEL 2567.2 2.53% 372300 21.31% BALKRISIND 1509.1 -1.67% 155600 47.91%
ALBK 88.7 7.06% 18040000 20.99% CHOLAFIN 1087.4 -3.01% 131000 40.11%
SYNDIBANK 90.85 9.19% 21636000 20.62% TORNTPHARM 1337.25 -6.27% 284400 31.42%
ORIENTBANK 181 7.13% 15918000 19.50% INFIBEAM 1018.25 -2.16% 974000 30.35%
KPIT 131.1 1.27% 6200000 18.41% FORTIS 218.45 -1.71% 7681500 26.95%
**The highest call open interest acts as resistance and highest put open interest acts as support.
# Price rise with rise in open interest suggests long buildup | Price fall with rise in open interest suggests short buildup
# Price fall with fall in open interest suggests long unwinding | Price rise with fall in open interest suggests short covering
9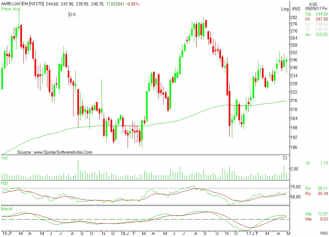
SPICES                                                                              BULLIONS
The downtrend of turmeric futures (June) is likely to get extended further as       Bullion counter can remain on weaker path as lack of safe haven demand and
it can test 5000-4950 levels. A Likely bumper crop in 2016-17 (Jul-Jun) due to      fear of US fed rate hike in June meeting can keep the prices subdued but short
favourable weather and better realisations in the previous season is                covering cannot be denied as prices have become technically oversold.
continuously weighing on turmeric prices. In Andhra Pradesh, production this        Movement of local currency rupee can also affect the prices which can move in
year has been pegged at 155,000 tons, compared with 121,000 tons in 2015-           the range of 63-65. Gold can face resistance near $1280 in COMEX and 29000 in
16, according to the third advance estimate by the state's farm department.         MCX while it has support near $1200 in COMEX and $27500 in MCX. Silver has
Rise in output this year can be attributed to better realisations in the previous   key support near 36000 in MCX and $15.50 in COMEX. And it has resistance near
season which encouraged farmers to sow more of the yellow spice. Coriander          40000 in MCX and $17.20 in COMEX. Fed leaders meet again in June, and it is
futures (June) is expected to take some support near 5500 levels & some             predicted that there's a 67% chance of a June rate increase, according to CME
recovery can be seen. Special margin of 7.5% on short side (in addition to          Group. The majority of the Fed's 17 leaders predict two or more rate hikes for
Special margin of 7.5% on short side which will be effective from May 5, 2017       the rest of the year. That's a faster pace compared to the last two years when
and the existing Special / Additional Margins) will be imposed on all the
                                                                                    the Fed only raised rates once a year. Meanwhile World Gold Council showing
running contracts and yet to be launched contracts in Coriander w.e.f May 08,
                                                                                    sizable declines in global gold investment and central bank demand, along
2017. At present, market participants are worried about constant increase in
                                                                                    with expectations that the Federal Reserve is on track to raise interest rates at
imports of coriander supported by strong Indian rupee and decreasing export
quantities from the country. Cardamom futures (June) is expected to                 a gradual pace pressured prices. WGC says global demand for gold in the March
consolidate in the range of 1020-1180 levels with upside getting capped. The        quarter totaled to 1,034 tonnes, a decline of 18% compared to the record Q1 in
counter may not get enough room for upside as internal demand becoming              2016. Meanwhile, first quarter jewellery demand was 481 tonnes, marginally
sluggish, growers are trying to liquidate stocks before the start of the next       up from a year before, due to gains in India. However, demand remains
season which is expected to set in a month earlier in June because of good          relatively weak in a historical context, 18% below the 5-year quarterly
summer showers. Pepper mini futures (May) will possibly trade in the range of       average.
55300-57300 levels. The domestic demand is slack & the industry buyers are
buying only to meet immediate requirements.                                             ENERGY COMPLEX

    OIL AND OILSEEDS                                                                Crude oil prices may witness further weakness as global supply glut and
                                                                                    increased US production may keep the prices under pressure. Overall crude
The overall sentiments of the oilseed complex are likely to remain bearish          oil can trade in the range of 2700-3000 in MCX. Crude oil crashed to five-
owing to the prospects of higher availability & improving yields from 903 kg        month lows recently, as concerns about global oversupply wiped out the
per hectares in 2015-16 to 998 kg in 2016-17. Soybean futures (June) is likely
to trade sideways with a downside bias in the range of 2880-3050 levels. A          entire price gains since OPEC's move to cut output. Doubts that the OPEC-led
bearish trend is prevailing in the spot markets on account of poor demand           cuts, even when fully implemented, are deep enough to draw down bloated
from processors. In recent times, the demand of soy meal from poultry feed          storage levels around the world are also weighing on prices. Both Brent and
manufactures has forced most of them to procure in a very limited quantity.         WTI futures are down around 17 percent for the year so far despite the OPEC
Secondly, the competitive of Indian soy meal in the world market has                effort to support price in a sign of ongoing oversupply .The amount of oil
deteriorated as the export price versus Argentina origin has widened to $45-        stored on tankers in Malaysia's waters has surged again recently, after
50 per ton & market participants feel that India is likely to get very limited      drawing down slightly in March and April. OPEC is scheduled to meet on May
export orders in coming days. On CBOT, U.S soybean futures (July) is expected       25 to decide whether to extend the cuts. Natural gas may move in the range
to trade sideways in the range of $9.65-9.90 levels. The concerns still lingers
                                                                                    of 190-215 in MCX as weather related demand to give further direction to the
that recent wet weather in the United States may have washed away recently
planted soybeans crops. The downtrend in mustard futures (June) is likely to        prices. Data from the U.S. Energy Information Administration showed that
witness a pause as it may trade in the range of 3600-3900 levels. At the spot       domestic supplies of natural gas rose by 67 billion cubic feet for the week
markets, the farmers have slowed down the sales of mustard seed as the spot         ended April 28. Total natural gas in storage currently stands at 2.256 trillion
price is trading around the MSP i.e. Rs.3700/100kg. Ref. soy oil futures (June)     cubic feet, 13.7% lower than levels at this time a year ago but 13.4% above
may witness some recovery taking support near 610 levels. CPO futures (May)         the five-year average for this time of year. Meanwhile, a strong spring storm
is likely to witness a consolidation in the range of 485-495 levels. At the spot    tracking through the southeastern U.S. with heavy showers and
markets, the market participants have started to discount all negative factors      thunderstorms will push across the Great Lakes and Northeast this week to
and focusing on bargain buying from lower levels to meet the demand of
                                                                                    keep below normal temperatures in place.
Ramadan which begins in late May.

    OTHER COMMODITIES                                                                   BASE METALS

Kapas futures (April '18) is expected to take support near 935 levels & see         Base metals counter can witness lower level buying after the steep fall
some recovery towards 1000-1020 levels. As cited by the International Cotton        witnessed in past few weeks amid China slowdown concerns. China's factory
Advisory Committee, India's consumption of cotton by the mills in the country       sector lost momentum in April, with growth slowing to its weakest pace in
is seen rising 2% in 2017-18 to 5.2 million tons, due to competitive prices for     seven months as domestic and export demand faltered. The Caixin/Markit
cotton yarn products. On the international market, cotton futures are               Manufacturing Purchasing Managers' index (PMI) fell to 50.3 in April, missing
holding up gains supported by better-than-expected U.S. export sales report         economist forecasts' of 51.0 and a significant decline from March's 51.2. A
amid a weaker dollar. The latest weekly export sales data from the U.S.             flurry of government measures in China to cool the overheating property
Department of Agriculture (USDA) showed net upland sales totaled 152,400            market and a slow rise in borrowing costs are expected to tap the brakes on
running bales for the previous week, up 32 percent from the week before.            surging property investment and construction eventually. Copper may move
Mentha oil futures (May) will probably take support near 905 levels & the           in the range of 345-380 in MCX. Copper fell as rising inventories and worries
downside may remain capped supported by thin stocks in the country along            over cooling demand kept the prices on weaker note. Lead can trade in the
with concerns of lower production this season. The sowing of mentha has             range of 135-150. Nickel can move in the range of 550-630. Nickel plunged
been completed in Uttar Pradesh, but initial reports reveal that acreage may        following the news of rejection of appointment of Regina Lopez as
fall at least by 20% due to poor realization received by farmers in last few        environment secretary by Philippine lawmakers as it is likely to ease the
seasons. Mentha sowing in Rampur and adjoining areas is good, but down by           supply woes for the metal used in making stainless steel. Philippine
30-40% in Sambhal and 10% lower in Barabanki and Chandausi region. Guar seed        government will move forward with second review of country's mines despite
futures (June) may trade in the range of 3550-3800 levels. The downside may         removal of Regina Lopez as environment minister. Zinc can move in the range
get limited as guar seed arrivals in the country has now turned very thin due to    of 160-175. Aluminum prices may trade in the range of 120-128 in MCX. The
lean season and slow selling by farmers as they are engaged in liquidating their    Chinese government is serious about forcing aluminium producers in 28 cities
chana and wheat crop. Rubber futures (June) is likely to plunge towards 13000-      to cut output during winter, potentially cutting production by 1-1.5 million
12800 levels. Persistent low bulk-demand and weakness in global markets is          tonnes. China, would force smelters in four provinces surrounding Beijing to
pulling down the wholesale prices of rubber in the domestic markets.                cut output by 30 percent over the winter heating season to battle pollution.

                                                                                                                                                                  10
COMMODITY
TREND SHEET
EXCHANGE COMMODITY CONTRACT CLOSING DATE TREND TREND RATE TREND SUPPORT RESISTANCE CLOSING
PRICE CHANGED CHANGED STOP/ LOSS
NCDEX SOYABEAN MAY 2863. 00 04. 05. 17 Down 2863. 00 - 2950. 00 3000. 00
NCDEX JEERA MAY 18290.00 23.03.17 Up 17905.00 18200.00 - 18100.00
NCDEX REF.SOY OIL MAY 618.10 16.02.17 Down 670.55 - 630.00 635.00
NCDEX RM SEEDS MAY 3697.00 06.04.17 Down 3897.00 - 3900.00 4000.00
NMCE PEPPER MINI JUNE 56200.00 30.03.17 Sideways
NMCE RUBBER JUNE 13722.00 30.03.17 Down 14402.00 - 14500.00 14800.00
MCX MENTHA OIL MAY 916.80 23.03.17 Down 978.20 - 960.00 980.00
MCX CARDAMOM JUNE 1056.10 20.04.17 Down 1177.90 - 1150.00 1175.00
MCX SILVER JULY 38052. 00 04. 05. 17 Down 38052. 00 - 40000. 00 42000. 00
MCX GOLD JUNE 28072. 00 04. 05. 17 Down 28072. 00 - 28700. 00 29400. 00
MCX COPPER JUNE 358.55 20.04.17 Down 364.15 - 375.00 385.00
MCX LEAD MAY 141.20 20.04.17 Down 140.05 - 145.00 150.00
MCX ZINC MAY 165.20 09.03.17 Down 178.95 - 170.00 175.00
MCX NICKEL MAY 580.00 30.03.17 Down 653.00 - 620.00 650.00
MCX ALUMINIUM MAY 122.05 12.04.17 Sideways
MCX CRUDE OIL MAY 2931.00 27.04.17 Down 3147.00 - 3100.00 3200.00
MCX NATURAL GAS MAY 204.30 30.03.17 Up 207.20 195.00 - 190.00
*Closing as on 04.05.17
NOTES : 1) These levels should not be confused with the daily trend sheet, which is sent every morning by e-mail in the name of Daily report- commodities (Morning Mantra).
2) Sometimes you will find the stop loss to be too far but if we change the stop loss once, we will find more strength coming into the commodity. At the moment, the stop loss will be far as we
are seeing the graphs on weekly basis and taking a long-term view and not a short-term view.
TECHNICAL RECOMMENDATIONS
GOLD MCX (JUNE)
GOLD MCX (JUNE) contract closed at ` 28072 on 04th May'17. The contract made its high of ` 34000 on
12th July'16 and a low of ` 26895 on 22nd Dec'16. The 18-day Exponential Moving Average of the
commodity is currently at ` 28733.
On the daily chart, the commodity has Relative Strength Index (14-day) value of 50. One can sell in the
range of ` 28250-28300 with the stop loss of ` 28450 for a target of ` 27900.
SILVER MCX (JULY)
SILVER MCX (JULY) contract closed at ` 38052 on 04th May'17. The contract made its high of ` 44578 on
01st Mar'17 and a low of ` 37827 on 04th May'17. The 18-day Exponential Moving Average of the
commodity is currently at ` 40329.
On the daily chart, the commodity has Relative Strength Index (14-day) value of 48. One can sell in the
range of ` 38450-38550 with the stop loss of ` 38800 for a target of ` 37800.
SOYAREFINED NCDEX (MAY)
SOYAREFINED NCDEX (MAY) contract closed at ` 618.10 on 04th May'17. The contract made its high of
` 725.95 on 09th Dec'16 and a low of ` 605.40 on 27th Apr'17. The 18-day Exponential Moving Average of
the commodity is currently at ` 618.57.
On the daily chart, the commodity has Relative Strength Index (14-day) value of 40. One can sell in the
range of ` 618-621 with the stop loss of ` 630 for a target of ` 610.
11COMMODITY
NEWS DIGEST WEEKLY COMMENTARY
∑ Copper output in Democratic Republic of Congo, Commodities counter remained in a bear grip for the continuous third week. CRB closed near
Africa's top producer, hit 274,316 tonnes in the first 178, which made a high of 197.66 in 2017 so far. Dollar index moved up and most of the
quarter of 2017, a more than 20 percent increase commodities turned weak. The US Federal Reserve has kept interest rates unchanged,
over the same period last year. downplaying weak first-quarter economic growth while emphasizing the strength of the labor
∑ US Initial claims for state unemployment benefits market; signaling it is still on track for two more rate rises this year. On Thursday, dollar saw
dropped 19,000 to a seasonally adjusted 238,000 some correction. Energy counter saw a sharp fall. Crude oil prices continued to decline after
for the week ended April 29. EIA inventory data showed stockpiles shed just 930k barrels last to last week, a far smaller
∑ According to the World Gold Council “Central bank drawdown than the 2.91 million barrel outflow expected by economists. Furthermore, the
gold demand hit its lowest in nearly six years in the same report showed that a measure of implied US crude demand plunged 5.4%, marking the
first quarter”. largest weekly drop in seven months. The spotlight now turns to Census Bureau data tracking
US crude oil exports through the first three months of the year. Shipments hit 1.12 million
∑ Markit's Manufacturing PMI for the Euro zone
barrels per day in February, the most in atleast last six years. Natural gas prices fell as cool
jumped to 56.7 in April from March's 56.2, reaching
weather raised long-term concerns that summer heat won't show up in full force. Industrial
its highest level since April 2011.
metals turned weak on bearish cues. Nickel prices declined on the news of rejection of
∑ The government has procured 25.07 million tonnes of appointment of Regina Lopez as environment secretary by Philippine lawmakers as it is likely
wheat so far in the marketing year that started April. to ease the supply woes for the metal used in making stainless steel. Copper prices dropped
The procurement is 18.8% higher than a year ago. after a jump in inventories increased, worries about an economic slowdown in China, the
∑ Special margin of 7.5% on short side (in addition to world's largest consumer of the metal. On-warrant inventories available for delivery at LME-
Special margin of 7.5% on short side which will be registered warehouses increased by 38,950 tonnes, or 32%, to 160,200 tonnes, the highest
effective from May 5, 2017 and the existing Special since mid-April.
/ Additional Margins) will be imposed on all the
running contracts and yet to be launched contracts The forecast of a normal monsoon, weak demand and rising supply of agri commodities,
in Coriander w.e.f May 08, 2017. following a good crop, led to a fall in prices of the produce. Wheat arrivals have risen sharply.
∑ The total vegetable oil availability from Kharif and FCI has recorded huge procurement in some parts of North India. Cardamom prices
Rabi Oilseeds crops for the year 2016-17 (Nov-Oct) strengthened on lower level buying. A further fall in small cardamom prices below ` 1,000 per
has increased by 12.88 lakh tonnes and is estimated kg for the first time this season will benefit exporters as India is facing tough competition from
at 84.90 lakh tonnes compared to 72.02 lakh tonnes Guatemala. Cardamom prices touched a five-year high of Rs 1,400 per kg earlier this year as
last year. - The Solvent Extractors' Association of output fell by 50% from a year ago. From there it saw continuous decline on smooth supply by
India (SEA). Guatemala.
NCDEX TOP GAINERS & LOSERS (% Change) MCX TOP GAINERS & LOSERS (% Change)
8% 6%
6.02% 4.37%
6%
4%
4%
2%
2% 1.29%
0.31% 0.30%
0%
0%
- 2% - 2%
- 4%
- 4%
- 6% - 5.00%
- 6.05% - 5.04% - 5.00%
- 6%
- 6.53% - 5.78%
- 8%
- 6.68%
- 8%
-10% -7.66%
- 9.59%
- 10.70%
-12% -10%
CASTOR SEED GUARGUM CRUDE BR. CRUDE CASTOR
SHANKARKAPAS SOY OIL CORIANDER TURMERIC NEW JEERA 5MT CARDAMOM CPO RBD PMOLEIN OIL OIL SEED SILVER M NICKEL M
WEEKLY STOCK POSITIONS IN WAREHOUSE (NCDEX) WEEKLY STOCK POSITIONS IN WAREHOUSE (MCX)
COMMODITY UNIT 27. 04. 17 04. 05. 17 DIFFERENCE
COMMODITY UNIT 27. 04. 17 04. 05. 17 DIFFERENCE
QTY. QTY.
QTY. QTY.
CASTOR SEED MT 76053.00 77883.00 1830.00
CORIANDER NEW MT 17994.00 19166.00 1172.00 CARDAMOM MT 23.10 13.10 -10.00
COTTON SEED O.C MT 31664.00 31153.00 -511.00
GUARGUM MT 25567.00 25611.00 44.00 COTTON BALES 34300.00 34300.00 0.00
GUARSEED MT 15240.00 15086.00 -154.00
GOLD KGS 20.00 20.00 0.00
JEERA NEW MT 841.00 1387.00 546.00
MAIZE MT 1649.00 1297.00 -352.00 GOLD MINI KGS 6.50 26.50 20.00
RM SEED MT 24551.00 28243.00 3692.00
SOYBEAN MT 123252.00 119549.00 -3703.00 GOLD GUINEA KGS 4.41 4.41 0.00
SUGAR MT 1609.00 1219.00 -390.00 MENTHA OIL KGS 935154.00 796580.45 -138573.55
TURMERIC MT 2900.00 3328.00 428.00
WHEAT MT 7675.00 8554.00 879.00 SILVER (30 KG Bar) KGS 30780.02 33234.92 2454.90
12COMMODITY
SPOT PRICES (% change) Global gold demand in Q1 2017
• According to the World Gold Council (WGC), global gold demand in first
GUR (MUZAFFARNGR.) 8.81 quarter of 2017 slipped 18% from a year before, due to a slowdown in inflows
in exchange-traded funds (ETFs), and a drop in demand from central banks.
SUGAR (KOLKATA) 1.72 • In a report released on April 04, 2017, WGC said that the global demand in the
March quarter totaled to 1,034 tones, as compare to the record 1,262 tonne
in Q1 2016.
COTTON (KADI) 0.30 • Inflows into ETFs was 109 tonnes in Q1 2017, which was just one third of Q1
last year's near-record inflows of 342 tonnes.
WHEAT (DELHI) -0.81 • Central bank demand also slipped to 76 tonnes, 27% lower from 104 tonnes in
Q1, 2016.
• However, bar and coin investment grew 9 per cent to 290 tonnes, while
MUSTARD (JAIPUR) -0.86 demand firmed up slightly in both the jewellery and technology sectors.
• The first quarter jewellery demand was 481 tonnes, marginally up from a
CRUDE PALM OIL (KANDLA) -0.96 year ago, due to gains in India. However, demand remains relatively weak in
a historical context, 18% below the 587.7 ton 5-year quarterly average.
SOYABEAN (INDORE) -1.04
• Indian demand for gold rose 15% year-on-year to 124 tonnes in Q1 2017 as
Indian consumers enjoyed a period of relative stability in the domestic
market. Continued remonetisation by the Reserve Bank of India buoyed
RAW JUTE (KOLKATA) -1.19 consumer sentiment, which encouraged demand ahead of the auspicious
wedding season.
BARLEY (JAIPUR) -2.06 • Indian jewellery demand jumped to 92.3 tonnes in Q1 2017, 16% year-on-
year from 79.8 ton in 2016.
COTTON SEED OIL CAKE (AKOLA) -2.61
JEERA (UNJHA) -2.92
GUAR SEED (JODHPUR) -2.99
GUAR GUM (JODHPUR) -3.72
PEPPER MALABAR GAR (KOCHI) -3.97
TURMERIC (NIZAMABAD) -6.32
CORIANDER (KOTA) -8.51 • In China, demand for gold jewellery softened slightly, down 2% year-on-year.
Demand in the first quarter was 176.5t, compared with 179.2t in Q1 2016.
• Growth in US jewellery demand resumed in the first quarter. It rose 3% to 22.9t.
-10.00 -8.00 -6.00 -4.00 -2.00 0.00 2.00 4.00 6.00 8.00 10.00 • European jewellery demand was again dragged down 6% yoy due to weakness
in France and the UK.
WEEKLY STOCK POSITIONS IN LME (IN TONNES) • India's bar and coin demand stood at 31.2t in Q1 – up 3.8t on last year's low
level, but just half its five year quarterly average.
COMMODITY STOCK POSITION STOCK POSITION DIFFERENCE
• The European bar and coin market is in good health while The US market
27. 04. 17 04. 05. 17 suffered in the first quarter.
ALUMINIUM 1655825 1617100 -38725 • European bar and coin Demand in the first quarter of 2017, at 60.8t, is up 9%
yoy while US demand fell 20% to 16.2t, the lowest level of demand since Q2
COPPER 261475 284925 23450 2015, as retail investors shifted their focus away from gold to buy into the
NICKEL 379338 380472 1134 Trump rally and chase equity markets higher.
• Despite overall lower buying by central banks, there were few active buyers
LEAD 165750 168700 2950 in Q1. Russia gold reserves increased by 64.9t to 1,680.1t, taking gold as a
ZINC 350750 344725 -6025 percentage of the country's reserves to 17%, its highest level since Q1 2000.
• The National Bank of Kazakhstan added 9.6t to gold reserves in Q1, extending
its unbroken run of net purchases to 54 consecutive months.
PRICES OF METALS IN LME/ COMEX/ NYMEX (in US $) • Overall demand for gold in technology was marginally firmer at 78.5t in Q1.
This was slightly exaggerated, however, by Q1 2016 having been the lowest
COMMODITY EXCHANGE CONTRACT 28 . 04. 17 04. 05. 17 CHANGE% quarter on record (at 76.4t).
ALUMINIUM LME 3 MONTHS 1911.50 1913.00 0.08 • Total gold supply also reached 1,032 tonnes this quarter, a fall of 12% compared
with the first quarter of 2016, mainly due to 21% fall in recycling to 283 tonnes
COPPER LME 3 MONTHS 5735.50 5543.00 -3.36 and continued net de-hedging of a further 15 tonnes by producers.
LEAD LME 3 MONTHS 2249.00 2190.00 -2.62
INTERNATIONAL COMMODITY PRICES
NICKEL LME 3 MONTHS 9450.00 9015.00 -4.60
COMMODITY EXCHANGE CONTRACT UNIT 28. 04. 17 04. 05. 17 CHANGE(%)
ZINC LME 3 MONTHS 2623.00 2569.00 -2.06
GOLD COMEX JUNE 1268.30 1228.60 -3.13 Soybean CBOT JULY Cent per Bushel 956.25 974.25 1.88
SILVER COMEX JULY 17.26 16.30 -5.57 Soy oil CBOT JULY Cent per Pound 31.71 32.50 2.49
LIGHT CRUDE OIL NYMEX JUNE 49.33 45.52 -7.72 CPO BMD JULY MYR per MT 2508.00 2536.00 1.12
NATURAL GAS NYMEX JUNE 3.28 3.19 -2.63 Sugar LIFFE MAY 10 cents per MT 459.50 442.50 -3.70
13CURRENCY
Currency Table News Flows of last week
Currency Pair Open High Low Close 02nd May UK Manufacturing growth At 3-Year High
02nd May British Manufacturing expanded most in 3 Years
USD/INR 64.39 64.46 64.33 64.38
03rd May Euro zone GDP growth steady at 0.5%
EUR/INR 70.38 70.51 70.13 70.44
03rd May Fed Stands pat on Interest Rates, on track for two more hikes in
GBP/INR 83.15 83.38 82.71 83.06
2017
JPY/INR 57.63 57.65 57.05 57.07
04th May India's Private Sector expanded at slower pace
(Source: Spider Software, Open: Tuesday 9.00 AM IST, Close: Thursday (5.00 PM IST)
04th May Euro zone Retail Sales growth slowed in March
Market Stance Economic gauge for the next week
Indian rupee traded in a narrow range in the week gone by on the back of Date Currency Event Previous
mixed sentiments. The uncertainty of timing of an interest rate hike from the
10th May GBP NIESR GDP Estimate (3M) 0.5
Federal Reserve kept the local unit in doldrums. US central bankers stuck to 11th May GBP BoE Asset Purchase Facility 435
their outlook for gradual monetary-policy tightening after they left interest 11th May GBP BoE Interest Rate Decision 0.25
rates unchanged, as expected, but left open the prospect of raising them next 11th May GBP Monetary Policy Summary -
month. Meanwhile, spectacular rebound in local equities kept the losses 11th May GBP BOE MPC Vote Unchanged 8
under check for rupee. The rally in domestic equities was spearheaded by 11th May GBP BOE MPC Vote Cut 0
banking stocks after the Union Cabinet on Wednesday cleared an ordinance 11th May GBP BOE MPC Vote Hike 1
empowering the Reserve Bank of India (RBI) to act against willful defaulters. 11th May GBP Bank of England Minutes -
In other currencies, the euro traded near a six-month high as against the dollar 12th May USD Retail Sales (MoM) -0.2
12th May USD Consumer Price Index (YoY) 2.4
supported by expectations that centrist Emmanuel Macron would win France's
12th May USD Consumer Price Index Ex Food & Energy (YoY) 2
presidential election.
Technical Recommendation USD/ INR EUR/ INR
USD/ INR (MAY) contract closed at 64.38 on 04th May'17. The contract made its EUR/ INR (MAY) contract closed at 70.44 on 04th May'17. The contract made its
high of 64.46 on 02nd May'17 and a low of 64.33 on 03rd May'17 (Weekly Basis). The high of 70.51 on 04th May'17 and a low of 70.13 on 04th May'17 (Weekly Basis). The
14-day Exponential Moving Average of the USD/INR is currently at 64.51. 14-day Exponential Moving Average of the EUR/INR is currently at 69.99.
On the daily chart, the USD/INR has Relative Strength Index (14-day) value of On the daily chart, EUR/INR has Relative Strength Index (14-day) value of 58.90.
38.21. One can sell below 64.30 for the target of 63.75 with the stop loss of 64.55. One can buy around 70.60 for a target of 71.45 with the stop loss of 70.15.
GBP/ INR JPY/ INR
GBP/ INR (MAY) contract closed at 83.06 on 04th May'17. The contract made its JPY/ INR (MAY) contract closed at 57.07 on 04th May'17. The contract made its
high of 83.38 on 03rd May'17 and a low of 82.71 on 04th May'17 (Weekly Basis). The high of 57.65 on 02ndMay'17 and a low of 57.05 on 04th May'17 (Weekly Basis). The
14-day Exponential Moving Average of the GBP/INR is currently at 82.61. 14-day Exponential Moving Average of the JPY/INR is currently at 58.08.
On the daily chart, GBP/INR has Relative Strength Index (14-day) value of 57.97. On the daily chart, JPY/INR has Relative Strength Index (14-day) value of 33.56.
One can buy around 83.25 for a target of 84.25 with the stop loss of 82.75 One can sell below 57.35 for a target of 56.60 with the stop loss of 57.70.
14IPO
Housing and Urban Development Corporation Ltd SMC Ranking
(3.5/5)
Issue Highlights About the company
Incorporated in 1970, HUDCO is a wholly-owned Government company with more than 46 years
Total Issue (Shares) - Offer for sale 204,058,747
experience in providing loans for housing and urban infrastructure projects in India. The company
Total Issue (Shares) - Fresh Issue 0
provides long term finance for construction of houses and to undertake housing and urban
Net Offer to the Public 204,058,747
infrastructure development programs.
Issue Size (Rs. Cr.) 1142-1224
Price Band (Rs.) 56-60 Strength
Key role in various Governments’ schemes : The company plays a key role in various Governments’
Offer Date 8-May-17
schemes to develop the Indian housing and urban infrastructure sectors. Through its role of
Close Date 11-May-17
appraising projects under various Government schemes, it has built a strong relationship with State
Face Value 10
Governments and their agencies.
Lot Size 200
Highest credit ratings, access to diversified and lower-cost funding: The company holds a credit
rating of AAA, the highest credit rating, for long-term borrowings from each of CARE, ICRA and IRRPL,
which lowers its cost of borrowing. Moreover, its relationship with the Government currently
Issue Composition In shares provides the company with access to funds for a long-term duration and at a lower cost of borrowing.
Total Issue Shares 204,058,747 Established track record : The Company has been profitable since its inception over 46 years ago,
QIB 100,095,000 including a profit after tax of Rs 4,96.86 Cr (consolidated), Rs 8,09.61 Cr (consolidated), Rs 7,68.32
NIB 30,028,500 Cr and Rs 7,33.97 Cr for the nine months ended December 31, 2016 and Fiscals 2016, 2015 and 2014,
respectively. As at December 31, 2016, the company had a net worth of Rs 89,08.26 Cr(standalone).
Retail 73,935,247
The CRAR of the company as at December 31, 2016 was 63.70%, all of which was Tier 1 capital,
compared to the minimum required CRAR of 12.00% and a minimum Tier 1 CRAR of 6.00%.
Objects of the Issue
Strategy
To carry out the disinvestment of 204,058,747Equity To expand total Loan Portfolio and increase Housing Finance and social housing finance as a
Shares by the Selling Shareholder constituting percentage of its total Loan Portfolio: The company believes that State governments and their
10.19% of the Company’s pre-Offer paid up Equity agencies will continue to play a key role in helping to finance the building of new dwellings for the
LIG, EWS and persons in rural areas and it believes this provides the company with the opportunity to
Share capital of the Company;
grow its Loan Portfolio and increase Housing Finance loans and social housing loans as a percentage
To achieve the benefits of listing the Equity Shares of its Loan Portfolio.
on the Stock Exchanges.
Continue to focus on sanctioning loans to State Governments and their agencies: Due to
increasing NPAs in loans made to the private sector, in March 2013, the company Board decided that
Book Running Lead Manager IDBI Capital Markets & it should stop sanctioning new Housing Finance loans to the private sector and to focus on
sanctioning loans to State Governments and their agencies, where the risk of NPAs is lesser. As a
Securities Limited
result of this strategy, the company has managed to decrease its net NPAs from 2.52% as at March 31,
ICICI Securities Limited
2014 to 1.51% as at December 31, 2016.
Nomura Financial Advisory
and Securities (India) Private Continue to participate in the implementation of government housing and urban infrastructure
programmes: In the past, the Company has provided, and plan to continue to provide consultancy
Limited
services and finance for the implementation of Government programmes on housing and urban
SBI Capital Markets Limited
infrastructure. Hopefully, the company would play a role in building smart cities and AMRUT.
Name of the registrar Alankit Assignments Limited Incentivise borrowers to avail fixed interest rate: In order to reduce its interest rate and liquidity
risks, the company has been incentivising State Governments and their agencies to avail fixed
interest rate loans for all loans except HUDCO Niwas by keeping the fixed interest rates lower than
floating interest rates.
Risk
• Risk from volatility in interest rates
Valuation • Risk from the GoI, State Governments, the RBI or the NHB policy changes
• Increasing competition from Indian banks in the urban infrastructure finance sector
At upper price band of Rs.60, EPS and P/E of FY2017 are • Concentrations of loans to various State government and their agencies
Rs. 3.31and 18.13 multiple respectively and at a lower
Outlook
price band of Rs. 56, P/E multiple is 16.92; at upper price
band of Rs.60 , book value and P/B of FY2017 are Rs.45.63 The Company is set to play a significant role in Pradhan Mantri Awas Yojana (PMAY) under Housing for
and 1.31 multiple respectively and at a lower price band of All (HFA) by 2022 and thus the outlook of the company looks bright. Moreover, it enjoys AAA rating for
Rs. 56, P/B multiple is 1.23. No change in pre and post its debt plans from rating agencies like CARE and ICRA. With Pan India presence, company is set to
issue EPS and Book Value as the company is not making explore growth potentials. Investors with long term horizon may consider for investment.
fresh issue of capital.
15You can also read