Hotel and Other Accommodation Supply & Demand Study - MARKET STUDY 17 JANUARY 2019
←
→
Page content transcription
If your browser does not render page correctly, please read the page content below
Hotel and Other Accommodation
                        Supply & Demand Study
                        MARKET STUDY
                        17 JANUARY 2019

                                          PREPARED FOR
                                          Plymouth City Council (PCC)

Accelerating success.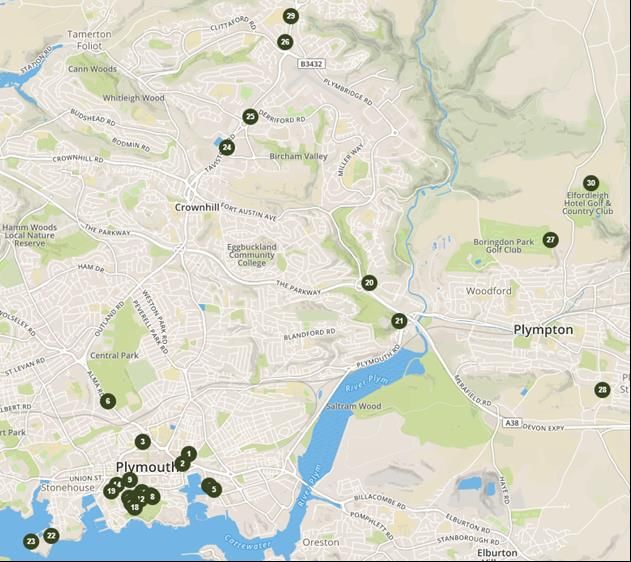
COLLIERS INTERNATIONAL PROPERTY
                                         CONSULTANTS LIMITED

                                         Company registered in England and Wales no. 07996509
                                         Registered office:
                                         50 George Street
                                         London W1U 7GA
                                         UK

                                         Tel: +44 (0) 20 7935 4499
                                         http://www.colliers.com/en-gb/uk

             Version Control
             Status                           FINAL

             Job Number                       JOB0221102

                                              Hotel and Other Accommodation - Supply & Demand
             Filename/Document ID
                                              Study

COLLIERS INTERNATIONAL UK                                             2 of 70
Hotel and Other Accommodation - Supply & Demand Study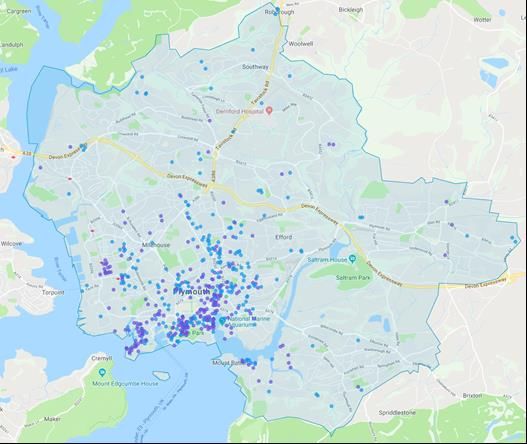
TABLE OF CONTENTS
1     Executive summary                                               5
1.1       Introduction                                                5
1.2       Scope of Work                                               5
1.3       Plymouth                                                    5

2     Tourism and Demand Generators Overview                          6
2.1       Visitors to Plymouth                                        6
2.2       Segmentation of Demand for Hotels                          12
2.3       Source Markets                                             15

3     Hotel Supply and Demand Performance                            18
3.1       Hotel Supply in Plymouth                                   18
3.2       Hotel Performance in Plymouth                              25
3.3       Plymouth in Comparison to Other Cities                     36
3.4       Future Supply Analysis                                     42
3.5       Other Demand Research                                      45

4     Other Accommodation                                            47
4.1       Overview of Existing Supply                                47
4.2       The Airbnb Market                                          47

5     The Conference and Events Market                               53
5.1       Supply                                                     53

6     Analysis and Opportunities                                     56
6.1       Plymouth SWOT Analysis                                     56
6.2       Hotel Opportunities Overview                               57

7     Indirect Benefits                                              58
7.1       Overall Hospitality Industry in the UK                     58
7.2       The Development Mix                                        59
7.3       Benefits of New Hotel Developments in Plymouth             60

COLLIERS INTERNATIONAL UK                                  3 of 70
Hotel and Other Accommodation - Supply & Demand Study
8    Conclusion                                                   63

APPENDIX 1: GLOSSARY OF TERMS

APPENDIX 2: GENERAL TERMS OF REFERENCE,
  ASSUMPTIONS AND CONDITIONS

APPENDIX 3: STANDARD TERMS OF BUSINESS

COLLIERS INTERNATIONAL UK                               4 of 70
Hotel and Other Accommodation - Supply & Demand Study

1 EXECUTIVE SUMMARY
1.1 INTRODUCTION
This Hotel and Other Accommodation Market Study presents an overview of the overall
accommodation market (i.e. hotels, guesthouses, etc.) in Plymouth in terms of supply, demand
and future developments. The appendices are provided to present further information to
Plymouth City Council (PCC) and Destination Plymouth.
1.2 SCOPE OF WORK
Our initial scope of work was to provide analysis in relation to the following:
Tourism and demand trends in Plymouth;
Overview of the overall accommodation offering in Plymouth, including hotels, Airbnb and
guesthouses;
Analysis of hotels and Airbnb supply, demand as well as performance;
Assessment of the strongest sites with potential for hotel development;
Conferencing demand, supply and SWOT analysis;
Indirect benefits of future hotel supply;
Conclusions and recommended next steps.
The agenda behind our work was to consider the market in relation to the desire of Plymouth
City Council and Destination Plymouth (the formally recognised DMO 1 for the city), to see new
and quality hotel development in Plymouth. This has guided our work.
1.3 PLYMOUTH
Plymouth is a destination that deserves to be better known than it is. It is the largest city in the
South West after Bristol, with a population of 262,700 (ONS 2015 estimates). The city boasts
the UK’s largest aquarium that has c. 300,000 visitors a year, it is the home of Princess Yachts
and Plymouth Gin, and its university has over 20,000 students. Its Theatre Royal is the best
attended and largest regional theatre in the UK. It was host to America’s Cup in 2011, is the
finishing point of the biennial Fastnet yacht race and 16 million Americans can trace their
origins back to Plymouth and the departure of the Mayflower in 1620. Devonport is also the
largest naval base in Western Europe. It is a key business base for well-known companies
such as Princess Yachts, Wrigley, Babcock Marine, Kawasaki, as well as being a major public
sector employment location, including employment of over 7,000 people at Derriford Hospital.
1
Destination Management Organisation
COLLIERS INTERNATIONAL UK 5 of 70
Hotel and Other Accommodation - Supply & Demand Study
2       TOURISM AND DEMAND
        GENERATORS OVERVIEW
2.1     VISITORS TO PLYMOUTH

2.1.1   VISITORS TREND

        Plymouth is attracting increasing numbers of UK and overseas visitors and has grown its
        overall share of trips since 2008 from 584,000 to 755,000 in 2017 (CAGR of 2.9%). In 2014 a
        region wide drop was suffered due to regional flooding and the effects of the main rail link.
        This has not affected the overall growth trajectory, as shown in Exhibit 1.

        Exhibit 1: Visitors to Plymouth 2008-2017

        Source: Plymouth City Council - based on SWRC analysis of the Cambridge model

        Tourism day visits express the most obvious fluctuations in Exhibit 1, however, in respect to
        the promising hotel market in Plymouth, the overseas trips have increased by a continuous
        average growth rate of 4.97% since 2012. The portion of UK trips has remained stable and
        shown an increase of 36,000 visitors in the last year, with projections of momentum continuing.

        The length of tourist trips varies between markets with an average length of stay of 3.25 nights
        for UK visitors and 8.16 nights for overseas visitors (2017).

        COLLIERS INTERNATIONAL UK                                                  6 of 70
        Hotel and Other Accommodation - Supply & Demand Study
With a peak in 2013 (2,911,000), total nights have increased steadily at a continuous average
growth rate of 1.19% and 2017 saw 2,841,000 nights compared to 2,678,000 in 2012.
Exhibit 2: Nights Stayed in Plymouth 2012-2017
Source: Plymouth City Council - based on SWRC analysis of the Cambridge model
2.1.2 HOTEL DEMAND GENERATORS AND KEY VISITOR ATTRACTIONS
The following factors are key drivers of demand for visiting Plymouth:
The waterfront location of Britain’s ‘Ocean City’, with a natural harbour and rich maritime
history;
Devon and Cornwall in close proximity along with their coasts and tourist attractions;
Economic drivers located in Plymouth such as the defence, marine, medical and
engineering services, enticing business trips;
Further business trips in relation to major employers. These include public sector, NHS,
dockyard and major manufacturers;
Visits to water-related sporting events, the Theatre Royal Plymouth and Plymouth’s high-
quality restaurants;
Visiting friends and relatives that live in Plymouth with its ‘high quality of life’;
Large student population and relating visitations;
COLLIERS INTERNATIONAL UK 7 of 70
Hotel and Other Accommodation - Supply & Demand Study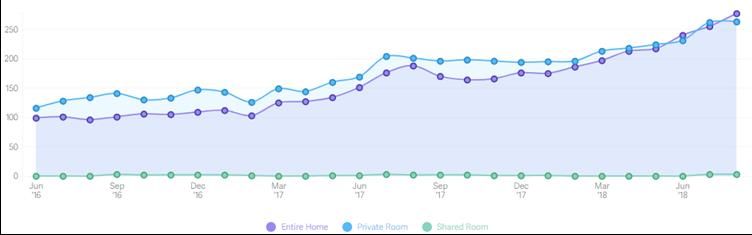
Effective destination management organisation (DMO); Destination Plymouth and
partnership actively marketing the city.
Plymouth’s future prospect and demand drivers look positive and are expected to strengthen.
Examples of future investments within the area that will have an encouraging influence on
future tourist figures can be seen in Exhibit 3 overleaf.
COLLIERS INTERNATIONAL UK 8 of 70
Hotel and Other Accommodation - Supply & Demand Study
Exhibit 3: Future Investments in Plymouth

Mayflower 400                                                                     The Box
Mayflower 400 is a programme of events on a scale of                              Located between Plymouth University and College of Art, the
international celebration and commemoration. Mayflower 400 is                     £34m project is transforming the old Museum, Art Gallery,
an international commemoration of the 400th anniversary of the                    Central Library and St Luke’s Church into a new unique and
sailing of the Mayflower in 2020. Over 25 million Americans are                   cultural attraction. The Box will be highlighted as a new History
descended from the passengers on the ship and 2020 will be a                      Centre and become a landmark in Plymouth architecture.
yearlong internationally significant programme of cultural
events and activities in Plymouth the wider UK, Holland and the
USA.

Proposed Train Station Redevelopment                                              Drake Circus Leisure Scheme
A grand-scale revamp of the Plymouth Railway Station is soon                      With works commencing at the end of 2017, the £50m
to commence to improve the entrance into Britain’s Ocean City.                    investment by British Land is creating a new leisure destination
The plans include a new ‘landmark building’, new office space,                    within the city. The development will include an 11 screen IMAX
hotel and the relocation of the multi-story carpark.                              cinema, 13 restaurants and a sky bar.

Sherford                                                                          Oceansgate
The 1,200-acre development on the Eastern outskirts of                            The Oceansgate initiative is designed to cluster marine-based
Plymouth will provide a desirable place to live and work for circa                businesses in Plymouth harbour to create a world-class hub for
12,000 residents. The project will result in 5,500 new homes                      marine industries and increase business activity within the city.
and over 80,000 m² of employment and retail space. Other                          The idea will provide a unique complex of industrial buildings
facilities include a town hall, youth centre, health centre, library,             and docks for commercial use with direct deep water access.
theatre and sports centre.

Elizabethan House
The 17th-century historic building, also Grade II-listed, is located
on 32 New Street on the Barbican. The iconic house is
undergoing a £2.3 million complete restoration before the
Mayflower 400 commemoration. The project aims to preserve
the structure and layout of the building but refreshing the interior
and making it more appropriate for the public to visit.

           Source: Visit Plymouth & PCC
           COLLIERS INTERNATIONAL UK                                    9 of 70
           Hotel and Other Accommodation - Supply & Demand Study
2.1.3   CURRENT PURPOSE OF VISIT

        Visits to Plymouth by UK tourists are currently dominated by holiday visits, with business and
        VFR (visiting friends and relatives) also very strong.

        Exhibit 4: Trips to Plymouth by Market and Purpose 2013-2017

        Source: Plymouth City Council - based on SWRC analysis of the Cambridge model

        In respect to overseas trips, VFR has been most prominent since 2013. However, 2016
        witnessed a huge spike in business-related trips. Anecdotally, we understand that some
        potential business-related guests are disappointed by the current hotel supply and quality
        within Plymouth. Consequently, some actually choose to stay outside of the city in areas such
        as Exeter or countryside located hotels.

        COLLIERS INTERNATIONAL UK                                                  10 of 70
        Hotel and Other Accommodation - Supply & Demand Study
2.1.4 VISITOR SPEND
Exhibit 5: Visitor Spend by Market and Total 2012-2016
Source: Plymouth City Council - based on SWRC analysis of the Cambridge model
Since 2012, overall levels of visitor spend have increased by £6 million. There has been no
substantial change in spend within markets.
Exhibit 6: Visitor Spend Per Day by Market 2012-2016
Source: Plymouth City Council - based on SWRC analysis of the Cambridge model
Interestingly, both UK and Overseas nights spend per day have fluctuated since 2012. The
day visit spends gradually increased year-on-year to almost reach £40 per day.
COLLIERS INTERNATIONAL UK 11 of 70
Hotel and Other Accommodation - Supply & Demand Study2.2 SEGMENTATION OF DEMAND FOR HOTELS
Plymouth benefits from a strong combination of leisure and business-related demand, with the
leisure market dominating in the peak, summer months. In this section, we provide a brief
overview of these key markets, outlining key demand drivers and profile characteristics.
It is important to note that over the last few years, Plymouth has been experiencing a shift in
the various sub-segments. We understand that Destination Plymouth is developing a 10-year
strategy with PCC that will catalyse future capital developments as well as marketing and
operational activities supported by an initial 3-year rolling business plan and marketing plan.
Part of the strategy would be to drive the overall demand in the market, including to continue
to grow overseas visitors, fully independent travellers and small groups due to their high
spending power in comparison to the UK domestic visitors.
2.2.1 THE LEISURE MARKET
The hotel market in Plymouth is susceptible to seasonal trends due to its coastal location.
Therefore, ‘Britain’s Ocean City’ experiences an uplift of 80% of guests during the peak
seasons (July and August) represented in the hotel leisure market. The leisure market in
Plymouth comprises both the group leisure and tour/coach segment, as well as independent
leisure travel. During the winter months, the seasonal demand of leisure guests falls to around
40-50% of roomnights.
It is also important to note that the leisure sector is always stronger for hotels in central
Plymouth.
GROUP LEISURE
The group leisure segment generally comprises visitors who have either purchased organised
package holidays or privately organised tours, as well as other select groups. Larger scale
tour operator rates are generally contracted annually at rather low levels but are used to help
fill lower occupancy periods. Smaller private groups of say, 10 to 20, will be contracted at
individually negotiated rates but remain subject to preferential discount and availability. Due
to the low rate of this segment, this business will be replaced (when demand timing permits)
by higher-yielding segments as market occupancy increases and the proposed hotel
establishes itself in the market.
Coach groups generally comprise of visitors who have purchased package holidays that
include the cost of travel, hotel accommodation and some provision for meals, or what is
termed an ‘inclusive tour’. Tour operator rates are generally contracted annually at rather low
levels but are used to help fill lower occupancy periods.
Over the past years, the coach tour market in Plymouth was the biggest proportion of leisure
guests in particular during the summer months. Group tour operators typically secured
package holidays roughly one year in advance and used Plymouth as a base to visit Devon
and Cornwall. This was mostly due to the lack of branded hotels in Cornwall able to
COLLIERS INTERNATIONAL UK 12 of 70
Hotel and Other Accommodation - Supply & Demand Studyaccommodate large groups. Bigger hotels like Jurys Inn and Copthorne relied equally on
coach groups, often accounting for around half of all leisure business at the hotels. Small
hotels and guesthouses do not operate within the group leisure and tour segment.
It is worth noting however, that since 2014, hoteliers in Plymouth have reduced the number of
coach tours accepted due to the low room rate the segment pays; aiming to improve the overall
hotels’ market ADR. Hoteliers and Destination Plymouth marketing activity have actively
targeted the independent leisure segment and in particular overseas travellers who tend to
pay the highest rate from all segments.
INDEPENDENT LEISURE
The independent leisure segment comprises visitors who have either purchased their trip
through an Online Travel Agents (OTAs), local agent or independently planned and booked
their trip online.
Demand from this segment is usually higher during holiday periods and the summer season,
typically peaking in August. The hotel room rate is generally discounted to attract this segment
during lower occupancy/quieter periods. This portion of the market includes weekend demand
arising from promotional packages, as well as those visiting friend and relatives, visiting
students (a large community) and people taking ferries to/from Spain and France via Plymouth
Ferryport.
Although cruise/ferry subsegment does not necessarily require accommodation, it has been
observed that ferry companies are considering Plymouth as a point of embarkation due to the
low fees that the port has in comparison to other cities such as Southampton and Dover. While
not a volume market, the passengers are considered to be high-spenders and hence require
high-end accommodation in advance.
2.2.2 THE BUSINESS MARKET AND DRIVERS
The business market in Plymouth comprises both the local corporate and transient commercial
segments and is a key source of business for hotels in Plymouth. It is a year-round segment
helping to minimise the impact of seasonality within the leisure sector (coach tours and
independent travel). It is a key source of business for hotels in the city, often accounting for
around 60-70% of demand for those not operating within the coach tour segment. Some hotels
concentrate in providing for this sector. For example, the peripheral hotels (such as the Future
Inn), generate the majority of their demand from business visitors. This characteristic can be
attributed to location, with several major employers such as the HM Land Registry and
Derriford Hospital situated on the outskirts of the city.
Demand within the segment is generated by visitors and visiting staff/colleagues to both public
and private sector companies based in and around the city, as well as travelling business
guests using Plymouth as a base or stopover en route to other destinations further afield. The
COLLIERS INTERNATIONAL UK 13 of 70
Hotel and Other Accommodation - Supply & Demand Studylatter is an important source of demand for local hotels, particularly those occupying strategic locations close to key access and arterial routes such as the A38. Key public sector demand relates to healthcare (the NHS including Derriford Hospital), education (University of Plymouth, Colleges and research bodies) and local government departments. Private sector business originates from the naval, medical, manufacturing, energy and construction industries. Some companies of note in the area include British Gas, EDF Energy and Wrigley’s. The Dockyard, naval port and other marine related industries are key overnight demand generators for local accommodation providers. For example, Babcock International and Princess Yachts are the largest private sector employers in Plymouth and both market leaders within their respective fields. Collectively employing almost 6,500 staff locally, we understand both have notable overnight accommodation requirements including long-stay corporates and/or contractors based in the city for two or three months at a time. Corporate demand is strongest Monday through to Thursday, dipping significantly on Fridays and over the weekend as opposed to the leisure market, balancing demand throughout the week. This demand is relatively constant throughout the year, with dips in July/August and December/January. Corporate demand growth is broadly correlated to GDP growth and economic market conditions. MEETINGS, CONFERENCES AND EVENTS Demand in this segment is generated first and foremost by local and regional companies holding small meetings, interviews, conferences, training sessions and seminars or away days in the defined competitive set. Those attending exhibitions, conferences and the like outside the competitive set are excluded from this segment but are taken into account as corporate/commercial clients. Room rates are often discounted for large groups. Typically, demand is higher for conferences around spring and autumn. Summer represents the slowest period and winter demand is variable. Most commercial groups require accommodation Monday to Thursday and associations and social groups have a tendency to use hotels at the weekend. On average, typical conference group length of stay is in the region of two to three nights. There has, however, been a decline in the UK residential conference market sector over recent years, largely due to economic conditions. Future demand potential is closely related to trends in growth expected in the corporate/commercial segment. Locally, we understand the conference segment of the business market is also notable, both in relation to meeting facilities at hotels and accommodation for those attending events at The Pavilions and University of Plymouth. We understand there is also reasonable demand for other functions in Plymouth (such as private parties, christenings, weddings and Christmas parties) which generates some demand for overnight accommodation. It is worth noting that COLLIERS INTERNATIONAL UK 14 of 70 Hotel and Other Accommodation - Supply & Demand Study
VisitBritain’s long-term tourism growth strategy aims to promote large events to the regional
        UK, hence this will generate future opportunities for large events in cities such as Plymouth.

2.3     SOURCE MARKETS

2.3.1   UK GUESTS

        Based on interviews with hotel General Managers (GMs) in Plymouth, the majority of guests
        staying in the city’s hotels are of UK origin. Domestic travellers visiting Plymouth for leisure
        predominantly come from locations within 1.5-2-hour travel time radius, including destinations
        such as Bristol, Bath and elsewhere in Devon. It must be noted that visits from further locations
        such as Manchester and Birmingham are still regularly recorded. Guests visiting for business
        purposes also include those originating from London, which has an approximate travel time of
        3.5 hours via train. A recent visitor survey conducted by the Destination Plymouth indicated
        that approximately 36% of the total visitor numbers to Plymouth originate from London and the
        South East of England. These visitor numbers are inclusive of overnight stays and also day
        trips, therefore incorporating all demand segments.

2.3.2   OVERSEAS GUESTS

        Guests from overseas represent a far smaller portion in the Plymouth visitor market than
        domestic guests. Sourced from both local interviews and the Office of National Statistics
        (ONS), we understand that international travellers visiting for leisure generally come from
        Europe and also from long haul destinations such as America, Australia and New Zealand.
        Visitors for business tend to be travelling from European destinations.

        ONS figures show that for overall visits (including business and leisure) in 2016, Germany was
        the most prominent country of origin with 23,000 staying visits (25% of the overseas intake)
        and boasts similar levels over the last 6 years. France has historically provided the greatest
        number of staying visits however 2016 figures dropped below their average since 2010, at 9%
        of the overseas market. In respect of long-haul visitors, Australia has seen similar trends as
        France with historic figures of 13% in 2013 but only 2% in 2016. Following Australia, there are
        also strong overseas visitor numbers originating from America at 5.5%.

        From analysing individual countries of origin, it is evident that visitors from America are
        attracted to Plymouth by historic links with the Mayflower carrying America’s ‘Founding
        Fathers’ to the New World in 1620, departing from the port. The number of American visitors
        is expected to spike in 2020 as the city celebrates the 400th anniversary of the Mayflower.

        Through the cross-channel ferry service located in Plymouth, visitors from Spain and France
        typically stay in the Millbay and The Hoe areas due to early departures and late arrivals.
        Brittany Ferries sail from Plymouth to Roscoff (in the summer months) twice a day, St Malo (in
        the winter months) every Monday and Santander every Sunday (all year round).

        COLLIERS INTERNATIONAL UK                                           15 of 70
        Hotel and Other Accommodation - Supply & Demand Study
We understand that visitors from Germany, Austria and Switzerland tend to fly to Exeter Airport on charter aircraft and travel to Plymouth by coach. The length of stay is typically around 10 days to visit the parts of Devon and Cornwall that have been made famous by the books of South- West born novelist Rosamunde Pilcher and featured on TV shows in Germany and Austria. Exhibit 7: Overseas Visitor Trips Per Destination Source: Plymouth City Council - based on SWRC analysis of the Cambridge model In comparison to the competing markets in the southwest, Plymouth experiences a greater level of overseas visitor trips per annum, growing on average from 2012, than both Exeter and North Devon. In 2017, Plymouth experienced 79,000 overseas trips in comparison to 60,000 in Exeter. It is understood that the aim of the new visitor strategy is to double their intake of overseas visitors and therefore greater increase the respective demand for hotel roomnights within the city. COLLIERS INTERNATIONAL UK 16 of 70 Hotel and Other Accommodation - Supply & Demand Study
Exhibit 8: Overseas Visitor Spend Per Annum

Source: Plymouth City Council - based on SWRC analysis of the Cambridge model

Despite receiving a higher number of overseas visitors, it does not directly correspond to the
overseas spend as Plymouth witnessed a spend of £440 per person per visit, whilst Exeter
experienced £638 per person per visit. This may be due to the level of Airbnb residences in
Plymouth causing a lower spend in the area in comparison to the ADR in hotels. With an
increase in the supply of hotels in Plymouth, the respective overseas and domestic visitor
spend will grow and the predicted upsurge in overseas visitor numbers will magnify this
improvement.

COLLIERS INTERNATIONAL UK                                                  17 of 70
Hotel and Other Accommodation - Supply & Demand Study
3     HOTEL SUPPLY AND DEMAND
      PERFORMANCE
3.1   HOTEL SUPPLY IN PLYMOUTH
      According to the AM:PM by STR Global Hotels database, Plymouth comprises a total of 30
      hotels, collectively providing 1,734 rooms. The majority of this supply is concentrated within
      the 3-star and budget sectors, which collectively account for over 80% of Plymouth’s hotel
      bedroom supply. Supply at the upper midscale and upscale level is limited, with 4-star
      properties accounting for only 14% of total supply. This includes the former 211-key Holiday
      Inn hotel near Plymouth Hoe, which was rebranded to Crowne Plaza in 2017.

      Exhibit 9: Hotel Market Structure, Plymouth

      Source: AM:PM by STR Global

      COLLIERS INTERNATIONAL UK                                        18 of 70
      Hotel and Other Accommodation - Supply & Demand Study
The following Exhibit shows the net (room) supply growth in the Plymouth hotel market
between 2013 and 2018.
Exhibit 10: Historical Net Supply Growth, Plymouth, 2013 – Present
Hotels Rooms
Open Close Net Open Close Net
2013 1 7 -6 10 487 -477
2014 0 0 0 0 0 0
2015 0 0 0 0 0 0
2016 0 1 -1 0 18 -18
2017 0 0 0 0 0 0
2018 1 0 1 14 0 14
Total 2 8 -6 24 505 -481
Source: AM:PM by STR Global
In 2013, the Plymouth market lost nearly 500 hotels rooms, including the 111-key Quality Inn
hotel, which was located on the Plymouth Hoe. This prime waterfront site now represents a
redevelopment opportunity for a new hotel scheme. In Exhibit 11 below we list the hotels that
opened or closed between 2013 and 2018.
Exhibit 11: Historical Supply
Hotel Name No. of Rooms Status Year
Strathmore House Apartments 10 Opened 2013
Astor Hotel 62 Closed 2013
Cranbourne Hotel 41 Closed 2013
Legacy Hotel 100 Closed 2013
Legacy Plymouth International Hotel 100 Closed 2013
Quality Hotel Plymouth 111 Closed 2013
Riviera Guest House 11 Closed 2013
The Astor Hotel 62 Closed 2013
Camelot Hotel 18 Closed 2016
Rooms by Bistrot Pierre 14 Opened 2018
Source: AM:PM by STR Global
COLLIERS INTERNATIONAL UK 19 of 70
Hotel and Other Accommodation - Supply & Demand StudyThe lack of new hotel supply in Plymouth is predominantly due to funding issues for
development in the city. This is also the reason for limited supply at the branded, 4-star plus
level, which in turn impacts the markets attracted and rates paid by guests.
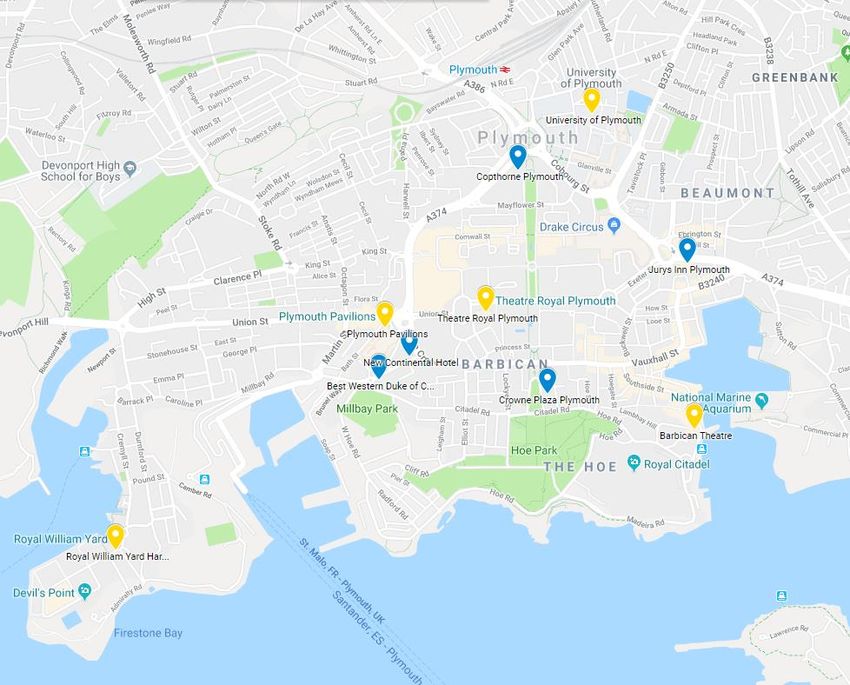
We map the location of Plymouth’s hotel supply in the Exhibit overleaf. The majority of supply
is concentrated within the city centre, with several hotels situated on the outskirts of Plymouth,
near key motorway networks and the Derriford area. There are also several properties in
Plympton, including the 5-star Boringdon Hall Hotel and Spa.
Exhibit 12: Location Map, Plymouth
City Centre Hotels
Source: AM:PM by STR Global
COLLIERS INTERNATIONAL UK 20 of 70
Hotel and Other Accommodation - Supply & Demand StudyExhibit 13: List of Supply
Marker Title Grade Rooms
1 The Beaumont Apartments Apts 2
2 Jurys Inn Plymouth 3 247
3 Copthorne Plymouth 3 135
4 Premier Inn Plymouth City Centre Sutton Harbour Budget 107
5 Premier Inn Plymouth City Centre Lockyers Quay Budget 84
6 Home Park Homestay 3 16
7 Crowne Plaza Plymouth 4 211
8 Pub On The Hoe 2 3
9 Travelodge Plymouth Hotel Budget 96
10 Imperial Hotel Plymouth 3 20
11 Drake Hotel 2 16
12 The Invicta Hotel 3 23
13 Kynance House Hotel 3 26
14 The New Continental Hotel 3 99
15 Jewells Guest House 4 11
16 The Grosvenor Hotel 3 41
17 Strathmore House Apartments Apts 10
18 Elliot Terrace Apartments Apts 8
19 Best Western Duke Of Cornwall Hotel 3 71
20 Ibis Plymouth Budget 52
21 Premier Inn Plymouth East Budget 81
22 Rooms by Bistrot Pierre 3 14
23 Drakes Wharf Apts 3
24 Future Inn Plymouth 3 143
25 Travelodge Plymouth Derriford Hotel Budget 75
26 Travelodge Plymouth Roborough Budget 40
27 Boringdon Hall Hotel & Spa 5 40
28 St Elizabeths Hotel 4 15
29 Millstones Country Hotel 3 9
30 Elfordleigh Hotel & Golf 3 36
Source: AM:PM by STR Global
COLLIERS INTERNATIONAL UK 21 of 70
Hotel and Other Accommodation - Supply & Demand Study3.1.1 BRAND PRESENTATION
The majority of Plymouth’s hotel supply is branded, providing almost 70% of total supply.
Premier Inn properties account for the largest portion of room supply, closely followed by Jurys
Inn and Travelodge.
Exhibit 14: Top Brand Representation in Plymouth
Brand Parent Company No. of Hotels No. of Rooms %
1 Premier Inn Whitbread 3 272 16%
2 Jurys Inn Leonardo Hotels 1 247 14%
3 Travelodge Travelodge 3 211 12%
4 Crowne Plaza IHG 0 211 12%
5 Copthorne M&C 1 135 8%
6 Best Western Best Western 1 71 4%
7 Ibis Accor 1 52 3%
Source: AM:PM by STR Global
COLLIERS INTERNATIONAL UK 22 of 70
Hotel and Other Accommodation - Supply & Demand StudyExhibit 15: Brand Gap Analysis, Plymouth
Opportunity
Source: AM:PM by STR Global, colliers International Analysis
It is important to note the absence of hotels in Plymouth which operate with the benefit of major
distribution systems. This includes major hotel companies such as Hilton, Marriott and Carlson
Rezidor. Furthermore, Accor only has 52 rooms in the city. It is also evident that there is a
limited supply of branded hotels at the midscale plus level in Plymouth.
COLLIERS INTERNATIONAL UK 23 of 70
Hotel and Other Accommodation - Supply & Demand Study3.1.2 BRAND RECOMMENDATION
Based on the brand gap analysis presented above as well as the hotel market characteristics
of Plymouth, we outline some potential branding solutions in Exhibit 16 (with the associated
hotel parent company) that could be attractive for the Plymouth market. The hotel brands
presented below, are well established in the UK, and we are aware that they actively seek new
opportunities to expand their portfolio of hotels.
Exhibit 16: Brand Recommendations
Brand Hotel Group Chain Scale
citizenM citizenM Hotels Upscale Chains
Maldron Dalata Hotel Group Upscale Chains
Jaz in the City Deutsche Hospitality Upscale Chains
Hampton by Hilton Hilton Hotels & Resorts Upper Midscale Chains
Hilton Garden Inn Hilton Hotels & Resorts Upscale Chains
Hyatt Place Hyatt Hotels Upscale Chains
Hotel Indigo InterContinental Hotels Group (IHG) Upper Upscale Chains
Aloft Hotels Marriott International Upscale Chains
Moxy Hotels Marriott International Upper Midscale Chains
Courtyard Marriott International Upscale Chains
Meliá Meliá Hotels International Upscale Chains
NH hotels NH Hotel Group Upscale Chains
Radisson Blu Radisson Hotel Group Upper Upscale Chains
Radisson Red Radisson Hotel Group Upper Upscale Chains
Source: Colliers International
This table is not exhaustive
Upscale
Midscale
Focused Service Full Service
COLLIERS INTERNATIONAL UK 24 of 70
Hotel and Other Accommodation - Supply & Demand Study3.2 HOTEL PERFORMANCE IN PLYMOUTH
3.2.1 THE OVERALL PLYMOUTH HOTEL MARKET
The Exhibit overleaf presents the historical and current trends in occupancy, Average Daily
Rate (ADR) and Revenue per Available Room (RevPAR) for the overall Plymouth hotel
market. This sample represents 14 hotels, collectively providing 1,250 bedrooms.
Exhibit 17: Occupancy, ADR and RevPAR Trends, 2012 – 2017 and August YTD 2018
Source: STR Global
We note the following:
The Plymouth hotel market experienced growth in occupancy levels between 2012 and 2014
(+6.4 percentage points), reaching a strong 79.7%. In subsequent years, Plymouth hotels
continued to operate at peak levels of 79-80%. The overall occupancy trend illustrates the
strength of local hotel market conditions, also highlighting an undersupplied market;
The average room rate has increased year-on-year between 2012 and 2017 at a compound
annual growth rate (“CAGR”) of 5.6%, approaching the £70 mark in 2017. 2017 ADR levels
represent an increase of a significant 40% on 2012 (+£20);
Overall, the Plymouth market has shown an upward, positive trend in RevPAR, which has
grown at a CAGR of almost 9% over the past six years, reaching £55 in 2017;
COLLIERS INTERNATIONAL UK 25 of 70
Hotel and Other Accommodation - Supply & Demand Study Year-to-date (“YTD”) performance for August 2018 indicates little movement in the
occupancy. However, the ADR continues to show improvements, increasing by 2% on the
same period in 2017.
3.2.2 THE MIDSCALE PLUS MARKET
The following Exhibits present the historical and current trends in occupancy, Average Daily
Rate (ADR) and Revenue per Available Room (RevPAR) for a sample of hotels positioned
within the full-service, midscale plus sector. This market set comprises four hotels (Copthorne
Plymouth, Crowne Plaza Plymouth, Best Western Duke of Cornwall Hotel and Jurys Inn
Plymouth), collectively providing 664 bedrooms.
ANNUAL PERFORMANCE
Exhibit 18: Occupancy, ADR and RevPAR Trends, Midscale Plus Market, 2014 – 2017 and
August YTD 2018
Source: STR Global
We note the following:
Midscale hotels in Plymouth have continuously performed well between 2014 and 2017,
with the RevPAR growing by almost £10 over the period, and reaching £53.70 in 2017;
In general, annual improvements in the rooms yield can be attributed to both occupancy
and ADR performance growth. The occupancy did dip slightly in 2017 by two percentage
points, albeit still recording a healthy 76.6%.
COLLIERS INTERNATIONAL UK 26 of 70
Hotel and Other Accommodation - Supply & Demand Study YTD performance for August 2018 indicates further improvements within the market set,
with the RevPAR increasing by 5.7% when compared to the previous period. This is
particularly positive, as the Crowne Plaza released its 80 fully refurbished rooms back into
the market in Q1 2018. This trend highlights the growing demand for good quality, branded
hotels in Plymouth.
MONTHLY TRENDS
The following Exhibits present the monthly occupancy and ADR trends for the midscale plus
market set between 2016 and August 2018.
Exhibit 19: Monthly Occupancy Trend, Midscale Plus Market, 2016 to August 2018
Source: STR Global
COLLIERS INTERNATIONAL UK 27 of 70
Hotel and Other Accommodation - Supply & Demand StudyExhibit 20: Monthly ADR Trend, Midscale Plus Market, 2016 to August 2018
Source: STR Global
We note the following:
July, August and September represent the strongest performing months for Plymouth hotels
positioned at the midscale plus level. This mirrors the overall Plymouth market trend;
2018 monthly occupancy levels were up on 2017 figures up till July. Performance for August
2018 indicates a decline on the previous year. This can be attributed to the introduction of
other accommodation offerings in the summer period, including Hashtag hotels and student
accommodation.
COLLIERS INTERNATIONAL UK 28 of 70
Hotel and Other Accommodation - Supply & Demand StudyDAY OF THE WEEK ANALYSIS
The following graph illustrates the average daily performance of the market set over a 12-
month period (September 2017 – August 2018).
Exhibit 21: Average Daily Occupancy, ADR and RevPAR Trend, Midscale Plus Market
Source: STR Global
We note the following:
Tuesdays, Wednesdays and Saturdays record the highest RevPAR levels, highlighting the
strength of both business and leisure related demand within the midscale plus hotel market
in Plymouth;
The midscale market is less price sensitive in comparison to the budget market, with
relatively stable ADR levels throughout the week (above £65 between Monday and
Saturday).
COLLIERS INTERNATIONAL UK 29 of 70
Hotel and Other Accommodation - Supply & Demand Study3.2.3 THE BUDGET MARKET
The following Exhibits present the historical and current trends in occupancy, Average Daily
Rate (ADR) and Revenue per Available Room (RevPAR) for a sample of hotels positioned
within the budget, limited-service sector. This market set comprises five hotels (Travelodge
Plymouth Hotel, Premier Inn Plymouth City Centre Lockyers Quay, Premier Inn Plymouth City
Centre Sutton Harbour, Travelodge Plymouth Derriford Hotel and Ibis Plymouth), collectively
providing 414 bedrooms.
ANNUAL PERFORMANCE
Exhibit 22: Occupancy, ADR and RevPAR Trends, Budget Market, 2014 – 2017 and August
YTD 2018
Source: STR Global
We note the following:
Budget hotels in Plymouth have been operating at full capacity over the past four years,
peaking in 2014 and 2015 with occupancy levels of 86%. Demand dipped in 2016 by 3.8
percentage points to 82.9%, before recovering in 2017 to 85.7%. This downward trend can
be partly attributed to the increase in other affordable accommodation offerings such as
Airbnb. However, demand is still strong at above 80%, highlighting an undersupplied market;
The ADR has experienced year-on-year growth between 2014 and 2017, representing a
CAGR of 5%;
YTD performance for August 2018 indicates a significant decline in the occupancy, which
dropped by 7.6 percentage points to 78.6%. This reflects the current market conditions
COLLIERS INTERNATIONAL UK 30 of 70
Hotel and Other Accommodation - Supply & Demand Studywithin the budget sector, which has been negatively impacted due to the substantial increase in other room-type supply such as student accommodation, Hashtag Hotels and Airbnb during the peak months. For example, we understand that student accommodation rooms are offered as an alternative to hotels in the summer months. MONTHLY TRENDS The following Exhibits present the monthly occupancy and ADR trends for the budget market set between 2016 and August 2018. Exhibit 23: Monthly Occupancy Trend, Budget Market, 2016 to August 2018 Source: STR Global COLLIERS INTERNATIONAL UK 31 of 70 Hotel and Other Accommodation - Supply & Demand Study
Exhibit 24: Monthly ADR Trend, Budget Market, 2016 to August 2018
Source: STR Global
We note the following:
2018 monthly occupancy levels represent a decline on 2017 performance, reinforcing the
adverse impact of alternative accommodation offerings (such as student accommodation)
during the peak season, which take away demand from the budget hotels;
Monthly ADR performance, however, generally represents an improvement on 2017 figures.
DAY OF THE WEEK ANALYSIS
The following graph illustrates the average daily performance of the market set over a 12-
month period (September 2017 – August 2018).
COLLIERS INTERNATIONAL UK 32 of 70
Hotel and Other Accommodation - Supply & Demand StudyExhibit 25: Average Daily Occupancy, ADR and RevPAR Trend, Budget Market
Source: STR Global
We note the following:
The budget sector in Plymouth records strong and stable occupancy levels throughout the
week. Only on Sunday does the occupancy dip below the 80% mark, highlighting an
undersupplied market at this level;
RevPAR levels are highest on Tuesdays, Wednesdays and Saturdays, indicating a
balanced mix of leisure and business demand.
COLLIERS INTERNATIONAL UK 33 of 70
Hotel and Other Accommodation - Supply & Demand Study3.2.4 PERFORMANCE COMPARISON
The following graphs illustrate the historical and current performance of the overall Plymouth
market against the budget and midscale plus market sets, as well as regional UK.
Exhibit 26: Occupancy Trends, Plymouth vs Regional UK
Source: STR Global
We note the following:
The overall Plymouth market has consistently recorded occupancy levels above the regional
UK between 2014 and 2017;
Whilst Plymouth budget hotels experienced growth in demand in 2017, the midscale plus
market dipped slightly;
YTD occupancy performance for August 2018 shows little movement in the Plymouth and
regional UK market. Whilst the midscale set benefitted from an uplift in occupancy, the
budget sector has suffered significantly, with a decline in occupancy by approximately 7
percentage points;
We understand that there is some anecdotal evidence, that due to the high levels of
construction in Plymouth, many contractors are staying in accommodation at the lower end
of the market or in other accommodation types (i.e. self-catering). This may have had a
knock-on effect of driving demand higher up the chain, but has certainly reduced capacity
available for other visitor types. Construction activity remains intense but this may ease over
time.
COLLIERS INTERNATIONAL UK 34 of 70
Hotel and Other Accommodation - Supply & Demand StudyExhibit 27: ADR Trends, Plymouth vs Regional UK
Source: STR Global
We note the following:
The overall Plymouth market, as well as the midscale plus set, have consistently recorded
ADR levels below regional UK over the past four years. However, this gap is getting
narrower, with Plymouth recording an ADR of £69 in 2017; only £3 lower than regional UK,
compared to a £10 differential in 2014. This highlights that Plymouth’s ADR has grown at a
faster rate than regional UK, with a CAGR of 6%, almost double that of the regional UK;
All market sets have experienced a positive ADR trend between 2014 and 2017;
YTD ADR performance for August 2018 also highlights growth in all market sets when
compared to the same period in 2017.
COLLIERS INTERNATIONAL UK 35 of 70
Hotel and Other Accommodation - Supply & Demand Study3.3 PLYMOUTH IN COMPARISON TO OTHER CITIES
Comparing Plymouth to other cities with similar characteristics is useful to understand the
performance of hotels in the city. The comparator cities selected are cities near the coast and
away from the UK’s major cities. They also either have a strong public sector employment
base or ‘economic neighbours’ in terms of their overall economy.
3.3.1 TOTAL SUPPLY
Exhibit 28: Hotel Supply Comparison (by number of hotels)
Source: AM:PM by STR Global
COLLIERS INTERNATIONAL UK 36 of 70
Hotel and Other Accommodation - Supply & Demand StudyExhibit 29: Room Supply Comparison (by number of bedrooms) Source: AM:PM by STR Global The graphs above illustrate that Plymouth has the second lowest hotel room count, after Swansea, with 1,734 keys. Plymouth’s hotel room supply is broadly on par with Exeter and Hull, but significantly lower than cities such as Cardiff, Newcastle and Southampton. Exhibit 30: Hotel Room Supply per Head of Population Source: AM:PM by STR Global, ONS Plymouth has a fairly limited hotel supply base when compared to other similarly populated cities such as Southampton. Exeter, for example, has twice as many hotel rooms per head of population. COLLIERS INTERNATIONAL UK 37 of 70 Hotel and Other Accommodation - Supply & Demand Study
Whilst the size of population is not a direct driver of hotel demand, it is a useful indicator to put
        supply in proportion to city size and significance. In the comparator set, only Hull and Swansea
        have a lower supply per head of population than Plymouth.

3.3.2   OCCUPANCY

        The following graph shows Plymouth’s occupancy performance in 2017 against the
        comparator cities, as well as the UK and regional UK.

        Exhibit 31: Hotel Occupancy Comparison, 2013 vs 2017

        Source: AM:PM by STR Global

        In 2017, Plymouth outperformed the UK and regional UK in terms of occupancy, at 79.9%.
        Plymouth also records occupancy levels either on par or above the majority of the comparator
        cities, highlighting the strength of the local market.

        COLLIERS INTERNATIONAL UK                                             38 of 70
        Hotel and Other Accommodation - Supply & Demand Study
3.3.3 AVERAGE ROOM RATE
The following graph presents the ADR performance for Plymouth and its comparator cities, as
well as the UK and regional UK in 2013 and 2017.
Exhibit 32: Hotel ADR Comparison, 2013 vs 2017
Source: AM:PM by STR Global
Plymouth significantly underperformed the UK and regional UK ADR in 2013, at £51. However,
Plymouth’s average room rate has experienced healthy growth since, and in 2017 recorded
an ADR of £68.93, just below the UK regional average of £71.90. It currently has the fourth
highest ADR amongst the sample of other cities, compared to the second lowest in 2013.
COLLIERS INTERNATIONAL UK 39 of 70
Hotel and Other Accommodation - Supply & Demand Study3.3.4 MARKET VALUE
Exhibit 33 shows the overall market value (RevPAR x number of hotel rooms x 365) for
Plymouth and its comparator cities. Newcastle is the largest hotel market within the sample,
with a market value of £127 million in 2017. Plymouth’s market value is at the lower end of the
range, estimated at £35 million. Although Plymouth achieves a higher rooms yield than
Newcastle, it has a lower supply base, and therefore a lower market value.
Exhibit 33: Plymouth vs Other Cities, Market Value, 2017
City Census - Hotels Census - Rooms Market Value (£) % Market Share* Market Value per hotel (£) RevPAR Days
Newcastle 101 7,688 £ 127,437,564 24.6% £ 1,261,758 £ 45.41 365
Cardiff 85 5,705 £ 119,000,994 23.0% £ 1,400,012 £ 57.15 365
Portsmouth 70 3,855 £ 79,322,969 15.3% £ 1,133,185 £ 56.37 365
Southampton 49 3,439 £ 70,791,488 13.7% £ 1,444,724 £ 56.40 365
Plymouth 32 1,753 £ 35,232,828 6.8% £ 1,101,026 £ 55.06 365
Exeter 33 1,631 £ 33,902,313 6.5% £ 1,027,343 £ 56.95 365
Hull 31 1,729 £ 28,990,153 5.6% £ 935,166 £ 45.94 365
Swansea 36 1,486 £ 23,599,182 4.6% £ 655,533 £ 43.51 365
Totals 437 27,286 £ 518,277,491 100% £ 1,185,990 £ 52.04 365
Regional UK+ 13,132 517,379 £10,335,214,314 £ 787,025 £ 54.73 365
UK 14,737 655,559 £17,105,384,794 £ 1,160,710 £ 71.49 365
Source: AM:PM by STR Global, Colliers International, December 2017 Figures
*Market Share is in respect to the Totals of the comparison cities
In 2017, the market value per room for the Plymouth market was £20,099. We can assume
that this is the maximum value the market can achieve per additional room. Our indicative
estimated added value for an additional of 100 rooms (based on 2017 RevPAR) is £2 million.
However, it is important to note that this is an indicative value and that the RevPAR will
COLLIERS INTERNATIONAL UK 40 of 70
Hotel and Other Accommodation - Supply & Demand Studysignificantly depend on what type of new supply will come to the market (e.g. Budget, 5-Star, etc.), inflation rates, and future demand. It should be noted that this is only capturing rooms revenue and does not include the other expenditure in the hotel on food, drink and other services – as an average this could add a further 30% to the totals shown. Moreover, there have been a number of assessments made of the multiplier effect of hotel expenditure and these suggest that an appropriate multiplier would be in the order of 1.4. This includes then expenditure locally such as taxis, restaurants, bars, visitor attractions and casual retail. Taking into account the above then we could take the £35m indicated above, add expenditure on food, drink and other services to bring this total to £50m. If we apply the 1.4 multiplier this means that the hotel sector is creating £70m locally. This could be doubled to £140m if Plymouth was able to reach the equivalent impact of, say Portsmouth. COLLIERS INTERNATIONAL UK 41 of 70 Hotel and Other Accommodation - Supply & Demand Study
3.4   FUTURE SUPPLY ANALYSIS
      There are 9 hotel proposals in the pipeline representing a potential increase of 1,161 rooms in
      the market area. Currently, only 9% of total room supply will most likely come to fruition by
      2020. The remaining of the schemes are still in early planning stages. In Exhibit 34 we list the
      hotel proposals and Exhibit 35 we illustrate their location.

      Exhibit 34: Overall Hotel Development Pipeline
                                                                          Estimated
      Marker   Hotel Name                  No. of Rooms      Grade                    Project Type
                                                                           Opening
          1    Drake’s Island                  43            5-Star            -      Construction works have not started
          2    Former Quality Hotel Site       80            4-Star           -       Construction works have not started
          3    Moxy Plymouth                   170           3-Star           -       Planning submitted
          4    Millbay Road                    126           4-Star           -       Planning submitted
          5    The Crescent                    255        3-star & Apts       -       Planning submitted for dual branded hotel
          6    Premier Inn Royal Parade        100           Budget         2019      In construction- estimated opening 2019
          7    House of Fraser Site            130           4-Star           -       Early Stages
          8    Railway Station Site            150           4-Star           -       Demolition of multi-storey car park for hotel site.
          9    Home Park                       107           3-Star           -       -
      Totals                                  1,161         9 Hotels

      Source: AM:PM by STR Global, Colliers International Research, Plymouth City council

      COLLIERS INTERNATIONAL UK                                                               42 of 70
      Hotel and Other Accommodation - Supply & Demand Study
Exhibit 35: Future Hotel Supply – Location Map
Source: AM:PM by STR Global, Colliers International
DRAKE’S ISLAND
Owned by Rotolok (Holdings);
We understand that the owners envision a high-end, luxury hotel with a fine-dining
restaurant, conference facilities and Spa;
COLLIERS INTERNATIONAL UK 43 of 70
Hotel and Other Accommodation - Supply & Demand Study We also understand that they have recently granted a license to begin repairing the island’s
jetty;
It is unlikely that the hotel will come to fruition in the near future.
FORMER QUALITY HOTEL SITE
Located aside to the north of West Hoe Park
The hotel development forms as part of a £50 million mixed-use redevelopment, comprising
an apartment block and a 4-to-5 boutique luxury hotel with 80 bedrooms;
MOXY PLYMOUTH
A lifestyle, 3-Star hotel with 170 rooms on a 5-storey building;
The hotel is part of the Millbay redevelopment, located southwest of the Plymouth Pavilions
at the former Pavilions car park;
MILLBAY ROAD
The hotel is part of a wider development that includes retail/leisure units, as well as
residential dwellings;
The site is situated adjacent to the east of King Point Marina;
We understand that construction has not begun yet.
THE CRESCENT
The hotel is located on The Crescent, next to Travelodge Plymouth Hotel;
We understand that the hotel is still at an early planning stage and it is unlikely to be
completed by 2020;
The development includes a large car park with c. 300 spaces;
PREMIER INN PLYMOUTH ROYAL PARADE
Conversion of the former Derry’s Department Store;
The hotel is part of a wider mixed-use scheme, comprising student accommodation and
retail;
The hotel is situated in the city centre on Derrys Cross Roundabout, on the north side of
Theatre Royal Plymouth;
HOUSE OF FRASER
The site is situated in the heart of Plymouth city centre on Royal Parade Road;
COLLIERS INTERNATIONAL UK 44 of 70
Hotel and Other Accommodation - Supply & Demand Study The hotel will occupy the southern half of the existing building that is currently owned by
British Land Plc and leased to House of Fraser department store;
We understand that the hotel development is still at an early stage.
RAILWAY STATION
There are plans for a £100 million redevelopment of the Plymouth railway station that will
include a hotel;
We understand that the council is in the process of securing further funding for the project
to begin construction in 2019;
The redevelopment will include the 150-bed hotel, 11,000m2 university building, the multi-
storey car park and 6,000m2 of commercial space.
HOME PARK
The hotel is part of a wider redevelopment at the Home Park football stadium; also the home
of Plymouth Argyle club since 1901;
The site is located about 3.5km north of Plymouth city centre;
We understand that there aren’t any plans yet for the hotel and that it is unlikely to come to
completion in the next few years.
FURTHER AFIELD
The data from the analysis of Air BnB usage also suggests that there may be some
opportunities for new hotel products in and around the Naval base.
We also see strong performance of the limited number of properties along the A38 Devon
Expressway as well as pockets of strong demand in Derriford.
Site opportunities become available in these areas from time to time.
3.5 OTHER DEMAND RESEARCH
Plymouth City Council has carried out a hotel business survey (January 2016) to analyse the
demand for a 4/5-star hotel offering in Plymouth. The survey was completed by 35 local
companies and the key findings are as follows:
Approximately 85% of local companies’ book hotels for visiting clients and (existing and
potential) employees;
Midweek demand for accommodation is significantly higher than weekend demand (70%
midweek, 30% weekend);
COLLIERS INTERNATIONAL UK 45 of 70
Hotel and Other Accommodation - Supply & Demand Study Approximately 65% of local companies stated a preference for a mid-market, full-service
hotel. Approximately 60% stated a preference for a 4-star hotel and 65% indicated interest
in using a new hotel facility;
The average budget for accommodation per night falls between £51 and £100;
53% of local companies expressed difficulties in securing hotel accommodation when
required, particularly in the summer months and during events such as university
graduation;
Facility preference is presented in Exhibit 36:
Exhibit 36: Facility Preference
Source: Plymouth City Council Survey, January 2016
Almost 50% of local companies require conference space in the area, with the average
meeting size ranging between 1 to 20 delegates;
Although the survey did not show significant demand for larger-scale conferences and
events from a corporate perspective, we understand from local hoteliers that there is
reasonably good demand at this level, particularly for weddings and other private functions.
Plymouth’s existing hotel supply lacks high-quality, four-star hotels. The survey points above
coupled with the Brand Analysis shown in Exhibit 15 (Section 3.1), indicate the market need
and opportunity for a new product positioned at this level. For the past five years, there has
not been any new supply; and we believe that a new hotel will be well received in the market,
particularly with high levels of unsatisfied demand experienced in the summer months and
other peak periods. A new premium hotel will also benefit Plymouth in terms of economic
development, retaining and attracting inward investment.
COLLIERS INTERNATIONAL UK 46 of 70
Hotel and Other Accommodation - Supply & Demand Study4 OTHER ACCOMMODATION
4.1 OVERVIEW OF EXISTING SUPPLY
In addition to hotels, other types of accommodation are also available in Plymouth. In Exhibit
25 below, we present the alternative types of accommodation available in Plymouth.
Exhibit 37: Other Accommodation
YoY Change YoY Change
Year 2011 2012 2013 2014 2015 2016 2017
(units) (%)
B&B (bed spaces) 718 718 718 718 718 718 1,284 566 79%
Campus (bed spaces) 2,477 2,477 2,477 2,477 2,477 2,477 2,477 - 0%
Group accommodation (bed spaces) - - - - - 80 80 - 0%
Guesthouses (bed spaces) 673 673 673 673 673 673 673 - 0%
Marinas (berths)** 1,620 1,620 1,620 1,620 1,620 1,620 1,620 - 0%
Second homes (units)* 203 222 222 222 222 222 222 - 0%
Self catering (units) 43 43 43 43 43 43 297 254 591%
Touring caravans/tents (pitches) 293 293 293 293 293 293 293 - 0%
Source: Plymouth City Council - based on SWRTB and Local Authority databases
*Based on 2011 Census
**Based on RYA data
In 2017, there has been a significant growth of other accommodation types and in particular
for the B&B and Self-Catering. In 2017, B&B grew by 79% (or 566 additional bed spaces) in
comparison to the previous year. The largest growth occurred in the Self-Catering units with
an increase of 591% (or 254 additional units). We understand that Self-Catering units include
the additional student accommodation that becomes available to the public during the peak
season as well as private houses or apartments that are available on Airbnb and other booking
platforms.
4.2 THE AIRBNB MARKET
4.2.1 SUPPLY CHARACTERISTICS
Plymouth’s Airbnb market has doubled in the last two years. Supply before 2014 was very
limited; however, subsequent years experienced rapid growth. Over the past eight years,
supply grew at a CAGR of 74%, reaching 946 active rentals in 2018.
We present the geographical distribution of Plymouth’s Airbnb supply in the following Exhibit.
It shows that the majority of Airbnb supply is concentrated within the city centre and close to
Plymouth Hoe.
In terms of the type of supply, there is a fairly equal split between entire home and private
room rentals available.
COLLIERS INTERNATIONAL UK 47 of 70
Hotel and Other Accommodation - Supply & Demand StudyYou can also read