How will the slowdown play out? - Nick Goodall Head of Research October 2021 - Financial Advice New ...

Page created by Julie Rodgers
 
CONTINUE READING
How will the slowdown play out? - Nick Goodall Head of Research October 2021 - Financial Advice New ...
How will the
slowdown play
out?
Nick Goodall
Head of Research

October 2021

1 © 2021 CoreLogic, Inc. All Rights Reserved.
How will the slowdown play out? - Nick Goodall Head of Research October 2021 - Financial Advice New ...
Today’s outline
State of the market:
• Running out of steam
• Impact of lockdown(s)
• Increased regulation
Looking ahead:
• Regional variances

2 © 2021 CoreLogic, Inc. All Rights Reserved.
How will the slowdown play out? - Nick Goodall Head of Research October 2021 - Financial Advice New ...
Property value growth has started to slow
Quarterly rate still relatively strong but easing (and annual rate will follow)

                                                                                      Change in quarterly rate of growth
             NZ House Price Index (HPI) - % change
                                                                                     August to September (selected areas)
                                                                Queenstown

                                                                   Tauranga

                                                              New Plymouth

                                                                  Wellington

                                                                Christchurch

                                                                   Auckland
                                                                                                                                       August
                                                            Palmerston North
                                                                                                                                       September
                                                                   Hamilton

                                                                    Dunedin

                                                                   Gisborne

                                                                    Rotorua

                                                                               -4%      -2%    0%        2%       4%        6%       8%         10%

                                                                                                    Green bars indicate an increase in rate of growth

                                                     Source: CoreLogic

 3 © 2021 CoreLogic, Inc. All Rights Reserved.
How will the slowdown play out? - Nick Goodall Head of Research October 2021 - Financial Advice New ...
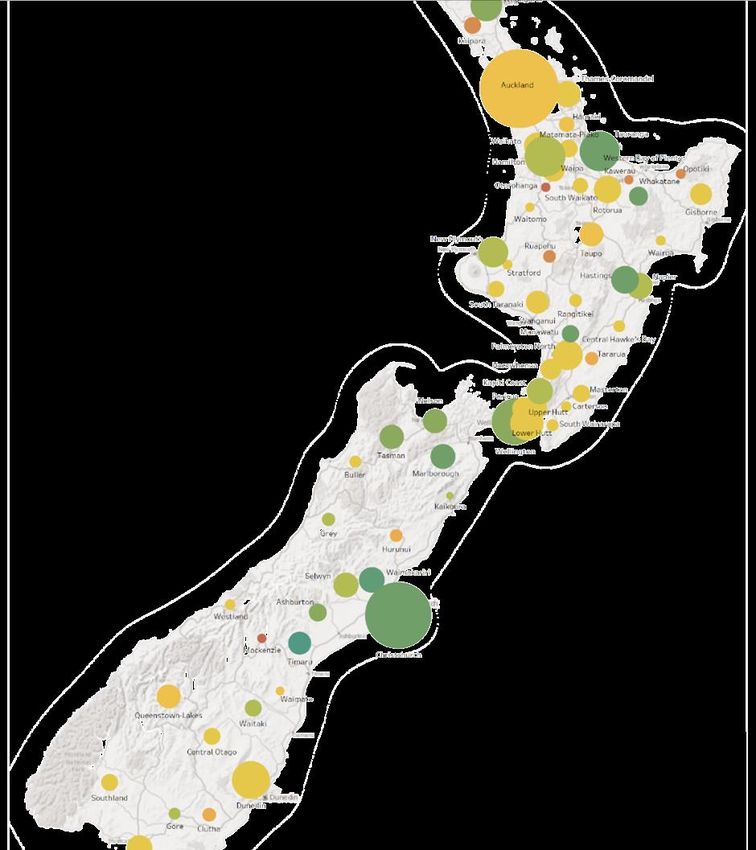
Sales volumes are settling back
Of course lockdown has distorted recent volumes, but some regions were already waning

                                   Sales volumes - NZ
                                                                            Sales volumes - Dunedin

                                                        Source: CoreLogic
 4 © 2021 CoreLogic, Inc. All Rights Reserved.
How will the slowdown play out? - Nick Goodall Head of Research October 2021 - Financial Advice New ...
Some areas remain held back by low listings
But not all, with regional variability showing up

                                                                                           Total properties listed for sale
                               Total properties listed for sale
                                                                                      Year-on-year comparison – main centres

  5 © 2021 CoreLogic, Inc. All Rights Reserved.                   Source: CoreLogic
How will the slowdown play out? - Nick Goodall Head of Research October 2021 - Financial Advice New ...
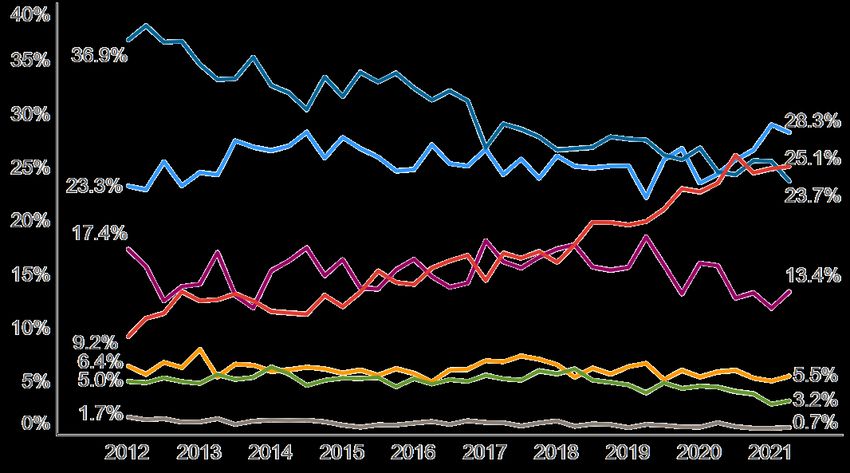
Agents are back out there appraising properties
But some listings won’t be fully recouped (didn’t happen last time either) – keeping short term pressure on prices

                                                 Rolling seven day count of agent appraisals

 6 © 2021 CoreLogic, Inc. All Rights Reserved.               Source: CoreLogic Property Guru and RPNZ
How will the slowdown play out? - Nick Goodall Head of Research October 2021 - Financial Advice New ...
With a visible sign of a lift in listings already
But entering the typically strong spring period so some way to go, especially in Auckland

                                 NZ weekly flow of new listings                       Auckland weekly flow of new listings

  7 © 2021 CoreLogic, Inc. All Rights Reserved.                   Source: CoreLogic
How will the slowdown play out? - Nick Goodall Head of Research October 2021 - Financial Advice New ...
Strong value rises = decreasing affordability
     Impact of increasing interest rates now also showing through

                                     Measures of affordability                                                       Years to save a deposit – main centres
12                                                                                       80%                                                 Auckland
                                                                                                  16
                  Years to save deposit (LHS)
                                                                                                                                             Hamilton
                                                                                         70%                                                 Tauranga
10                Share of income required for repayments (RHS)                                   14
                                                                                                                                             Wellington
                                                                                         60%                                                 Christchurch
                                                                                                  12
 8                                                                                                                                           Dunedin
                                                                                         50%
                                                                                                  10

 6                                                                                       40%
                                                                                                   8

                                                                                         30%
 4                                                                                                 6

                                                                                         20%
                                                                                                   4
 2
                                                                                         10%
                                                                                                   2
                                                                                                                                                                   More affordable
 0                                                                                       0%
                                                                                                   0
     2004      2006       2008       2010       2012     2014     2016   2018   2020
                                                                                                       2004   2006      2008   2010   2012         2014     2016    2018        2020

                                                                                       Source: CoreLogic
       8 © 2021 CoreLogic, Inc. All Rights Reserved.
How will the slowdown play out? - Nick Goodall Head of Research October 2021 - Financial Advice New ...
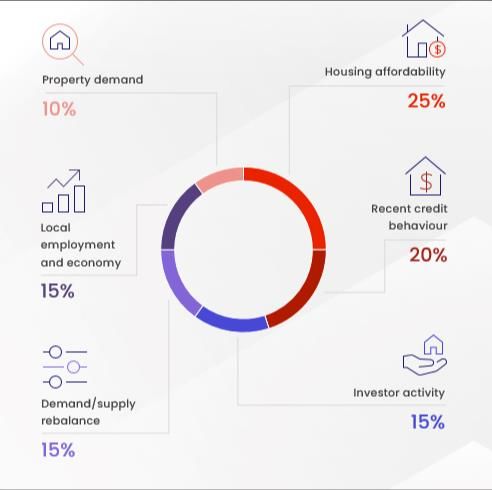
Which has lead to increased regulation
From both the Government and Reserve Bank

                                   Lending at certain LVR levels                                        Limiting interest deductibility on residential
                                                                                                                    investment property

                                                            Source: RBNZ lending data, CoreLogic Buyer Classification
 9 © 2021 CoreLogic, Inc. All Rights Reserved.
How will the slowdown play out? - Nick Goodall Head of Research October 2021 - Financial Advice New ...
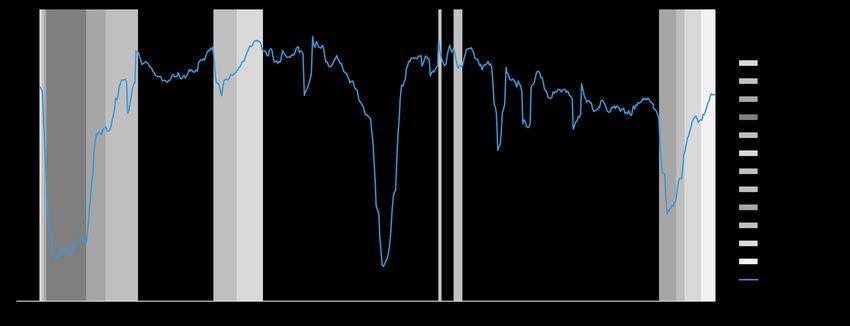
Investors pulling back from more purchases
But not ‘selling out’, and no clear evidence of jump in rental prices

                    Percentage share of purchases - NZ                                 Monthly rental prices

                                                         Source: CoreLogic, Stats NZ

 10 © 2021 CoreLogic, Inc. All Rights Reserved.
Tighter lending rules now to hit FHBs
With further competition for new build market

                                High LVR lending to FHBs                             Percentage share of purchases – new builds

 11 © 2021 CoreLogic, Inc. All Rights Reserved.
                                                           Source: RBNZ, CoreLogic
Into a market which is already close to capacity
Where costs have started to accelerate, and it may only be the beginning

 Measures of house-building costs – annual % change                                                          Measures of house-building costs – annual % change

 14%                                                                                                         14%                                                                              12,000
                                 Stats NZ output price index - resi building construction                                   Stats NZ output price index - resi building construction
 12%                                                                                                         12%                                                                              11,000
                                 CoreLogic CHIP                                                                             Quarterly dwelling consents (RHS)
                                                                                                                                                                                              10,000
 10%                                                                                                         10%
                                                                                                                                                                                              9,000
   8%                                                                                                         8%                                                                              8,000
   6%                                                                                                         6%                                                                              7,000

   4%                                                                                                         4%                                                                              6,000
                                                                                                                                                                                              5,000
   2%                                                                                                         2%
                                                                                                                                                                                              4,000
   0%                                                                                                         0%                                                                              3,000
  -2%                                                                                                        -2%                                                                              2,000
     2000     2002     2004     2006    2008      2010   2012   2014    2016     2018       2020                2000 2002 2004 2006 2008      2010    2012 2014       2016 2018        2020

                                                                                            Sources: Stats NZ, CoreLogic

 12 © 2021 CoreLogic, Inc. All Rights Reserved.
Now all about inflation and interest rates
But a major property downturn is unlikely with a strong economy and low unemployment

                            Inflation – annual % change                            OCR forecast (RBNZ August 2021)

                                                          Source: Stats NZ, RBNZ

 13 © 2021 CoreLogic, Inc. All Rights Reserved.
Reserve Bank warning of downside risks
We’re thinking slower growth not price falls, but understandable assessments of risk

                                                                                 House prices – annual % change
                                                             35

                                                             30

                                                             25
                                                                                  Annual house price inflation          Forecast
                                                             20
                                           Annual % change

                                                             15

                                                             10

                                                              5

                                                              0

                                                              -5

                                                             -10

                                                             -15
                                                                   2006   2008   2010     2012        2014       2016   2018       2020   2022   2024

  14 © 2021 CoreLogic, Inc. All Rights Reserved.
                                                                                                 Source: RBNZ
Regional
Vulnerability
Your sneak peak

The next phase of this cycle will likely be felt to
varying degrees across the country
Basic principle – where might investors sell and
others not fill the gap?
CoreLogic property data (e.g. investor presence)
Centrix credit data (e.g. mortgage arrears)
Trade Me demand data (e.g. watchlists)
Stats NZ economic data (e.g. employment growth)

15 © 2021 CoreLogic, Inc. All Rights Reserved.
A broad range of factors could
influence future performance
Increasing interest rates on their own are unlikely to cause values to markedly drop

Housing (Un)affordability                          Recent Credit Behaviour                            Financials for investors
Sustained property value growth is stretching      Credit reporting data can provide an early         Increased regulation for investors will squeeze
affordability in a number of areas, some without   indication of places where debt accumulation may   profit margins for investors. Some may want to sell
underlying population growth to justify it.        foreshadow upcoming issues for borrowers.          and others will need greater yield to remain active
                                                                                                      – who can fill the gap?
Otorohanga                                         MacKenzie
Wairoa                                             Queenstown-Lakes                                   Hamilton
                                                                                                      Opotiki

16 © 2021 CoreLogic, Inc. All Rights Reserved.
A broad range of factors could
influence future performance
Increasing interest rates on their own are unlikely to cause values to markedly drop

Demand/supply rebalance                               Local employment and economy                      Property Demand
Where property values are of have become              Recent employment growth and the diversity of a   Property view and watch list data may provide an
unaffordable sales may reduce and listings start to   local economy provide a guide to the robustness   early indication of areas where demand is drying
lift (and linger longer on the market).               to weather an external shock.                     up.

Ruapehu                                               Kawerau Paper Mill                                Stratford
Hurunui                                               Tiwai Point Aluminium Smelter                     Clutha
                                                      Taranaki Gas

17 © 2021 CoreLogic, Inc. All Rights Reserved.
Next steps
Launching to market Tuesday 12 October at
11:30am via webinar and media.

Open to anyone register at the below link

https://insight.corelogic.co.nz/property-
vulnerability-webinar

18 © 2021 CoreLogic, Inc. All Rights Reserved.
It really hasd been the year of ‘property politics’
Headwinds have strengthened, but managed slowdown more likely
                                                                                     ‘This time is different’
 Slowdown in 2021 was always likely – affordability
  ‘handbrake’, 40% deposits                                                                  April 2020         August 2021

 And now the investor tax changes and RBNZ focus                     Wage subsidies             Yes                  Yes

  on owner-occupiers just make that even more likely                 Business support           Partly                Yes

 Then we’ve also got to put rising mortgage rates                      OCR change           0.75% drop              Lift?
  into the mix – big proportionate rise from a low                 Quantitative easing      Government                No
  base (and higher average mortgages too)                                                   bond buying
                                                                      LVR restrictions       Temporarily       Tighter (Investors
 But ultimately unemployment still low, building is                                          removed            and Own/Occ)
  constrained and credit is available – different from              Mortgage deferral            Yes                  No
  GFC – so low risk of a downturn in prices, just a                   programme

  slowdown in growth                                                     Housing           8.8 years to save   10.6 years to save
                                                                       Affordability            deposit             deposit
 Admittedly, we could see a post-lockdown ‘bounce’
                                                         Source: CoreLogic
  – but it’s different from 2020
19 © 2021 CoreLogic, Inc. All Rights Reserved.
Thank you & Q+A
N ick Goodall
Nick.Goodall@corelogic.co.nz
    @NickGoodall_CL
20 © 2021 CoreLogic, Inc. All Rights Reserved.
You can also read