Hybrid Investor Presentation - August/September 2018 - Investor Relations
←
→
Page content transcription
If your browser does not render page correctly, please read the page content below
Hybrid
Investor Presentation
August/September 2018

Disclaimer
IMPORTANT INFORMATION
This investor presentation (this “Presentation") has been produced by NKT A/S (the “Issuer” or the “Company”) and its subsidiaries (together “NKT” or the “Group”) solely for use in connection with the contemplated offering of hybrid capital securities (the “Securities”) by the Issuer expected to be issued in September 2018 and may
not be reproduced or redistributed in whole or in part to any other person. The arrangers of the hybrid capital securities are Danske Bank A/S (“Danske Bank”), Nordea Bank AB (publ) (”Nordea”) and Nykredit Bank A/S (“Nykredit”), together the (“Joint Bookrunners”).This Presentation is for information purposes only and does not in
itself constitute an offer to sell or a solicitation of an offer to buy any of the Securities. By attending a meeting where this Presentation is presented, or by reading the Presentation slides, you agree to be bound by the following terms, conditions and limitations.
All information provided in this Presentation has been obtained from the Group or is publicly available material. Neither the Joint Bookrunners, the Issuer or any other member of the Group nor any of their respective parents or subsidiaries or any such company’s directors, officers, employees, advisors or representatives (collectively the
“Representatives”) shall have any liability whatsoever arising directly or indirectly from the use of this Presentation. The information contained in this Presentation has not been independently verified and neither the Joint Bookrunners, the Issuer nor any other member of the Group assume any responsibility for, nor do the Joint
Bookrunners, the Issuer or any other member of the Group make any warranty (expressly or implied) or representation as to, the accuracy, completeness or verification of the information contained in this Presentation.
This Presentation is dated August 2018. Neither the delivery of this Presentation nor any further discussions of the Group or the Joint Bookrunner with any of the recipients shall, under any circumstances, create any implication that there has been no change in the affairs of the Group since such date. The Group does not undertake any
obligation to review or confirm, or to release publicly or otherwise to investors or any other person, any revisions to the information contained in this Presentation to reflect events that occur or circumstances that arise after the date of this Presentation.
An investment in the Securities involves a high level of risk and several factors could cause the actual results or performance of the Group or the Securities to be different from what may be expressed or implied by statements contained in this Presentation. By attending a meeting where this Presentation is presented, or by reading this
Presentation, you acknowledge that you will be solely responsible for and rely on your own assessment of the market and the market position of the Group and that you will conduct your own analysis and be solely responsible for forming your own view of the potential future performance of the Group, its business and the Securities and
other securities. The content of this Presentation is not to be construed as legal, credit, business, investment or tax advice. Each recipient should consult with its own legal, credit, business, investment and tax advisers to receive legal, credit, business, investment and tax advice. Each potential investor in the Securities must determine
the suitability of that investment in light of its own circumstances. In particular, each potential investor should: 1) have sufficient knowledge and experience to make a meaningful evaluation of the Securities, the merits and risks of investing in the Securities and the information contained or incorporated by reference in this Presentation,
the Security documentation or any applicable supplement; 2) have access to, and knowledge of, appropriate analytical tools to evaluate, in the context of its particular financial situation, an investment in the Securities and the impact other securities will have on its overall investment portfolio; 3) have sufficient financial resources and
liquidity to bear all of the risks of an investment in the Securities; 4) understand thoroughly the final terms and conditions for the Securities; and 5) be able to evaluate (either alone or with the help of a financial adviser) possible scenarios for economic, interest rate and other factors that may affect its investment and its ability to bear the
relevant risks.
Neither this Presentation nor any copy of it or the information contained herein is being issued, nor may this Presentation, any copy of it or the information contained herein be distributed directly or indirectly, to or into Canada, Australia, Hong Kong, Italy, New Zealand, the Republic of South Africa, Japan, the Republic of Cyprus, the
United Kingdom or the United States (or to any U.S. person (as defined in Rule 902 of Regulation S under the Securities Act)), or to any other jurisdiction in which such distribution would be unlawful, except as set forth herein and pursuant to appropriate exemptions under the laws of any such jurisdiction. Neither the Group nor the Joint
Bookrunners or any of its Representatives have taken any actions to allow the distribution of this Presentation in any jurisdiction where any action would be required for such purposes. The distribution of this Presentation and any purchase of or application/subscription for Securities or other securities of the Group may be restricted by
law in certain jurisdictions, and persons into whose possession this Presentation comes should inform themselves about, and observe, any such restriction. Any failure to comply with such restrictions may constitute a violation of the applicable securities laws of any such jurisdiction. None of the Group or the Joint Bookrunners or any of
its Representatives shall have any liability (in negligence or otherwise) for any loss howsoever arising from any use of this Presentation or its contents or otherwise arising in connection with the Presentation. Neither the Group nor the Joint Bookrunners have authorised any offer to the public of securities, or has undertaken or plans to
undertake any action to make an offer of securities to the public requiring the publication of an offering prospectus, in any member state of the European Economic Area which has implemented the EU Prospectus Directive 2003/71/EC, as amended (the “Prospectus Directive”) and this Presentation is not a prospectus for purposes of
the Prospectus Directive.
In the event that this Presentation is distributed in the United Kingdom, it shall be directed only at persons who are either (a) "investment professionals" for the purposes of Article 19(5) of the UK Financial Services and Markets Act 2000 (Financial Promotion) Order 2005, as amended (the “Order”), (b) high net worth companies,
unincorporated associations and other persons to whom it may lawfully be communicated in accordance with Article 49(2)(a) to (d) of the Order, or (c) persons to whom an invitation or inducement to engage in investment activity (within the meaning of Section 21 of the Financial Services and Markets Act 2000) in connection with the
issue or sale of any Securities may otherwise lawfully be communicated or caused to be communicated (all such persons together being referred to as “Relevant Persons”). Any investment or investment activity to which this Presentation relates will be available only to Relevant Persons and will be engaged in only with Relevant
Persons. This Presentation is not a prospectus for the purposes of Section 85(1) of the UK Financial Services and Markets Act 2000, as amended (“FSMA”). Accordingly, this Presentation has not been approved as a prospectus by the UK Financial Services Authority (“FSA”) under Section 87A of FSMA and has not been filed with the
FSA pursuant to the UK Prospectus Rules nor has it been approved by a person authorised under FSMA.
This Presentation does not constitute or form part of an offer or solicitation to purchase or subscribe for securities in the United States. The Securities have not been and will not be registered under the U.S. Securities Act of 1933, as amended (the “Securities Act”), or with any securities regulatory authority of any state or other
jurisdiction in the United States. Accordingly, the Securities may not be offered, sold (directly or indirectly), delivered or otherwise transferred within or into the United States or to, or for the account or benefit of, U.S. Persons, absent registration or under an exemption from, or in a transaction not subject to, the registration requirements
of the Securities Act. The Securities are being offered and sold by the Joint Bookrunners only to non-US persons located outside the United States in reliance upon Regulation S under the Securities Act (“Regulation S”).
The Joint Bookrunners and/or its Representatives may hold shares, options or other securities of the Group and may, as principal or agent, buy or sell such securities. The Joint Bookrunners may have other financial interests in transactions involving these securities or the Group.
This Presentation is subject to Danish law (disregarding any conflict-of-laws rules which might refer the dispute to the laws of another jurisdiction), and any dispute arising in respect of this Presentation is subject to the exclusive jurisdiction of Danish courts with the City Court of Copenhagen as the court of first instance.
MIFID II product governance / Retail investors, professional investors and eligible counterparties target market – Solely for the purposes of each manufacturer’s product approval process, the target market assessment in respect of the Securities has led to the conclusion that: (i) the target market for the Securities is eligible
counterparties, professional clients and retail clients, each as defined in Directive 2014/65/EU (as amended, “MiFID II”); and (ii) all channels for distribution of the Securities to eligible counterparties and professional clients are appropriate and (iii) the following channels for distribution of the Securities to retail clients are appropriate -
investment advice, portfolio management, and non-advised sales or execution with appropriateness test, subject to the distributor’s (as defined below) suitability and appropriateness obligations under MiFID II, as applicable. Any person subsequently offering, selling or recommending the Securities (a “distributor”) should take into
consideration the manufacturers’ target market assessment; however, a distributor subject to MiFID II is responsible for undertaking its own target market assessment in respect of the Securities (by either adopting or refining the manufacturers’ target market assessment) and determining appropriate distribution channels, subject to the
distributor’s suitability and appropriateness obligations under MiFID II, as applicable. [The target market assessment indicates that Securities are incompatible with the needs, characteristic and objectives of clients which are fully risk averse or are seeking on-demand full repayment of the amounts invested.]
Forward Looking Statements: Certain information contained in this presentation, including any information on the Group’s plans or future financial or operating performance and other statements that express the Group’s management’s expectations or estimates of future performance, constitute forward-looking statements (when used
in this document, the words “anticipate”, “believe”, “estimate” and “expect” and similar expressions, as they relate to the Group or its management, are intended to identify forward-looking statements). Such statements are based on a number of estimates and assumptions that, while considered reasonable by management at the time,
are subject to significant business, economic and competitive uncertainties. The Group cautions that such statements involve known and unknown risks, uncertainties and other factors that may cause the actual financial results, performance or achievements of the Group to be materially different from the Group’s estimated future
results, performance or achievements expressed or implied by those forward-looking statements.
Audit Review of Financial Information: Certain financial information contained in this Presentation has not been reviewed by the Group’s auditor or any other auditor or financial expert. Hence, such financial information might not have been produced in accordance with applicable or recommended accounting principles and may
furthermore contain errors and/or miscalculations. The Group is the source of the financial information, and none of the Group or the Joint Bookrunners or any of its Representatives shall have any liability (in negligence or otherwise) for any inaccuracy of the financial information set forth in this Presentation.
ANY POTENTIAL INVESTOR INVESTING IN THE SECURITIES IS BOUND BY THE FINAL TERMS AND CONDITIONS OF THE SECURITIES WHICH THE INVESTOR ACKNOWLEDGES HAVING ACCEPTED BY SUBSCRIBING FOR SUCH SECURITIES.

                                                                                                                                                                                                                                                                                                                                                            | 2
Agenda
   1. Introduction to NKT A/S
   2. NKT
   3. NKT Photonics
   4. Financial highlights
   5. Q&A
   6. Term sheet
   7. Appendix: Income statement and balance sheet

                                                     | 3
Listed entity NKT A/S has a broad shareholder base and
consists of two businesses with leading positions
Company overview and structure                                                                                         Shareholders

                                                                                                                        Shareholder structure, end of 2017    Holders owning >5% of NKT A/S2

        Listed entity                                                  NKT A/S                                                       10%                       ▪ ATP (Denmark)
                                                                                                                                                               ▪ Kirkbi INVEST A/S
                                                                                                                                  35%        55%
                                                                                                                                                                 (Denmark)
                                                                                                                                                               ▪ Ferd A/S (Norway)
        Underlying
        businesses                                                                                                                                             ▪ Nordea Funds Ltd,
                                                                                                                                                                 Danish Branch
                                                                                                                           Registered Danish
                                                                                                                           shareholders                          (Finland)
                                  ▪ Leading supplier of alternating          ▪ A leading supplier of high-end fibre-       Registered foreign
                                    current and direct current high-           based photonic components                   shareholders
                                    voltage power cables                                                                   Non registered shareholders
                                                                             ▪ Significant growth and M&A
                                  ▪ Significant synergy potential              potential
      Key highlights              ▪ Strong market positions in selected      ▪ Proven and successful                   Experienced management team
                                    European low- and medium-voltage           commercialization strategy
                                    cables markets                                                                                        Michael                          Roland M.
                                                                                                                                          Hedegaard                        Andersen
                                                                                                                                          Lyng                             CFO
                                                                                                                                          President and                    Danish citizen
                                                                                                                                          CEO
                                                                                                                                                                           21 years of
                                            EUR 1,429m                                   EUR 51m                                          Danish citizen                   experience in
    Revenue1 (2017)                                                                                                                       22 years of                      Finance
                                              (~97%)                                      (~3%)                                           relevant industry
                                                                                                                                          experience

1 Expressed    in market prices                                                                                                                                                      | 4
2   As of 1 August 2018
NKT A/S key credit highlights

                1           Leading market position

                    2         Lean production

                        3       NKT Victoria – cable-laying vessel

                        4       Strong client base

                    5         NKT Photonics

                6           Sound financial policy

                                                                     | 5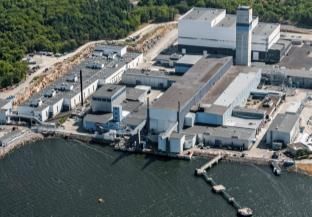
Agenda
   1. Introduction to NKT A/S
   2. NKT
   3. NKT Photonics
   4. Financial highlights
   5. Q&A
   6. Term sheet
   7. Appendix: Income statement and balance sheet

                                                     | 6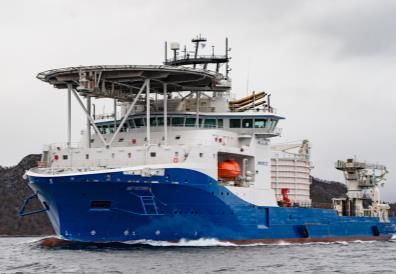
NKT: A history of innovations and acquisitions for +125 years

1891                               1960                              1995                             2010                           2013
The Dane Hans Peter Prior          NKT develops the                  Introduction of a new range of   Opening the new                 Acquisition of
founded Nordisk Elektrisk          first methods to                  PVC and halogen-free cables      state-of-the-art                Ericsson power
Ledningstråd og kabelfabrik,       recycle cable scrap               and cord to meet environmental   production plant in             cable operations,
later known as NKT                                                   and safety requirements          Cologne, Germany                Sweden

                 1922                              1986                              1999                              2011                               2017
                 NKT was the                       NKT produces the                  Acquisition of                    Introduction of                    Acquisition of
                 first company in the              world’s first 145 kV              Felten & Guilleaume               Qaddy®, a unique                   ABB HV Cables
                 world to make                     XLPE cross-linked                 Kabelwerke GmbH,                  cable drum and
                 telephone cables                  cables                            Germany                           trolley in one                     Launch of the
                                                                                                                                                          world’s first
                                                                                                                                                          tested and
                                                                                                                                                          qualified 640 DC
                                                                                                                                                          underground
                                                                                                                                                          cable

                                                                                                                                                                      | 7
NKT at a glance – positioned to support the growing need
for energy

              Leading
                                                                                                                                                              Broad power
               power                                                                                                                 ~3,500
                                                           EUR 1.4bn                                       EUR 138m                                              cable
                cable                                                                                                              employees
              producer                                                                                                                                          coverage

With strong positon in HVDC1 power                    2017 revenue (EUR 1.1bn                         2017 operational EBITDA    In 12 different countries   NKT covers most major
        cable market globally                           in std. metal prices2)                                                                                power cable sectors

                                                                                                                                  Entrenched                     Cost-
              Embrace                                                                                                                                          effective
                                                         Technological                                                             customer
              and drive                                                                                    > 125 years                                       manufacturing
                                                           leadership                                                            base for MV/LV
               change                                                                                                                                          facilities
                                                                                                                                   Products3

    Acquisition of ABB HV Cables and                    In attractively growing                    NKT looks back to more than      In more stable           Operating at the highest
     disposal of non-core operations                      Solutions business                        125 years of proud history   Applications business         technological level

                                                                                                                                                                                   | 8
1 HVDC = High-voltage direct current
2 Revenue at standard prices for copper and aluminium is set at EUR/tonne 1,550 and EUR/tonne 1,350 respectively
3 MV = Medium-voltage and LV = Low-voltage
Nordic heritage with global reach: NKT has a “glocal” mind-set
rooted in trusted partnerships

 Largest geographies by revenue (2017)                                                                   Production sites (13)
        25%                      7%                                                                      ▪   Well developed operational network with 13 sites
                                                                                                             in seven countries
        16%                      5%
                                                                                                         ▪   Sales in more than 60 countries globally in 2017
        14%                      4%
                                                                                                         ▪   Implementing a unified production approach
        12%                      3%
                                                                                                             across borders and product categories
                                                                                 Falun
                                                                   Drammen

                                         Inverness                                                       Sales offices (12)
                                                                             Alingsås
   Dallas, US                                                                                            ▪   NKT has sales offices across Europe, as well as
                                                                            Malmö
   Raleigh, US
                                                                       Asnæs
                                                                                                             in Australia and United Arab Emirates. In 2017
                                                                                        Karlskrona           offices were also established in the US
                                           Preston
                                                                  StenlilleBrøndby
                                                     Rotterdam
                                           Stone
                                                                  Nordenham
                                                                                                         Recycling plant (1)
                                                                       Berlin
                                                                                                         ▪   Unique cable scrap recycling plant
                                                                  Hettstedt
                                                                                         Knurow
                                                             Cologne                        Warszowice
                                                                 Mannheim     Kladno
                                                                                        Velke Mezirici

                                          Barcelona, Spain

                                                                                                                                                           | 9
Global megatrends supporting long-term growth
in the global cable industry

                                                           Displacement in                   3         Shift towards
      1   Green energy                              2
                                                         electricity production                    underground cables
  ▪ Legislative goals to reach Paris             ▪ Large production capacity located far   ▪ Aging grid infrastructure needs
    2015 goals worldwide                           away from consumption                     to be replaced
  ▪ Fast expansion of renewable                  ▪ Security of supply ensured by           ▪ Public pressure to use cables
    energy sources                                 connected grid                            supported by government
                                                                                             initiatives

                                                             Economic &
     4    Connected grid                            5
                                                          population growth                  6   Industry consolidation
  ▪ Rapid expansion of transnational grid        ▪ Growing world economy,                  ▪ Current cable player
    due to cost efficiency, increased grid         population expansion and                  landscape fragmented
    reliability and active trade (e.g. Europe)     urbanisation increase the demand        ▪ Further consolidation
  ▪ Legislative goals in Europe                    for modern infrastructure                 expected
                                                                                                                               | 10
Three business lines comprise a complementing mix of growth
and cash focused products and services
2017 financials Solutions Services & Accessories Applications
Revenue, EURm1 589 (~55%) 89 (~8%) 400 (~37%)
Op. EBITDA, EURm1 111 (~76%) 11 (~8%) 23 (~16%)
Margin, %1 18.8% 12.9% 5.8%
Solutions Service & Accessories Applications
POWER High-voltage High-voltage High-voltage Medium-voltage POWER 1kV cables Medium-voltage Telecom power
TRANSMISSION onshore cables offshore cables accessories accessories DISTRIBUTION cables cables
Valcap® CIS2 solutions Service & Rail wires & CONSTRUCTION Building wires Low-voltage Supporting
(turnkey) installation conductors cables solutions
Cross-functional R&D, Operations, Finance and HR functions
Attractive growth segments Cash generative
1 Management estimate, external revenue in std. metal prices
2 Cable, | 11
Installation and ServiceSolutions: Leading provider of high quality solutions to address
the growing global high-voltage markets
Capabilities NKT is a global technological leader
▪ Leading supplier of premium off- and onshore high-voltage cable systems
▪ A market leader in Offshore Wind
▪ Unmatched experience in HVDC 1st power
#1 highest Record-breaking
from shore
▪ Complete offering of design, manufacture, installation & service offering rated XLPE 320 kV HVDC
dynamic AC cable
DC cable: connection
(Gjøa –
▪ Offshore competence center and logistics center in Rotterdam 640kV (DolWin 1)
North Sea)
▪ Long lasting, close customer relationships based on reliable project execution
NKT has a complete product portfolio NKT operates a fully-integrated CIS model
C Cable System I S
Install-
Service
ation
Enginee- Produc- Project
R&D Testing
ring tion Management
Pioneer in product Collaboration with Best-in-class Industry leading Experienced team NKT Victoria, Pioneer and
& material customers on factories capable testing capabilities of highly dedicated world’s most standard setter in
HV offshore HV onshore HV offshore HV onshore development development of producing every project managers advanced cable turnkey power
process HV cable ever laying vessel cable services
DC cables DC cables AC cables AC cables produced and repairs
Dedicated teams and assets across value chain enable solid track record of executed turnkey projects
| 12Solutions: Well invested platform and among the world’s most
technologically advanced production facilities
State-of-the-art cable laying vessel
NKT Victoria
“The level of expertise “I was especially
▪ Minimized installation risk and reduced charter costs in the cable installation process
and professionalism impressed by the cable
▪ Technology: World’s most advanced cable laying vessel displayed by all those touch down monitoring
▪ Dimensions: 140 meters in length, 30 meters in width involved is recognized system”
▪ Capacity: Turntable space for 9,000 tons of cable and appreciated”
Customer Customer
Two of the world’s most technologically advanced and efficient HV production facilities
Karlskrona, Sweden
▪ Invested in significant upgrades in the past years DC AC
▪ World’s largest HV test laboratory for qualification of cable systems
built to meet 1,000kV cable requirements
▪ Own harbour with direct sea access
▪ Potential for capacity expansion
Cologne, Germany1
▪ Longest CCV line in the world allowing to produce DC2 AC
best-in-class cable lengths without joints
▪ Currently in the process of being qualified for DC cable production
▪ Inaugurated in 2010
▪ Potential for capacity expansion
1 Supported by our dedicated logistic & marine and offshore engineering centre in Rotterdam
2
| 13
Currently in the process of being qualified for DC cable productionSolutions: High-voltage order backlog with various project
segments
High-voltage order backlog of EUR 0.52bn*
at end-Q2 2018 Mix of high-voltage projects
Offshore wind Interconnectors
~50% ~50% Walney East & West 2018 Caithness Moray 2018
Borssele Alpha 2018 Nordlink 2019
Rentel 2018
Oil & Gas
Kriegers Flak 2019
Hornsea 1 2019 Johan Sverdrup 2018
Borssele Beta 2019 Martin Linge 2018
Not part of order backlog at end-Q2 2018 (estimated contract values):
Hornsea 2 (EUR +145m) 2021 Awarded on 4 July 2018
2018 2019 and onwards Triton Knoll (EUR ~115m) 2020 Preferred supplier agreement
Moray East (EUR ~130-170m) 2020 Preferred supplier agreement
High-voltage on- and offshore combined
* Market prices (EUR 0.47bn in std. metal prices)
| 14Solutions: Major trends to drive growth in pipeline
Pipeline shows major projects up to 2025 A global pipeline is prevailing
▪ Major steps are planned for the interconnector market in the next decade
▪ The offshore wind market is also showing a strong pipeline of projects
▪ Europe has historically driven the high-voltage markets, but projects are also
being developed in the US and Asia
▪ With best-in-class technology, advanced cable production plants, a specialized
DP3 cable laying vessel and being a leading provider of high quality turnkey
solutions, NKT is well positioned to take advantage of the pipeline in the wind
and interconnector markets
▪ Revenue streams for cable providers from future projects initiates years before HV project opportunities
the commissioning year
Strong fundamentals drive growth Sample of European interconnector and wind projects
Strong offshore wind demand Intercon. projects MW Year Wind projects MW Year3
Increasing windfarm demand and windfarms are being build further away from shore German HV Corridor 8,000 2025 Norfolk Vanguard 1800 2024
Biscay Gulf 2,000 2025 Borssele 1500 2021
Aquind 2,000 2020 Hornsea II 1400 2022
Onshore market stays strong
Public opinion and legislative support to increase usage of underground cabling Viking Link 1,400 2022 Hollandse Kust Zuid 1400 2023
NeuConnect 1,400 2021-23 Adlergrund 1000 2021
North Connect 1,400 2022 Moray East 950 2023
Large interconnector projects planned FAB Link 1,400 2021 Triton Knoll 860 2022
Political agenda targeting >15% interconnection capacity by 2030
1 Source:European commission; Technical document PCI 3rd list. Neuconnect: www.neuconnect.eu. SuedOstLink: www.50hertz.com
| 15
2 Based on the ENTSO-E “Ten-Year Network Development Plan” – Capex of whole Interconnector project
3 Commissioning year, source: 4c Offshore wind farms database, January 2017Solutions: NKT with a sound competitive position in the
attractive high-voltage segment
NKT and its main competitors in the HV market Key market characteristics for NKT
▪ The HV market offers an attractive growth opportunity, and NKT
has a leading market position in the HV markets following the
acquisition of ABB HV Cables
▪ The HV market has relatively few competitors
▪ In the HV segment, and particularly for DC power cables, entry
barriers are relatively high
▪ Most production sites are based in Europe and Asia
▪ The market concentration varies across product types and
voltage levels
▪ NKT has a balanced revenue split between the high-voltage and
Pro-forma revenue splits1 low- and medium-voltage segments compared to its key global
competitors, Nexans and Prysmian
▪ In the more stable low- and medium-voltage market, NKT holds
strong market positions in selected Northern and Eastern
7% European countries, but more local and regional competitors are
present in the markets
6% 16 19 ▪ Strong product portfolio and a “glocal” mind set will lead to
22
47% % % % further growth inside Europe and opportunities outside Europe
46% 78 58 for NKT
% %
HV MV / LV Other
1 NKT is 2017 number and source is 2017 annual report. Prysmian and Nexans are 2016 numbers and sources are their respective 2016 annual reports. Revenues are in market prices. | 16Applications: A leading European player in the low- and
medium-voltage segments with focus on profitable growth
Capabilities Strong European footprint
▪ Market leading position in selected European countries with limited needs for Country / Industry
investments Czech Republic
▪ Premium MV cables from 6kV to 50kV single or multi core Denmark
Market leading platform
Poland
▪ Comprehensive range of 1kV cables Germany
Growth platform
▪ High-quality, environmentally-friendly building wires – meeting regulatory Sweden
requirements for flame-retardant material France
▪ Innovative Telecom power cables serving customers globally UK
Other
▪ Enhanced delivery levels, smart packaging & ergonomic solutions
Telecom
▪ Long-term customer relationships due to technical and service reliability
Full range of MV, LV and BW products Product segments
MV cables Flexible cables Building Wires
Medium- 1kV Building Flexibles Telecom Ergonomic
Telecom power voltage cables wires power solutions
LV cables Installation cables cables cables
cables
| 17Applications: Continued opportunities for NKT in a more
stable growing market
European LV energy cable market growth NKT Applications growth expectations
▪ The LV market is mainly driven by construction activity, and the MV market is
Tonnes conductor, millions
supported by modernization of the electrical infrastructure and undergrounding of
cables
1350
▪ The market growth has been relatively stable in recent years and expected to
maintain this development in the coming years
1300 ▪ NKT has focus on profitable growth and cost efficiencies for the LV / MV part of
Applications
1250 ▪ The telecom market is preparing for growth with next-generation 5G network
▪ NKT continuing to improve its position in the telecom power cable market. This was
supported by establishment of a US office in 2017
1200
1150
LV energy estimated market growth toward 2021
1100 Actual Estimate
LV energy cables CAGR: 2012-16 2017-21
1050 Global: 2.8% 3.4%
▪ Cash generative
Europe: 0.4% 2.4%
1.14 1.15 1.17 1.21 1.24 1.27 1.30 1.33
1000
2014A 2015A 2016A 2017E 2018E 2019E 2020E 2021E
Source: CRU wire & cable report July 2017. LV Energy consumption numbers | 18Service & Accessories: Separate division created to focus &
accelerate growth
Service & Accessories Product segments
▪ Separate division created to focus & accelerate growth of both business areas and
to reap existing synergies, e.g. within training and jointing capabilities
Service
▪ Growing opportunity in offering fast repair and maintenance services on power
cables given the high costs of cable down time High-voltage High-voltage Medium- Service & Railway
▪ Pioneering Asset Management Services in the industry with a dedicated service &
accessories accessories voltage installation
installation team for on- & offshore offshore onshore accessories
▪ Strong growth potential as installed base increasing significantly & majority of
cables without service contract
Accessories Accessories product portfolio
▪ Offering a full Accessories portfolio across medium-voltage (MV), high-voltage (HV)
& extra high-voltage (EHV) Terminations Joints
▪ Continuous innovations launched to market Connects cable ends to Connects two cable ends
▪ Strong growth potential in core markets with new innovative products & expansion consumers or overhead lines
to attractive export markets
Railway
Connectors OEM busbar systems
▪ NKT is currently assessing various strategic options including a potential
divestment Connects cable ends to Connects switchgear busbar
switchgear or transformer to busbars
| 19Services & Accessories: Critical cost of down time leads to
increasing demand for cable services
Installed cable base is growing rapidly leading to a NKT service agreements with clear benefits for
growing demand for services customers
▪ Cables form small portion of windfarm CAPEX but large part of insurance pay-outs due to
Export lost production
Installed Array ▪ ‘Repair Preparedness’ service contracts offer significant benefit for our customers as down
submarine time of power cables are minimized
~7,000km
route 44%
length ~0km ~2,000km
44%
(offshore 56% 56%
44% 56%
wind)
2000 2010 2017
x
Risk of On average there are 0.5-2 faults per year
failure per 1000km cable
x 1. Engineering and documentation – where is the cable located and what is its design?
Cost of Costs of downtime for offshore windfarm can
2. Fault location – find the fault
down time reach EUR 250-300k/day
3. Mobilisation – resources, equipment and spare parts
4. Repair and jointing
5. Cable testing and deployment
Source: 4c offshore; “Offshore wind industry joins forces to reduce costs of cable failures”, DNV GL, April 2018; “Export Cable Reliability | 20
Description of Concerns”, Offshore Wind Programme Board, May 2017 (updated July 2017); “Submarine power cable losses totaling €350m
in claims”, 4c offshore quoting Genillard & Co., January 2017; Customer interviewsThe customers: NKT ensures that customers across all
product groups are at the forefront of their industries
Customer considerations: Customer group TSO & developers Utilities/ DSO Contractors Wholesalers OEMs Railway
✓ ▪ HV cables and
accessories
▪
▪
HV/MV/LV cables
Accessories
▪ HV cables
▪ MV/LV
▪ BW and LV
cables
▪ BW and LV
cables
▪ Cable
conductors
Customers with high creditworthiness ▪ System approaches ▪ Installation services cables ▪ Fire resistant ▪ Flexibles ▪ Return
Products and
▪ Installation services ▪ Monitoring services ▪ BW 1 cables cables ▪ Accessories conductors
Services
▪ Monitoring services ▪ Installation ▪ Delivery and ▪ MV
▪ On- and Offshore services Inventory mgmt. accessories
services
✓
Majority of clients in Northern Europe & UK
✓
Customers operate in a variety of sectors
Customers
✓ selection
Longstanding relationships with clients
1 Building wires
| 21With Excellence 2020, we are focusing on profitability
and targeted growth in our transformation journey
DRIVE NKT Corporate Strategy EXCELLENCE 2020
2018 2020+
2015 – 18+ III
2014/15+ II
I
‘Get fit' 'Be excellent' ‘Accelerate growth'
Reduce costs & fund the transformation Focus portfolio, including divestments Perform strategic acquisitions to scale business
(DRIVE > EUR 60m savings run rate) (Cabinets, Automotive- and China business) (ABB HV cables acquisition)
Turnaround selected businesses Realise synergies potential (ABB HV
(High-voltage onshore turnaround) Cables acquisition)
Develop profitable markets and product Introduce new products (Revitalised product
segments (Go to market and sales development)
initiatives)
Enter new markets and business models
Achieve excellence in all functions (e.g. through digitalisation)
(Operational and commercial excellence)
Main focus: Main focus: Main focus:
Cost Profitability Targeted growth
2014 2015 2016 2017 2018H1
Revenue (EURm)1 813 858 750 1,058 561
Op. EBITDA (EURm) 65 77 73 138 53
Margin, %1 8.0% 9.0% 9.7% 13.1% 9.4%
Note: Numbers are for NKT only | 22
1 Std. metal prices
Completed OngoingAgenda
1. Introduction to NKT A/S
2. NKT
3. NKT Photonics
4. Financial highlights
5. Q&A
6. Term sheet
7. Appendix: Income statement and balance sheet
| 23NKT Photonics: A leading supplier of high performance
fiber lasers and photonic crystal fibers
NKT Photonics at a glance Journey from NKT investment to commercialisation
▪ NKT Photonics is headquartered in Denmark with sales and service worldwide
1980
▪ Products include ultrafast lasers, supercontinuum white light lasers, low noise fiber lasers, NKT starts production of optical fibers
distributed temperature sensing systems and a wide range of specialty fibers
▪ NKT Photonics has expertise in precision laser-based manufacturing and life sciences and the
main markets are within imaging, sensing and material processing
▪ NKT Photonics is executing on commercialization strategy with experienced management team
2000
NKT establishes Crystal Fibre and Koheras that
would form the foundation of NKT Photonics
Production sites Selected peers
2004–2009
▪ Denmark ▪ IPG Photonics (US)
2004: Acquisition of Blaze Photonics (GB)
▪ Germany ▪ nLIGHT (US) 2005: Acquisition of LG Laser (DE)
2007: Koheras merges with NKT research
▪ Switzerland ▪ Coherent (US)
2009: Crystal Fibre and Koheras merge and
▪ UK ▪ Trumpf (Ger) become NKT Photonics
2016
LIOS technologies becomes part of NKT Photonics
Acquisition of Fianium (GB)
2017
Acquisition of Onefive (CH)
| 24NKT Photonics: Focus on the fastest growing photonics
segments
56% of revenue2 31% of revenue2 13% of revenue2
Imaging & Metrology Sensing & Energy Material processing
2015 Global Photonics Market
for Medical, Components and
systems, Measurement and
Production technology1:
Semiconductor Energy Micromachining
EUR ~ 50m EUR ~ 100m EUR ~ 275m
NKTP ~5% ~5% ~15%
Addressable Bio-imaging & Medical Security Medical
EUR 115bn market
EUR ~ 750m EUR ~ 100m EUR ~ 100m
~15% ~5% ~30%
Industrial metrology Structural monitoring R&D
EUR ~ 150m EUR ~ 150m EUR ~ 200m
~10% ~5% ~5%
NKT Photonics grows above the market CAGR of 5-7% as old technology is replaced with fiber-based systems
1 Management estimates based on Optech Consulting report for Photonics21 / EU Commission
2 | 25
Based on 2017 revenueNKT Photonics: Rising energy demands will continue to
drive growth
Growth driven by macro trends Strategic priorities
Growing and aging population Increased technological complexity
Move up in value chain Focus on organic growth LEAN operations Fast introduction of
Population to reach 8.5bn and new products
Move towards smaller technology platforms
ageing population to grow by 56% until 2030¹ Expand from supply of Actively pursue growth Scalable manufacturing Continued introduction of
components to complete opportunities within core Commercial excellence new products and
optical systems organically and through technologies to meet
partnerships customers’ needs
Resource pressure on environment
Increased health care costs
Smaller structures
Increased demand for optical sensing and monitoring to
Transformation of manufacturing towards
optimize use of energy and infrastructure.
more precise ultrafast lasers for
Faster and cheaper medical instrumentation for mass
measurements and processing
screening, diagnostics and treatment based on lasers
Revenue, EURm EBITDA, EURm
Operational EBITDA margin, %
62.2 14.7%
50.9 9.6%
7.2% 6.3 6.9% 7.1%
40.6 43.1
39.1 2.3%
35.7
3.7 3.5 4.4
2.9
0.9
2013 2014 2015 2016 2017 2018H1 LTM 2013 2014 2015 2016 2017 2018H1 LTM
The need for speed and precision, coupled with rising energy demands at a lower cost will continue to drive growth of the photonics industry for the foreseeable future
1 Source: United nations – Department of Economic and Social Affairs
| 26Agenda
1. Introduction to NKT A/S
2. NKT
3. NKT Photonics
4. Financial highlights
5. Q&A
6. Term sheet
7. Appendix: Income statement and balance sheet
| 27NKT A/S: Steady growth in group profitability
Revenue, EURm1 Revenue and organic growth 2016-20171 Comments
NKT A/S 2016 revenue 793
- NKT Photonics 2016 revenue 43
▪ Revenue development in recent
NKT 2016 revenue 750 years impacted by the recent
NKT
Currency effect -6 org. growth
acquisition and disposals of
Acquisitions2 307 7% non-core assets
Divestments -60
NKT 2016 adjusted revenue 992 ▪ From 2016 to 2017:
1,207
1,108 Org. Growth 66
843 852 898
793 Org. Growth excl. acquisitions -30 NKT Photonics ▪ ABB HV Cables was
org. growth acquired
Org. Growth ABB HV Cables2 97
7%
NKT 2017 revenue 1,058 ▪ Non-core activities
NKT Photonics 2017 revenue 51 (Automotive, Chinese
2013 2014 2015 2016 2017 2018H1 LTM business, and Cabinets)
NKT A/S 2017 revenue3 1,108
were divested
Operational EBITDA, EURm Margin EBITDA benchmark vs peers4 ▪ The acquired activities
delivered robust organic
14.0% Operational EBITDA margin 1 12.8% 14.0% growth
11.1%
12.0% 12.0% ▪ Consistent improvement of
9.4% profitability through cost and
10.0% 8.6% 10.0% NKT
7.4% Prysmian efficiency initiatives, as well as
8.0% 8.0%
disposal of non-core or
6.0% 4.9% 142 6.0% Nexans
135 unprofitable segments
4.0% 4.0%
63
77 75 ▪ Consolidation of ABB HV
2.0% 42 2.0% Cables positively impacted
0.0% 0.0% margin in 2017
2013 2014 2015 2016 2017 2018H1 LTM 2013 2014 2015 2016 2017
1 Based on std. metal prices | 28
2 Based on pro forma revenue
3 Including intersegment transactions of EUR -0.5m
4 Source: Companies’ annual reports. Market prices. NKT and Prysmian are calculated as EBITDA / revenue. Nexans calculated as EBITDA (Operating margin before depreciation and amortization) / revenue.NKT A/S: Improving group working capital development
Working capital 2016-2018, EURm1 Reduced level of working capital
▪ Over the past years, NKT A/S has been reducing its working
15.0% Working capital Working capital, % of revenue LTM 200
capital driven by focused efforts and impact of acquisitions
12.0% and divestments
12.1%
12.5%
11.1%
9.8%
150 ▪ Working capital was at an extraordinary low level at the end
10.0% of 2017 driven by Solutions in NKT
7.2%
▪ The Solutions business line will be the main driver for the
7.5% 100
working capital level depending on the timing of project
4.4% milestone payments
5.0%
50
1.8%
2.5%
112
125
105
76
48
37
-0.9%
0.0% 0
-14
-23
-21
-0.4%
-84
-2.5% -1.2%
-50
-5.0%
-7.5% -100
Q1 Q2 Q3 Q4 Q1 Q2 Q3 Q4 Q1 Q2
2016 2017 2018
1 Onlyincluding NKT and NKT Photonics business divisions.
| 29
Note: Working capital ratio calculated as average working capital as a percentage of revenues LTMNKT A/S: Cash flow overview
Cash flow statement1 Comments
EURm 2016H1 2016FY 2017H1 2017FY 2018Q1 2018Q2 ▪ Cash flow from operating activities was negatively
EBITDA, continuing and discontinued operations 86.7 124.7 103.7 180.1 15.8 25.6
impacted by the increase in working capital during
Q1 2018 from the extraordinarily low level at end-
Changes in working capital -47.3 57.6 -90.4 -23.7 -134.9 19.5
2017
Other non-cash operating items -15.7 -9.2 -22.6 -11.8 -10.4 -7.4
▪ The free cash flow development was positive in Q2
Financial items, net -4.1 -4.4 -12.3 -24.7 -2.3 -1.3
2018, driven by the earnings contribution, the
Income tax paid - -14.8 - -32.1 - -
working capital improvement and low investing
Cash flow from operating activities 19.6 153.9 -21.6 87.8 -131.8 36.4 activities
Acquisition of businesses -53.0 -53.3 -785.1 -800.8 - -
▪ In 2017, the free cash flow was impacted by the
Divestment of business - -3.0 23.8 33.0 - - acquisition of ABB HV Cables. During 1st half 2018,
Nilfisk demerger - - - 368.7 - - NKT has not conducted any acquisitions or
Investments in property, plant and equipment -18.3 -40.7 -28.6 -50.6 -4.9 -4.8 divestments
Disposal of property, plant and equipment 1.4 3.5 1.1 0.2 - -0.1
Intangible assets and other investments, net -17.9 -38.5 -21.9 -43.8 -4.7 -8.5
Cash flow from investing activities -87.8 -132.0 -810.7 -493.3 -9.6 -13.4
Free cash flow -68.2 21.9 -832.3 -405.5 -141.4 23.0
Cash flow from financing actitivies 42.0 78.9 725.5 293.6 126.6 -41.0
Net cash flow for the year -26.2 100.8 -106.8 -111.9 -14.8 -18.0
Cash at bank and in hand, beginning of period 58.3 58.3 158.1 158.1 44.7 30.0
Currency adjustments -1.0 -1.0 -1.0 -1.5 0.1 -0.3
Net cash flow for the year -26.2 100.8 -106.8 -111.9 -14.8 -18.0
Cash at bank and in hand, end of period 31.1 158.1 50.3 44.7 30.0 11.7
1 Nilfisk is part of cash flow statements in 2017 and before
| 30The EUR 150m Hybrid issue will strengthen NKT A/S’ balance sheet
Comments Capital structure, EURm NIBD, EURm
▪ Following the issuance
of the hybrid security a 293 410
260
new committed EUR -68
300m revolving credit
facility with a 4-year 2016 2017 H1/2018 PF H1/2018
maturity will come into
force
▪ In total, the new NIBD / Operational EBITDA
financing structure will
replace all existing 3.0x
1.9x 1.9x
committed bank
-0.4x
facilities, and will
conclude the
Capitalisation, EURm
2016 2017 H1/2018 PF H1/2018
company’s current
Reported Pro-forma
refinancing process
30 June 2018 30 June 20181
Interest-bearing loans -422 -272
Solvency ratio %
Cash 12 12
Net interest bearing debt -410 -260
54% 48%
Leverage 3.0x 1.9x 43% 40%
Equity excl. the hybrid 767 767
Hybrid - 150 2016 2017 H1/2018 PF H1/2018
Total equity 767 917
1 Source:Pro-forma numbers are based on the assumption that the Hybrid bond of EUR 150m would have been issued at 30 June 2018
2 For | 31
the 2017 leverage ratio, pro-forma EBITDA of EUR 13m for the acquired ABB HV Cables activities have been added to LTM EBITDA in the 2 month period when NKT was not the owner of ABB HV Cables. The pro-forma
EBITDA is based on ABB HV Cables’ estimated average annual pro-forma EBITDA of EUR 79m for 2014-2016
3 EBITDA is measured on a LTM basisNKT A/S key credit highlights
1 2 3 4 5 6
Leading
Lean production NKT Victoria Strong client base NKT Photonics Sound financial policy
market position
▪ Attractive market ▪ Among the world’s most ▪ NKT Victoria, the ▪ Good service and high ▪ Leading supplier of ▪ Ambition to return to the
potential in the HV technologically worlds most quality delivered high performance fiber leverage target of
segment advanced and efficient technologically secures long standing lasers, fiber optic approx. 1.5x1
▪ Leading provider of production facilities advanced cable lying customer systems and photonic ▪ Conservative dividend
solutions to the growing ▪ Scalable cost-effective vessel relationships crystal fibers policy with no
global HV markets manufacturing facilities ▪ Minimizing installation ▪ Customers with high ▪ Expertise in precision dividends until leverage
▪ Leading European and world-class risk and charter costs creditworthiness laser-based is reduced
player in the LV/MV turnkey capabilities ▪ Securing safe and ▪ The customers operate manufacturing and life ▪ Metal prices hedged
segment with focus on ▪ Implementation of efficient operations in a variety of sectors sciences through contract terms
profitable growth standardized production and improved execution ▪ Active in the fastest or financial derivatives
▪ Well positioned in some approach across reliability growing segments in
of the most profitable borders and product the global photonics
segments within the categories enabling industry
cable industry growth and expansion ▪ In 1st half on 2018,
organic growth was
22%
1 NIBD/Operational EBITDA
| 32Agenda
1. Introduction to NKT A/S
2. NKT
3. NKT Photonics
4. Financial highlights
5. Q&A
6. Term sheet
7. Appendix: Income statement and balance sheet
| 33Agenda
1. Introduction to NKT A/S
2. NKT
3. NKT Photonics
4. Financial highlights
5. Q&A
6. Term sheet
7. Appendix: Income statement and balance sheet
| 34Key Terms & Conditions for the Hybrid Notes
Issuer: ▪ NKT A/S
Country: ▪ Denmark
Rating: ▪ Unrated
Size: ▪ EUR 150m expected
Maturity: ▪ 1,000 years (non call 4 years)
Status: ▪ Deeply subordinated. Senior only to ordinary shares
Call Schedule: ▪ After 4 years and every Interest Payment Date thereafter
Step-up: ▪ 500 bps after 4 years
▪ Fixed, annually in arrears (act/act). From the First Call Date the interest rate resets every 4 years to the then prevailing 4-year EUR swap rate plus the initial credit
Interest rate:
spread plus step-up
Interest Deferral ▪ At the issuer’s option on any interest payment date. Cumulative interest deferrals
Compulsory Payment Event: ▪ Mandatory payment of deferred interest upon payment of dividends to shareholders or parity instrument or share or parity instrument repurchase
▪ Issuer call option if Change of Control Event @ 101% prior to the First Call Date / @ 100% on or after the First Call Date. Coupon step-up 500bps if the securities
Change of Control:
are not redeemed in full
Other call provisions: ▪ Tax Event (coupon and withholding tax), Accounting Event, Replacing Capital Event (call @ 103% with net proceeds from an equity issue)
Clean-up Call: ▪ At repurchases equal to or greater than 80%
Docs: ▪ Standalone documentation, Danish law
Denomination: ▪ Wholesale denominations (EUR 100k + 1k)
Clearing: ▪ VP Securities A/S
Listing: ▪ Nasdaq OMX, on or about the issue date
Use of Proceeds: ▪ Refinancing of certain outstanding indebtedness and general corporate purposes
Structuring Advisor: ▪ Nordea
Joint Books: ▪ Danske Bank, Nordea, Nykredit
▪ Eligible counterparties, professional clients and certain retail investors (contact Bookrunners for full target market assessment)
Target market:
▪ A PRIIPs KID in English and Danish language will be prepared and made available
| 35Agenda
1. Introduction to NKT A/S
2. NKT
3. NKT Photonics
4. Financial highlights
5. Q&A
6. Term sheet
7. Appendix: Income statement and balance sheet
| 36NKT A/S: Income statement and balance sheet
Income statement Balance sheet
Income Statement, EURm 2016H1 2016FY 2017H1 2017FY 2018H1 Balance Sheet 2016H1 2016FY 2017H1 2017FY 2018H1
Revenue 506.9 1,046.1 682.8 1,479.3 788.2 Intangible assets 373.5 73.5 574.1 597.4 571.9
Revenue in std. metal prices 379.5 792.8 492.0 1,108.4 590.9 Property, plant and equipment 359.3 272.8 720.8 698.9 656.2
Operational EBITDA 31.5 74.9 59.3 141.8 52.0 Other non-current assets 85.8 36.0 49.6 51.9 57.8
One-off items -4.5 -47.0 -19.7 -44.9 -10.6 Total non current assets 818.6 382.3 1,344.5 1,348.2 1,285.9
EBITDA 27.0 27.9 39.6 96.9 41.4 Inventories 393.4 142.1 225.9 226.1 245.7
Depreciation and impairment of PP&E -16.8 -33.0 -25.4 -61.3 -32.4 Receivables incl. Tax 544.1 209.2 356.5 285.6 383.1
Amortisation and impairment of intangibles -3.9 -8.6 -5.8 -18.3 -10.3 Cash at bank and in hand 31.1 127.8 30.6 44.7 11.7
EBIT 6.3 -13.7 8.4 17.3 -1.3 Assets held for sale / distribution to owners - 885.7 851.5 - -
Financial items, net 2.9 5.7 -7.9 -14.7 -3.6 Total current assets 968.6 1,364.8 1,464.5 556.4 640.5
EBT 9.2 -8.0 0.5 2.6 -4.9 Total assets 1,787.2 1,747.1 2,809.0 1,904.6 1,926.4
Tax -3.3 -9.5 1.6 -6.0 1.6
Profit, continued operations 5.9 -17.5 2.1 -3.4 -3.3 Equity 801.7 951.4 982.2 816.3 767.2
Profit, discontinued operations 24.9 29.6 43.0 932.2 - Total equity 801.7 951.4 982.2 816.3 767.2
Profit 30.8 12.1 45.1 928.8 -3.3 Deferred tax 39.3 8.0 51.2 59.9 56.3
Pension liabilities 54.7 53.1 53.2 52.5 52.8
Provisions 18.9 12.8 22.6 28.5 23.0
Financial ratios 2016H1 2016FY 2017H1 2017FY 2018H1 Interest bearing loans and borrowings 212.5 83.0 773.8 332.8 414.0
Operational EBITDA margin, std. metal prices 8.3% 9.4% 12.1% 12.8% 8.8% Non-current liabilities 325.4 156.9 900.8 473.7 546.1
Return on capital employed RoCE 9.3% 11.7% 12.8% 11.8% 4.8% Interest bearing loans and borrowings 16.3 10.5 27.4 7.2 7.3
Solvency Ratio 45.0% 54.0% 35.0% 43.0% 40.0% Trade payables, other liabilities and tax 643.8 280.8 605.5 593.9 591.4
Provisions - 15.8 - 13.5 14.4
Liabilities held for sale / distribution to owners - 331.7 293.1 - -
Current liabilities 660.1 638.8 926.0 614.6 613.1
Total equity and liabilities 1,787.2 1,747.1 2,809.0 1,904.6 1,926.4
Source: 2016 and 2017 Annual report and H1 2018 report
| 37You can also read