Hydrology & Groundwater Resources 2020-2021
←
→
Page content transcription
If your browser does not render page correctly, please read the page content below

Hydrology & Groundwater
                    Resources      2020-2021
                                             Fourteenth Edition

District & Aquifer Information
Aquifer Recharge
Annual Groundwater Production
Groundwater Production & G.A.M. Comparison
Water Table Levels & Declines
Water Quality Analyses
Average Depth to Water Maps
Average Groundwater Decline Maps
Average Saturated Thickness Maps

                                       -1-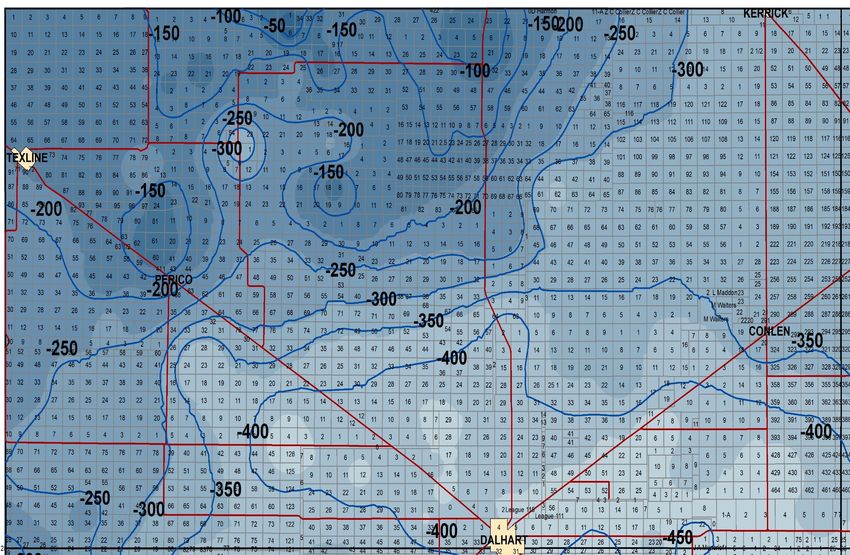
-2-
North Plains Groundwater Conservation District
                                    Mail: P.O. Box 795
                                   603 East First Street
                                   Dumas Texas 79029

                           Office Ph. 806-935-6401, Fax 806-935-6633
                                                        Publication Year 2021

Table of Contents

I. Introduction ............................................................................................................................. - 5 -
II. Definitions .............................................................................................................................. - 5 -
III. District Boundaries.................................................................................................................-6-
IV. General Geology and Hydrology .......................................................................................... - 7 -
V. Aquifer Thickness or Saturated Material ............................................................................... - 7 -
VI. Aquifer Recharge, Inflows and Outflows ............................................................................. - 8 -
VII. Annual Groundwater Production and Modeled Available Groundwater ............................ - 9 -
VIII. Depth to Water, Average Declines Based on Groundwater Production and Declines
Observed in District Monitor Wells .......................................................................................... - 15 -
IX Active Production Wells within the District ........................................................................ - 17 -
X. District Monitor Wells ......................................................................................................... - 17 -
XI. District Monitor Well Locations and On-line Interactive Maps ......................................... - 18 -
XII. Water Quality .................................................................................................................... - 19 -
XIII. Depth to Water from Land Surface .................................................................................. - 21 -
XIV. Declines (in Monitor Wells) by County .......................................................................... - 31 -
XV. Estimated (Average) Saturated Thickness of the Ogallala Aquifer by County ................ - 41 -
XVI. Contributors to Hydrology and Groundwater Resources ................................................ - 51 -

Disclaimer: This document is a general information report about the regional hydrology and
groundwater resources within the North Plains Groundwater Conservation District. The
groundwater resources or hydrological properties of any property can and do vary significantly
from those indicated by, or what might be inferred from this document. This document and the
information contained within is provided on an “as is” basis. Neither the District Board of
Directors nor District Staff make any claims or warranties as to this document’s suitability for any
use public or private.

                                                                      -3-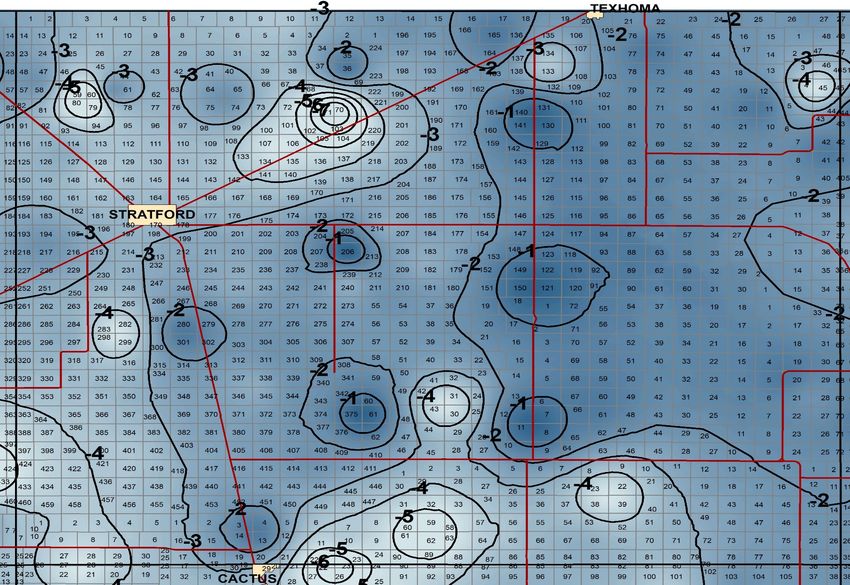
-4-
I. Introduction
The North Plains Groundwater Conservation District (NPGCD or District) manages groundwater
resources in all or part of eight counties in the Northern Texas Panhandle and is governed by an
elected seven-member Board of Directors. The Board established the District’s mission,
“maintaining our way of life through conservation, protection, and preservation of our
groundwater resources” and achieves this mission through the development of long-range
management plans, creating and enforcing rules, being actively involved in regional and state
water planning, undertaking conservation demonstrations projects, and providing public outreach
and education programs.

To further advance its management strategies the District promotes new conservation management
methods and technologies, cooperates with private, corporate and government entities to promote
the conservation, protection, and preservation of the area’s critically important groundwater
resources. The District manages and operates information collection programs, undertakes
scientific investigations, and offers well GPM testing and water quality analysis services as part
of its on-going efforts to monitor aquifer conditions.

Information collected by the District and other agencies is broadly summarized in this “Hydrology
and Groundwater Resources” report. District’s staff prepared maps for this report showing the
District boundaries, estimated depth to water, estimated average annual water level declines,
estimated aquifer saturated thickness and maps showing District monitor well locations. This
report summarizes the number of active and inactive wells, the number of new wells drilled,
measured annual groundwater production, and provides a broad overview of general water quality.

II. Definitions
Cretaceous- A geological period corresponding to 65-144 million years ago.
DFC- (Desired Future Condition) a goal set by the District Board of Directors specifying the
condition that an Aquifer will be in at a specified time in the future.
GAM- (Groundwater Availability Model) a predictive numerical computer model of Aquifers
that the Texas Water Development Board maintains and operates.
Heterogeneous- Consisting of dissimilar elements or parts; not homogeneous.
Jurassic- A geological period corresponding to 144-208 million years ago.
Inter-formational Flow- A flow of water from one formation into another formation.
Intra-formational Flow- A flow of water from one part of a formation into another part of the
same formation.
MAG- (Managed Available Groundwater) a groundwater volume results of a GAM based on
specified DFC’s.
Permian- A geological period corresponding to 245-286 million years ago.
Pliocene- A geological period corresponding to 2.5 to 5.3 million years before the present.
Recharge- The process whereby water is added to an aquifer either through natural or artificial
means. Recharge normally refers to rainfall infiltrating an aquifer through a recharge zone.
                                               -5-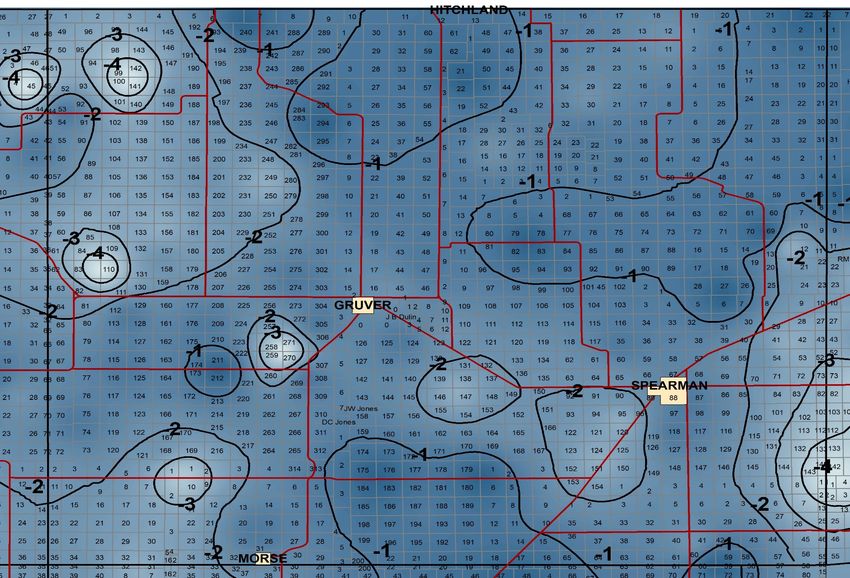
Red-Bed- a geological strata consisting primarily of red to orange clays and silts in place below
the base of the Ogallala Aquifer.
Saturated Thickness - The distance from the top of an aquifer to the base of the aquifer where
the pore spaces are filled with water.
Triassic- A geological period corresponding to 208-245 million years ago.
Unconformably (Unconformity) - the surface between successive strata representing a missing
interval in the geologic time record.

III. District Boundaries
The North Plains Groundwater Conservation District is in the Texas Panhandle, north of the city
of Amarillo and North of the Canadian River. The District consists of approximately 7,390 square
miles which includes all of Dallam, Hansford, Lipscomb, Ochiltree and Sherman counties, as well
as part of Hartley, Hutchinson and Moore counties.

The original (1954/1955) area of the District included part of Hartley, Moore and Hutchinson
counties and all of Sherman, Hansford and Ochiltree counties. Other areas have annexed into the
District over time.

Map 1: District boundaries including areas that annexed into the District over time.

Table 1: County area and percent of each county within the NPGCD.
   County        County       Estimated Area        Approximate           Percent of County in
               Area (Sq.      in District (Sq.    Number of Acres             the District
                  Mi.)               Mi.)
 Dallam           1505               1505             963,200                    100 %
 Hansford          907                907             580,480                    100 %
 Hartley          1463               1244             796,160                   83.56 %
 Hutchinson        894                278             177,920                   30.55 %
 Lipscomb          934                934             597,760                    100 %
 Moore             914                699             447,360                   76.51 %
 Ochiltree         907                907             580,480                    100 %
 Sherman           916                916             586,240                    100 %
 Totals       8440 Sq. Mi. 7390 Sq. Mi.           4,729,600 Acres

                                               -6-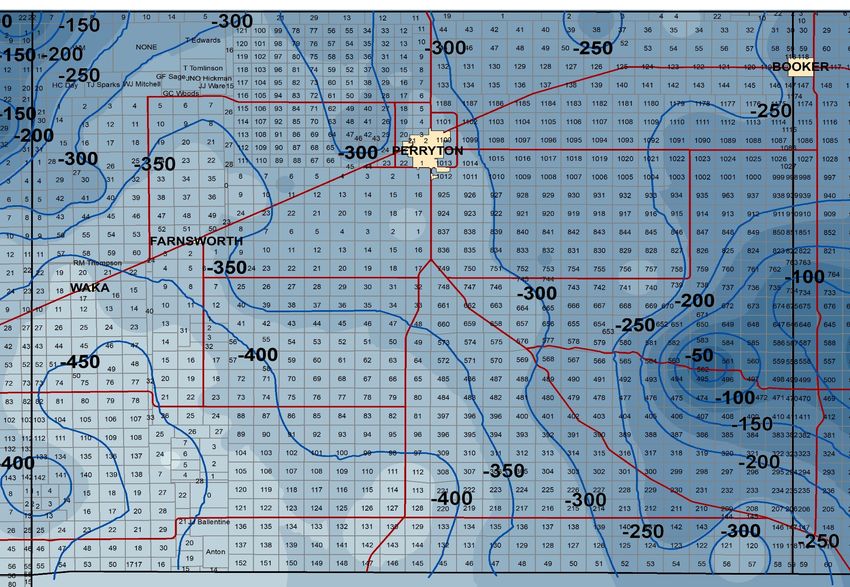
IV. General Geology and Hydrology
Ogallala Aquifer
The Ogallala Aquifer extends from the northern United States into the Texas Panhandle and West
Texas and is the primary source of water within the District. The aquifer consists of sands, gravel,
silts, and clay sediments that were deposited as part of ancient river systems from about three
million to about six million years ago during the Neogene geologic period. An ancient land surface
separates the Ogallala from much older strata below of the Permian, Triassic, Jurassic, and
Cretaceous geologic periods which range in age from 65 million years to 286 million years. This
ancient land surface is called an unconformity and represents between six million years and 65
million years of missing geologic strata in the area.

South of the District, the Canadian River has totally or partially eroded through the Ogallala along
much of its length and separates the North Plains from the South Plains. Water-bearing units of
Cretaceous and Jurassic ages combine to form the Rita Blanca (a minor aquifer) in the western
part of Dallam and Hartley counties. Underlying these aquifers and much of the Ogallala are
Triassic age (Dockum Aquifer) sediments and Red Bed strata. The Dockum is a minor, confined
to semi-confined aquifer located under Dallam, Hartley and far western Sherman and Moore
counties. The water bearing strata is generally locally referred to as the Santa Rosa. For this
document, the Ogallala Aquifer is considered to consist of the Ogallala formation and any
underlying, potable water-bearing geologic units hydraulically connected with it.

Red Bed (Base of the Aquifer)
Throughout much of the District, the Ogallala aquifer is underlain by “Red Bed”. The geology
consists of mixed deposits of reddish to orange clay, sands and gravel. The reddish color is caused
by staining from the oxides of iron containing minerals. In some areas, the red bed may be absent
and in other areas may be several hundred feet thick.

V. Aquifer Thickness or Saturated Material
Saturated thickness maps depict the vertical distance from the water level to the bottom of the
aquifer. The saturated thickness of the Ogallala Aquifer ranges from less than 10 feet to over 300
feet and has an estimated average thickness (Table 2) of 148 feet. Saturated thicknesses are
calculated every other year and use data from District monitor wells. Other calculation methods
will give differing results.

Table 2: 2020-2021 Estimated average aquifer thickness by county (District Area only).
 Dallam      Hartley     Sherman      Moore     Hansford      Hutchinson Ochiltree Lipscomb

  164 ft.    132 ft.       140 ft.    118 ft.     163 ft.        128 ft.       137 ft.    218 ft.
Next scheduled update: Summer of 2023.

                                                 -7-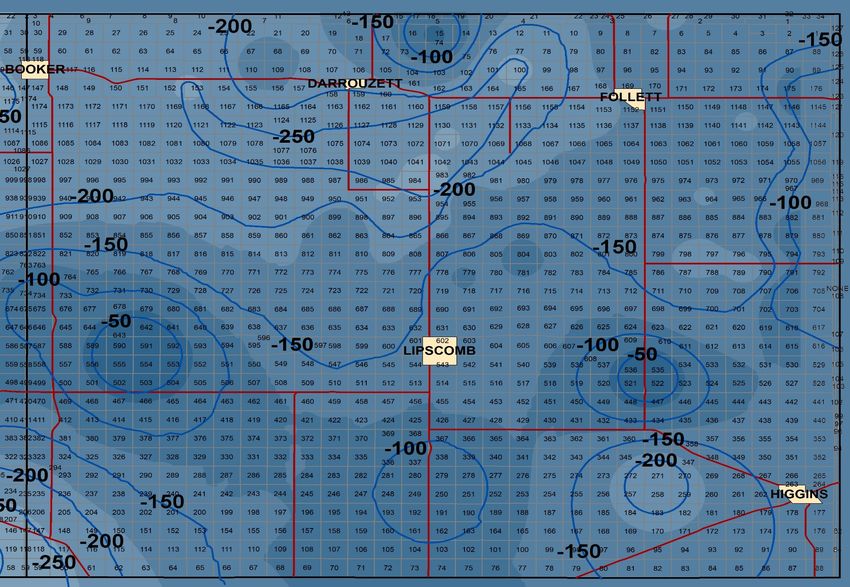
VI. Aquifer Recharge, Inflows and Outflows
Surface water and precipitation provide minimal annual recharge to the Ogallala aquifer especially
when compared to aquifer withdrawals. District-wide average recharge estimates vary slightly but
tend to be below one third of an inch per year. Other inflows and outflows, from and to streams
and lateral inflows and outflows tend to be somewhat equal. Some areas of the District however
may experience significant local recharge.

The recharge information below (Tables 3,4 and 5) are from the Texas Water Development
Board’s (TWDB) Groundwater Availability Model Run 17-008. The GAM run was requested by
the District for use in the 2018 District Management Plan.

Table 3: Summarized recharge, inflows and out flows to the Ogallala Aquifer. All values are in
acre-feet per year rounded to the nearest acre-foot.
 Management Plan requirement                     Aquifer or confining unit         Results
 Estimated annual amount of recharge from             Ogallala Aquifer             137,029
 precipitation to the district
 Estimated annual volume of water that
 discharges from the aquifer to springs and
                                                      Ogallala Aquifer             26,368
 any surface‐water body including lakes,
 streams, and rivers
 Estimated annual volume of flow into the             Ogallala Aquifer             50,186
 district within each aquifer in the district
 Estimated annual volume of flow out of the           Ogallala Aquifer             94,559
 district within each aquifer in the district
 Estimated net annual volume of flow             From Ogallala Aquifer to
 between each aquifer in the district            Rita Blanca and Dockum             3,807
                                                         Aquifers

                                                -8-
TABLE 4: Summarized inflows and outflows to the Dockum Aquifer. All values are in acre-feet
per year rounded to the nearest acre-foot.

 Management Plan requirement                     Aquifer or confining unit     Results
 Estimated annual amount of recharge from              Dockum Aquifer            49
 precipitation to the district
 Estimated annual volume of water that
 discharges from the aquifer to springs and
                                                       Dockum Aquifer             0
 any surface‐water body including lakes,
 streams, and rivers
 Estimated annual volume of flow into the              Dockum Aquifer           4,097
 district within each aquifer in the district
 Estimated annual volume of flow out of the            Dockum Aquifer           2,293
 district within each aquifer in the district
 Estimated net annual volume of flow             From Dockum Aquifer to
 between each aquifer in the district1           Ogallala and Rita Blanca       1,997
                                                         Aquifers

TABLE 5: Summarized inflows and outflows to the Rita Blanca Aquifer. All values are in acre-
feet per year rounded to the nearest acre-foot.
 Management Plan requirement                     Aquifer or confining unit     Results
 Estimated annual amount of recharge from             Rita Blanca Aquifer         0
 precipitation to the district
 Estimated annual volume of water that
 discharges from the aquifer to springs and
                                                      Rita Blanca Aquifer         0
 any surface‐water body including lakes,
 streams, and rivers
 Estimated annual volume of flow into the             Rita Blanca Aquifer        902
 district within each aquifer in the district
 Estimated annual volume of flow out of the           Rita Blanca Aquifer        229
 district within each aquifer in the district
                                                 From Ogallala Aquifer to
                                                                                2,909
 Estimated net annual volume of flow               Rita Blanca Aquifer
 between each aquifer in the district            From Dockum Aquifer to
                                                                                 555
                                                   Rita Blanca Aquifer

                                                -9-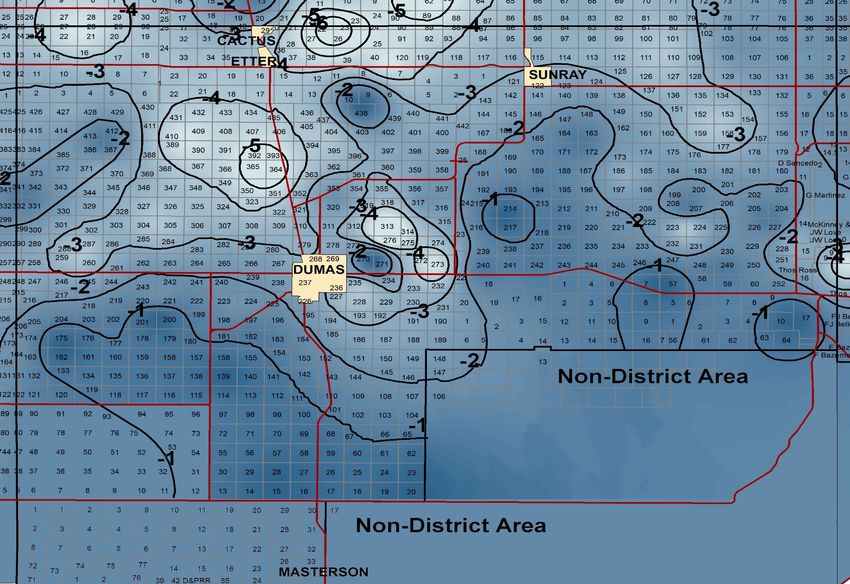
- 10 -
VII. Annual         Groundwater        Production          and   Modeled    Available
Groundwater
Municipal, Industrial, and Agriculture water user groups reported 1,707,029.93 acre-feet
groundwater production in the North Plains Groundwater Conservation District in 2020.
Production by District County in acre-feet as summarized in Table 6.

Table 6. Groundwater Production (acre-feet) in the District for 2020
       County                               2020
       Dallam                               342,745.65
       Hartley                              402,242.14
       Moore                                199,359.43
       Sherman                              328,409.54
       Hansford                             195,120.62
       Hutchinson                           79,388.98
       Lipscomb                             54,522.30
       Ochiltree                            105,241.27
       West                                 1,272,756.76
       East                                 434,273.17
       Total                                1,707,029.93

                                           - 11 -
District groundwater production exceeded the 5-year historical production average by
approximately 138,830 acre-feet. 2020 production was 15,230 acre-feet higher than 2018 but
ranged 38,381 to 341,381 acre-feet less than the Districts annual production from 2011 to 2014.
Table 7 below represents annual groundwater production in acre-feet from 2016 to 2020
collectively from all aquifers in the district.
Table 7. Annual groundwater production in acre-feet from 2016 to 2020
County 2016 2017 2018 2019 2020 Average
Dallam 339,200 312,300 349,900 303,200 342,745.65 329,500
Hartley 391,600 376,000 422,600 349,200 402,242.14 388,300
Moore 185,700 173,100 200,600 157,700 199,359.43 183,300
Sherman 285,300 265,100 312,000 255,400 328,409.54 289,200
Hansford 170,400 146,700 190,800 162,300 195,120.62 173,100
Hutchinson 67,700 63,600 75,500 68,400 79,388.98 70,900
Lipscomb 42,300 44,200 44,200 43,400 54,522.30 45,700
Ochiltree 81,400 77,300 95,500 81,800 105,241.27 88,200
West 1,201,800 1,126,500 1,285,100 1,065,500 1,272,756.76 1,190,300
East 361,800 331,800 406,000 355,900 434,273.17 377,900
Totals 1,563,600 1,458,300 1,691,100 1,421,400 1,707,029.93 1,568,200
The District annually reviews groundwater production from the previous year and determines if
there are conditions that may trigger District Rule 8.4 and District Rule 8.5 evaluation to reduce
Allowable Annual Production. The determination in part is based on the Modeled Available
Groundwater (MAG) measured in acre-feet to achieve the desired future conditions (DFCs) in the
District. Texas Water Development Board GR16-029 MAG Report provides the model data for
the assessment. The table below is a compilation of MAG for Dockum aquifer, Ogallala aquifer
and Rita Blanca aquifer DFCs.
- 12 -Table 8. Compilation of MAG for Dockum aquifer, Ogallala aquifer and Rita Blanca aquifer
DFCs.
Modeled Available Groundwater (Acre-Feet)
County Aquifer 2020 2030 2040 2050 2060 2062
Ogallala/Rita
Dallam 387,471 287,205 225,573 166,890 112,864 103,258
Blanca
Hansford Ogallala 275,016 272,656 271,226 270,281 269,589 269,479
Hartley Ogallala 397,585 271,523 212,321 154,433 100,407 90,842
Hutchinson Ogallala 62,803 64,522 65,652 66,075 66,027 65,956
Lipscomb Ogallala 266,809 266,710 266,640 266,591 266,559 266,557
Moore Ogallala 214,853 172,621 139,322 105,016 73,384 67,650
Ochiltree Ogallala 243,778 243,932 244,002 244,051 244,082 244,085
Sherman Ogallala 398,056 348,895 281,690 212,744 148,552 136,776
Total Ogallala 2,246,371 1,928,064 1,706,426 1,486,081 1,281,464 1,244,603
Dallam Dockum 14,192 14,188 14,186 14,184 14,184 14,184
Moore Dockum 4,801 4,532 4,493 4,417 4,289 4,261
Hartley Dockum 11,602 10,766 10,524 10,560 10,815 10,895
Sherman Dockum 127 127 127 127 95 93
Total Dockum 30,722 29,613 29,330 29,288 29,383 29,433
East Zone MAG 848,406 847,820 847,520 846,998 846,257 846,077
West Zone MAG 1,428,687 1,109,857 888,236 668,371 464,590 427,959
Total District MAG 2,277,093 1,957,677 1,735,756 1,515,369 1,310,847 1,274,036
Groundwater production within the district for 2020 is below 2020 MAG. Hutchinson County
exceeds the 2020 MAG; however, the total groundwater production in East and West Groundwater
Management Zones are below the district’s target 2020 MAG and 2030 MAG. The table shows
the 2020 MAG compared to 2020 Production in acre-feet by county and by management zone.
2020 Annual Production does not exceed the 2020 MAG. Therefore, there are no conditions that
trigger District Rule 8.4 and District Rule 8.5 evaluation to reduce Allowable Annual Reduction.
- 13 -Table 9. Comparison of 2020 annual production to the District’s 2020 MAG.
Average
2020 Percent
Percent Difference
Difference between
between Average MAG and
2020 2020 MAG and Production Production
County MAG Production Production 2016-2020 2016-2020
Dallam 401,663 342,746 -14.67% 329,500 -17.97%
Hartley 409,187 402,242 -1.70% 388,300 -5.10%
Moore 219,654 199,359 -9.24% 183,300 -16.55%
Sherman 398,183 328,410 -17.52% 289,200 -27.37%
Hansford 275,016 195,121 -29.05% 173,100 -37.06%
Hutchinson 62,803 79,389 26.41% 70,900 12.89%
Lipscomb 266,809 54,522 -79.57% 45,700 -82.87%
Ochiltree 243,778 105,241 -56.83% 88,200 -63.82%
West 1,428,687 1,272,757 -10.91% 1,190,300 -16.69%
East 848,406 434,273 -48.81% 377,900 -55.46%
Total 2,277,093 1,707,030 -25.03% 1,568,200 -31.13%
- 14 -VIII. Depth to Water, Average Declines Based on Groundwater
Production and Declines Observed in District Monitor Wells
Changes in the water table, calculated from monitor well measurements vary from rises in the
water level to declines that may locally exceed 8-12 feet per year. Each county in the District has
areas experiencing little or no decline as well as areas of much greater decline. Declines are caused
predominately by agricultural pumping and are influenced primarily by surface recharge of the
aquifer and lateral flows into and out of the aquifer.
Recharge is affected by rainfall, surface runoff, evaporation and plant uptake, depth to water, soil
porosity and the geologic substrata present. An aquifer characteristic that affects the speed an
aquifer refills and consequently how much water a well can produce is intra-formational flow.
Intra-formational flow is the flow of water from one part of an aquifer into another part of the same
aquifer.
Table 10: Average yearly county declines in water levels calculated from groundwater
production reports.
County Average Annual Average declines in water level are calculated
Feet of Decline values (Table 10) created using reported annual
Dallam 1.98 groundwater production and an estimated aquifer
Hansford 1.87 specific yield of 18 percent.
Hartley 2.81
Hutchinson 2.48 Average county declines and average declines
observed in monitor wells differ because District
Lipscomb 0.51 monitor wells are predominately located near
Moore 2.48 areas of high pumping. This bias in monitor well
Ochiltree 1.01 location tends to cause an over estimation of
Sherman 3.11 declines when used to calculate county averages.
- 15 -*Table 11: 2020-2021, Average depth to water and comparisons of average declines in select
District water level monitor wells.
County Avg. 2020 2019 Current Previous Current Previous
Depth Avg. Avg. 5-Year 5-Year 10-Year 10-Year
to Well Well Avg. Avg. Well Avg. Avg.
Water Decline Decline Well Decline Well Well
(Feet) (Feet) (Feet) Decline (Feet) Decline Decline
(Feet) (Feet) (Feet)
Dallam 290 2.96 2.58 2.98 3.08 3.05 2.96
Hansford 303 1.67 1.71 1.66 1.63 1.65 1.62
Hartley 365 3.18 3.05 3.14 3.11 3.12 3.43
Hutchinson 350 1.52 1.47 1.51 1.49 1.50 1.59
Lipscomb 164 0.64 0.49 0.63 0.63 .64 0.58
Moore 358 2.12 2.34 2.17 2.26 2.21 1.95
Ochiltree 341 1.68 1.18 1.59 1.40 1.46 1.43
Sherman 321 2.64 2.48 2.61 2.54 2.55 2.48
District-wide 312 2.05 1.91 2.04 2.02 2.02 2.01
*The information in Table 11 is derived from statistical analyses of monitor well hydrographs
created from current and historical information. The statistical analyses (indicating both rises and
declines) may indicate the quality of information collected from some wells is less than optimal.
Such data may be included in the calculations of declines and depth to water as it represents the
best or in some cases the only information available.
- 16 -IX Active Production Wells within the District
District records indicate that there are over 16,000 well permits that have been issued since the
District was created in 1955. Currently there are 10,526 large active wells which include wells
varying in production between 18 GPM to over 1,000 GPM. During 2021, the District issued 222
permits of all types from January through May 25.
Table 12: Summary of wells in the District and recent new well permits.
County Active Capped Small 2020 2021 Permits
Production Wells Registered Permits Issued Through
Wells Wells Issued May 2021
Dallam 2537 267 750 90 64
Hansford 900 434 288 11 10
Hartley 2600 153 416 199 64
Hutchinson 393 146 125 7 8
Lipscomb 286 71 248 7 1
Moore 1310 349 523 27 38
Ochiltree 547 249 289 12 3
Sherman 1953 324 301 32 34
Total 10526 1993 2740 385 222
*Well count totals may vary over time due to differing database query techniques and as any errors are
corrected.
X. District Monitor Wells
The District monitors declines in
groundwater levels by maintaining a
network of water-level monitoring wells.
Currently the District measures 432 wells
(Table 13). Monitor wells are measured
annually beginning in January and
measurements are complete March or by
mid-March at the latest. The information
collected is analyzed, used to create maps
and plays a vital role in making reasonable
long-term management decisions based
on the best available data.
Typical District Monitor Well
As part of its water level monitoring program, the District may drill or install water level
monitoring equipment in wells (up to ten wells) annually. The drilled wells are non-production
wells dedicated solely to data collection which provide information of more accuracy, reliability,
and consistency than other types of wells the District monitors. They are also readily available, if
needed, for conducting aquifer tests that cannot be easily conducted using other well types.
- 17 -Table 13: 2021 water level monitor wells by District monitor well under
county. construction
County Number of Monitor Wells
Dallam 68
Hartley 67
Sherman 60
Moore 52
Hansford 67
Hutchinson 25
Ochiltree 48
Lipscomb 45
Total 432
XI. District Monitor Well Locations and On-line Interactive Maps
The District maintains a website where data from wells, monitor wells and recording
equipment may be viewed. The map is always a work in progress and all data may not yet be
available. More data and other map layers may become available as work on the on-line map
progresses.
http://map.northplainsgcd.org/
Map 2: Map of private well locations from which the District annually measures water levels.
- 18 -Map 3: District-owned water level monitor wells with and without recording equipment.
(Red = No Recording Equipment Installed).
XII. Water Quality
The District’s goals for groundwater is that future water supplies are of sufficient quantity and
also of excellent quality. The District monitors groundwater chemistry by analyzing samples
from select wells within the District and performing water quality analyses upon request from
area residents.
District Natural Resource Specialist performing
a water quality analysis.
The District may analyze water samples for the
following parameters as necessary:
Total Hardness,
Chloride,
Conductivity,
Fluoride,
Iron,
Nitrate,
pH,
Sodium,
Sulfate,
Total Dissolved Solids,
The Presence or Absence of Coliform Bacteria.
Groundwater within the District is considered excellent although it is “hard” water and contains
considerable calcium and some magnesium carbonate (hardness) (Table 14). The District also
performs analyses to indicate the presence or absence of coliform bacteria. In the rare instance an
analysis indicates the presence of coliform bacteria, the contamination source is often located
within a few yards of the sampled well. Normally a well that tests positive for coliform bacteria
can be decontaminated by eliminating the contaminate source, chlorinating the well, pipes and
water storage equipment and then purging the well, pipes and water storage equipment.
- 19 -Table 14: Typical mineral analyses from wells within the District.
Parameter Units 2018 2018 2019 2019 2020 2020
Number Average Number Average Number of Average
of Analysis of Analysis Analyses Analysis
Analyses Result Analyses Result Result
Sulfate mg/l 32 50.8 29 44.68 USGS Due 2021
Samples
Nitrate mg/l 22 11.14 29 1.653 USGS Due 2021
Samples
Total Iron mg/l 22 0.234 29 .0433 USGS Due 2021
Samples
Chlorides mg/l 22 60.77 29 30.57 USGS Due 2021
Samples
Fluoride mg/l 22 .0466 29 .661 USGS Due 2021
Samples
Total mg/l 22 217 29 208 USGS Due 2021
Hardness Samples
*Due to the 2019-2020 Corvid19 pandemic, routine scheduled sampling and analyses were not undertaken.
However, 16 samples were taken in cooperation between United States Geological Survey and the District.
Results due to be published in late 2021.
Table 14 shows the average mineral compositions indicated from analyses of well water from
within the District. The District samples random wells at the owner’s request as well as annually
analyzing a subset of wells from the District’s monitoring well program. No meaningful
conclusions may be drawn from the above table about potential changes in water quality over time
as the values are not all from the same set of wells. District residents may request a groundwater
analysis by contacting the District. In most instances the analyses are free to District residents.
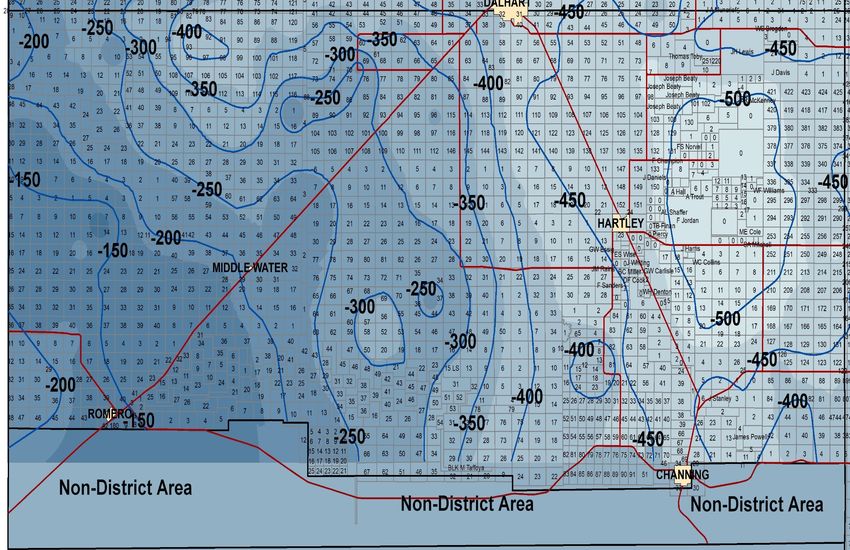
- 20 -XIII. 2021 Depth to Water from Land Surface
Maps depicting depth to water below land surface are created from statistical analyses of current
and historical water level measurements. The most recent water level measurements were
measured in January and February of 2021. Those water level measurements represent the depth
to water at the end of the 2020 agricultural pumping season and prior to the beginning of the 2020
pumping season. It would be valid to title the maps either 2020 or 2021 Depth to Water.
Accuracy: The accuracy of the depth to water is estimated to be equal to the contour interval, +/-
50 feet.
- 21 -- 22 -
Map 4:   Dallam County;   Depth to Water 2021.

                                                 - 23 -
Map 5: Hartley County; Depth to Water 2021.
- 24 -Map 6: Sherman County; Depth to Water 2021.
- 25 -Map 7: Moore County; Depth to Water 2021.
- 26 -Map 8: Hansford County; Depth to Water 2021.
- 27 -Map 9: Hutchinson County; Depth to Water 2021.
- 28 -Map 10: Ochiltree County; Depth to Water 2021.
- 29 -Map 11: Lipscomb County; Depth to Water 2021.
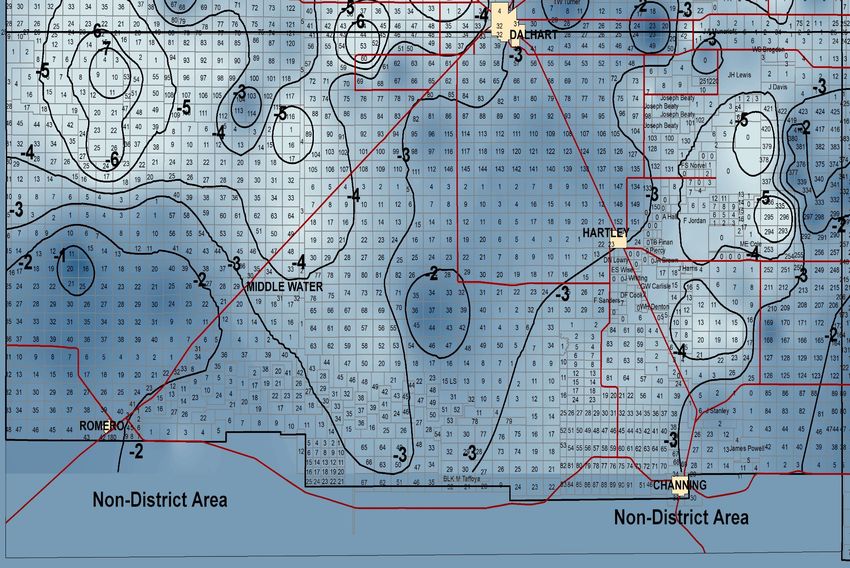
- 30 -XIV. Declines (from 2020 Pumping) in Monitor Wells by County
These maps do not include well measurements that indicate rises in water level. Rises may be valid for some specific areas but generally the
statistical analyses do not indicate a high level of confidence in that data, therefore it is not used.
Maps depicting declines in monitor wells are created from a statistical analysis of current and historical water level measurements. The most
recent water level measurements were taken in January and February of 2021. The declines represent declines resulting predominantly from
the 2020 agricultural pumping season.
Declines are calculated using water level measurements taken from District monitor wells which are located primarily in high pumping areas.
Consequently, these wells tend to show higher declines than what a true county-average-decline would show.
Accuracy: The accuracy of the decline maps is estimated to be +/- 2 feet.
- 31 -- 32 -
Map 12:   Dallam County; 2020 Declines in Monitor Wells.

                                                           - 33 -
Map 13: Hartley County; 2020 Declines in Monitor Wells.
- 34 -Map 14: Sherman County; 2020 Declines in Monitor Wells.
- 35 -Map 15: Moore County; 2020 Declines in Monitor Wells.
- 36 -Map 16: Hansford County; 2020 Declines in Monitor Wells.
- 37 -Map 17: Hutchinson County; 2020 Declines in Monitor Wells.
- 38 -Map 18: Ochiltree County; 2020 Declines in Monitor Wells.
- 39 -Map 19: Lipscomb County; 2020 Declines in Monitor Wells.
- 40 -XV. 2021-2022 Estimated (Average) Saturated Thickness of the Ogallala
Aquifer by County
Maps depicting estimated aquifer saturated thickness are created using geographical information
mapping software and may be created by various methodologies. The most recent water
measurements used in creating saturated thickness maps were taken in January, and February of
2021. The water level elevations calculated represent the water level elevations at the end of the
2020 pumping season and the beginning of the 2021 pumping season. The Saturated Thickness
maps represent the saturated thickness at the beginning of 2021 and is considered reasonably
accurate for at least a three-year period.
Estimated Saturated Thickness Maps are created every other year. The next set of estimated aquifer
thickness maps are scheduled to be created by mid-Summer of 2023.
Accuracy: Map accuracy is estimated to be equal to +/- 50 feet. In some areas data may have
been included from the Rita Blanca or the Dockum Aquifers due to the uncertainty in delineating
those boundaries. Inclusion of such data may increase the value of the saturated thickness of the
Ogallala above what may be encountered in the field.
- 41 -- 42 -
Map 20:   Dallam County;   Average Saturated Thickness 2021-2022.

                                                     - 43 -
Map 21: Hartley County; Average Saturated Thickness 2021-2022.
- 44 -Map 22: Sherman County; Average Saturated Thickness 2021-2022.
- 45 -Map 23: Moore County; Average Saturated Thickness 2021-2022.
- 46 -Map 24: Hansford County; Average Saturated Thickness 2021-2022.
- 47 -Map 25: Hutchinson County; Average Saturated Thickness 2021-2022.
- 48 -Map 26: Ochiltree County; Average Saturated Thickness 2021-2022.
- 49 -Map 27: Lipscomb County; Average Saturated Thickness 2021-2022.
- 50 -XVI. Contributors to Hydrology and Groundwater Resources 2020-2021
North Plains Groundwater District Staff:
Steve Walthour P.G., District General Manager
Dale Hallmark P.G., District Hydrologist
Kirk Welch, Assistant General Manager, Public Information,
Education and Outreach
Kristen Lane, Administration, Production Reporting
Casey Tice, Compliance Coordinator
Shari Stanford, Natural Resource Specialist, Meter Program
Odell Ward, GIS, Natural Resources, Field Operations
Curtis Schwertner, Agricultural Assistant
Louis Orthman Natural Resource Specialist
Document Compiled by:
Dale Hallmark, P.G.
District Hydrologist
dhallmark@northplainsgcd.org The Professional Geoscientist Seal’s use and
the signature was authorized by Troy D.
Hallmark, P.G. (# 10851) in June of 2021 and
is valid solely while this “Hydrology and
North Plains Groundwater Conservation District Groundwater Resources 2019-2020”
603 East First Street (Mail: P.O. Box 795) document is maintained together in its
entirety and has not been altered in any
Dumas Texas 79029 manner from the original document retained
Office 806-935-6401, Fax 806-935-6633 at the North Plains Groundwater
Office Hours 8-12 AM, and 1-5 PM, Mon-Fri Conservation District Office in Dumas,
Texas.
- 51 -You can also read