Hypothalamic structural integrity and temporal complexity of cortical information processing at rest in migraine without aura patients between ...
←
→
Page content transcription
If your browser does not render page correctly, please read the page content below
www.nature.com/scientificreports

                OPEN              Hypothalamic structural integrity
                                  and temporal complexity of cortical
                                  information processing at rest
                                  in migraine without aura patients
                                  between attacks
                                  Camillo Porcaro1,2,3,4, Antonio Di Renzo5, Emanuele Tinelli6, Giorgio Di Lorenzo7,8,
                                  Stefano Seri9,10, Cherubino Di Lorenzo11, Vincenzo Parisi5, Francesca Caramia6,
                                  Marco Fiorelli6, Vittorio Di Piero6, Francesco Pierelli11,12 & Gianluca Coppola11*

                                  The hypothalamus has been attributed an important role during the premonitory phase of a migraine
                                  attack. Less is known about the role played by the hypothalamus in the interictal period and its
                                  relationship with the putative neurocognitive networks previously identified in the pathophysiology
                                  of migraine. Our aim was to test whether the hypothalamic microstructure would be altered during
                                  the interictal period and whether this co-existed with aberrant connectivity at cortical level. We
                                  collected multimodal MRI data from 20 untreated patients with migraine without aura between
                                  attacks (MO) and 20 healthy controls (HC) and studied fractional anisotropy, mean (MD), radial
                                  (RD), and axial diffusivity of the hypothalamus ROI as a whole from diffusion tensor imaging (DTI).
                                  Moreover, we performed an exploratory analysis of the same DTI metrics separately for the anterior
                                  and posterior hypothalamic ROIs bilaterally. From resting-state functional MRI, we estimated the
                                  Higuchi’s fractal dimension (FD), an index of temporal complexity sensible to describe non-periodic
                                  patterns characterizing BOLD signature. Finally, we correlated neuroimaging findings with migraine
                                  clinical features. In comparison to HC, MO had significantly higher MD, AD, and RD values within the
                                  hypothalamus. These findings were confirmed also in the exploratory analysis on the sub-regions of
                                  the hypothalamus bilaterally, with the addition of lower FA values on the posterior ROIs. Patients
                                  showed higher FD values within the salience network (SN) and the cerebellum, and lower FD values
                                  within the primary visual (PV) network compared to HC. We found a positive correlation between
                                  cerebellar and SN FD values and severity of migraine. Our findings of hypothalamic abnormalities
                                  between migraine attacks may form part of the neuroanatomical substrate that predisposes
                                  the onset of the prodromal phase and, therefore, the initiation of an attack. The peculiar fractal
                                  dimensionality we found in PV, SN, and cerebellum may be interpreted as an expression of abnormal
                                  efficiency demand of brain networks devoted to the integration of sensory, emotional, and cognitive
                                  information related to the severity of migraine.

                                  1
                                   Institute of Cognitive Sciences and Technologies (ISTC) - National Research Council (CNR), Rome, Italy. 2Centre
                                  for Human Brain Health and School of Psychology, University of Birmingham, Birmingham, UK. 3S. Anna Institute
                                  and Research in Advanced Neurorehabilitation (RAN), Crotone, Italy. 4Department of Information Engineering
                                  - Università Politecnica delle Marche, Ancona, Italy. 5IRCCS Fondazione Bietti, Rome, Italy. 6Department
                                  of Human Neurosciences, Sapienza University of Rome, Rome, Italy. 7Laboratory of Psychophysiology and
                                  Cognitive Neuroscience, Department of Systems Medicine, University of Rome Tor Vergata, Rome, Italy. 8IRCCS
                                  - Fondazione Santa Lucia, Rome, Italy. 9College of Health and Life Sciences, Aston Institute of Health and
                                  Neurodevelopment, Aston University, Birmingham, UK. 10Department of Clinical Neurophysiology, Birmingham
                                  Women’s and Children’s NHS Foundation Trust, Birmingham, UK. 11Department of Medico‑Surgical Sciences and
                                  Biotechnologies, Sapienza University of Rome Polo Pontino, Corso della Repubblica 79, 04100 Latina, Italy. 12IRCCS
                                  - Neuromed, Pozzilli, IS, Italy. *email: gianluca.coppola@uniroma1.it

Scientific Reports |   (2021) 11:18701                | https://doi.org/10.1038/s41598-021-98213-3                                                1

                                                                                                                                             Vol.:(0123456789)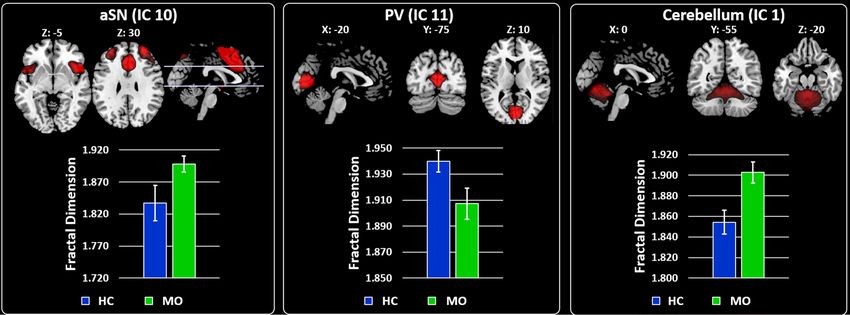
www.nature.com/scientificreports/
HC (N = 20) MO (N = 20)
Women (number) 11 12
Age (years) 29 ± 4 32 ± 7
Attacks frequency/month (number) 3 ± 2.0
Disease duration (year) 14 ± 6.5
Severity of headache (0–10) 7.3 ± 0.9
Headache-related disability (number) 2 ± 0.4
Tablet intake/month (number) 3 ± 1.8
Days since the last migraine attack (number) 21 ± 17.5
Table 1. Clinical and demographic of healthy controls (HC) and of patients with migraine without aura (MO).
Data are expressed as frequency and mean ± SD.
In recent years, studies of the pathophysiology of migraine have seen a renewed interest in the role played by
the hypothalamus in the recurrence of migraine attacks. This brain structure seems to play a predominant role
during the phase immediately preceding an attack when some patients experience premonitory s ymptoms1–3.
During the attack, the hypothalamus is metabolically h yperactive4, poorly connected to the spinal trigeminal
nucleus2, and more strongly coupled with the dorsal pons5. The hypothalamus also appears to be involved in the
state of a never-ending migraine attack that is chronic migraine6,7.
Furthermore, the interictal phase is characterized by abnormal connectivity of cortical networks and this has
been shown to correlate with clinical variables such as frequency of attacks and severity of migraine pain8. We
recently reported that abnormal functional connectivity between some of these networks and the hypothala-
mus is peculiar to patients suffering from chronic m igraine7. Moulton and colleagues9 using an ROI-to-ROI
approach, found stronger functional connectivity between the hypothalamus and several brain regions involved
in the regulation of autonomic functions in interictal migraine patients but little is known at whole-brain level.
Here, we sought whether there is abnormal integrity of the hypothalamic structures and of functional con-
nectivity of cortical networks in a group of migraine patients without aura between attacks. Therefore, we measure
the hypothalamic microstructure through diffusion tensor imaging (DTI), a useful sensitive method to detect
white matter tracts in grey matter nuclei—as is the case for the hypothalamus10 and the independent cortical
networking by acquiring resting-state functional MRI taking the advantages of the non-linearity of the Higuchi’s
fractal dimension (FD) analysis11–14. This non-linear approach is more suitable to describe the irregular and
non-periodic patterns characterizing the BOLD signature of discrete cortical areas belonging to a resting-state
network (RSN) recorded by n euroimaging15,16 as well as electrophysiological techniques17,18.
Considering that in previous studies the hypothalamus has been involved in the pre-ictal period of migraine
and that the activity of cortical networks is dysfunctional even outside attacks, we hypothesized that the micro-
structure of the hypothalamus could be altered during the pain-free period, as a favoring anatomical substrate
to the recurrence of migraine, and that would be independent from aberrant RSN connectivity and migraine
clinical features.
Results
Demographic characteristics of MO and HC and clinical features of MO are summarized in Table 1. No signifi-
cant difference emerged between MO and HC in gender (χ12 = 0.102, p = 0.749) and age (t38 = − 1.628, p = 0.112).
In patients with MO, we did not detect white matter lesions.
Characterization of hypothalamic DTI. No multivariate outliers were present in the MANOVA model
(highest Mahalanobis Distance value: 14.843). Multivariate test revealed a significant GROUPs effect (Wilks’
λ = 0.736, F4,35 = 3.131, p = 0.027). Univariate ANOVA analyses showed that, compared to HC, patients with MO
showed significantly higher MD, AD, and RD hypothalamic DTI metrics, with large effect sizes. FA DTI metric
did not statistically differ between groups, even though the effect size was moderate to large. In Table 2, descrip-
tive and univariate statistics of DTI metrics for hypothalamic ROI are reported.
Regarding the DTI metrics in the four regions of interest of hypothalamus, in the rm-MANOVA model no
multivariate outliers were present (highest Mahalanobis Distance value: 32.307). Multivariate test revealed a
PARTs × SIDEs × GROUPs effect just above the level of significance (Wilks’ λ = 0.779, F4,35 = 2.487, p = 0.061).
Despite Wilks’ Lambda multivariate significance criterion not being reached, we proceeded to univariate analy-
sis for exploratory purposes. The rm-ANOVA model of FA did not have a significant PARTs × SIDEs × GROUPs
effect (F1,38 = 0.099, p = 0.755) whereas the rm-ANOVA models for MD, AD, and RD revealed significant
PARTs × SIDEs × GROUPs effects (respectively: MD: F 1,38 = 7.674, p = 0.009; AD: F1,38 = 8.670, p = 0.005; RD:
F1,38 = 6.076, p = 0.018). Univariate ANOVA analyses revealed that FA in the anterior part of the left and right
hypothalamus did not differ between HC and MO whereas FA in the posterior part of the left and right hypo-
thalamus was significantly lower in patients with MO than HC, with large effect sizes (respectively: left posterior,
d = 1.36; right posterior, d = 1.81). Consistently, MD, AD, and RD in the anterior and posterior part of the left and
right hypothalamus were significantly higher in MO compared to HV, with large to huge effect sizes [ds ranging
from 0.85 (AD in left anterior hypothalamus) to 2.89 (AD in left posterior hypothalamus)]. In Table 3, descriptive
Scientific Reports | (2021) 11:18701 | https://doi.org/10.1038/s41598-021-98213-3 2
Vol:.(1234567890)www.nature.com/scientificreports/
DTI metric HC MO Statistics
F1,38 = 3.650, p = 0.064
FA 0.271 ± 0.050 0.241 ± 0.048
d = 0.62
F1,38 = 5.829, p = 0.021
MD 1.170E−03 ± 1.630E−04 1.300E−03 ± 1.740E−04
d = − 0.79
F1,38 = 5.329, p = 0.027
AD 1.450E−03 ± 1.530E−04 1.570E−03 ± 1.700E−04
d = − 0.76
F1,38 = 7.001, p = 0.012
RD 1.030E−03 ± 1.690E−04 1.170E−03 ± 1.780E−04
d = − 0.83
Table 2. Descriptive and univariate statistics for the hypothalamus fractional anisotropy (FA), mean
diffusivity (MD), axial diffusivity (AD), and radial diffusivity (RD) in HC and MO.
DTI metric HC MO Statistics
FA
F1,38 = 0.766, p = 0.387
Left anterior 0.172 ± 0.051 0.197 ± 0.120
d = − 0.28
F1,38 = 17.509, p = 0.0002
Left posterior 0.273 ± 0.149 0.115 ± 0.079
d = 1.36
F1,38 = 0.003, p = 0.960
Right anterior 0.178 ± 0.061 0.176 ± 0.099
d = 0.02
F1,38 = 31.175, p < 0.0001
Right posterior 0.316 ± 0.124 0.124 ± 0.091
d = 1.81
MD
F1,38 = 10.984, p = 0.002
Left anterior 1.509E−03 ± 3.580E−04 2.077E−03 ± 6.780E−04
d = − 1.07
F1,38 = 74.384, p < 0.0001
Left posterior 1.576E−03 ± 4.830E−04 2.914E−03 ± 4.980E−04
d = − 2.80
F1,38 = 14.278, p = 0.001
Right anterior 1.360E−03 ± 2.510E−04 2.056E−03 ± 7.850E−−04
d = − 1.23
F1,38 = 40.587, p < 0.0001
Right posterior 1.744E−03 ± 5.740E−04 2.859E−03 ± 5.320E−04
d = − 2.07
AD
F1,38 = 6.888, p = 0.012
Left anterior 1.689E−03 ± 4.270E−04 2.224E−03 ± 8.060E−04
d = − 0.85
F1,38 = 79.542, p < 0.0001
Left posterior 1.828E−03 ± 4.780E−04 3.202E−03 ± 4.960E−04
d = − 2.89
F1,38 = 16.583, p = 0.0002
Right anterior 1.514E−03 ± 2.690E−04 2.252E−03 ± 7.650E−04
d = − 1.32
F1,38 = 50.473, p < 0.0001
Right posterior 2.072E−03 ± 5.580E−04 3.180E−03 ± 4.180E−04
d = − 2.31
RD
F1,38 = 9.655, p = 0.004
Left anterior 1.431E−03 ± 3.070E−04 1.975E−03 ± 7.200E−04
d = − 1.01
F1,38 = 61.077, p < 0.0001
Left posterior 1.471E−03 ± 4.980E−04 2.776E−03 ± 5.570E−04
d = − 2.53
F1,38 = 12.081, p = 0.001
Right anterior 1.282E−03 ± 2.420E−04 1.906E−03 ± 7.650E−04
d = − 1.13
F1,38 = 37.177, p < 0.0001
Right posterior 1.600E−03 ± 5.770E−04 2.693E−03 ± 5.560E−04
d = − 1.98
Table 3. Descriptive and univariate statistics for the fractional anisotropy (FA), mean diffusivity (MD),
axial diffusivity (AD), and radial diffusivity (RD) of the anterior and posterior part of the left and right
hypothalamus in HC and MO.
and univariate statistics of DTI metrics of the anterior and posterior part of the left and right hypothalamus in
HC and MO are reported.
fMRI resting‑state networks. The twenty ICs were grouped into the following ten large-scale networks
based on their spatial patterns (Fig. 1): Cerebellum (IC1—Cb); Auditory Network (IC2—AN); Fronto-Parietal
Network (IC3—right FPN and IC23—Left FPN); Dorsal Attention System (IC6—left DAS and IC17—right
DAS); Sensory Motor Network (IC7, IC8, IC33); Salience Network (IC 10—anterior part of SN (aSN) and IC19);
Visual Network (IC11—Primary visual (PV) and IC 24—lateral visual (LVN)); Default Mode Network (DMN—
IC15, IC20, IC28, and IC31); Precuneous (IC25 and IC27); Language Network (LN—IC 26).
Scientific Reports | (2021) 11:18701 | https://doi.org/10.1038/s41598-021-98213-3 3
Vol.:(0123456789)www.nature.com/scientificreports/
Figure 1. Resting State Networks (RSNs) identified by GIFT. Twenty spatial maps divided into ten functional
networks were found: Cerebellum (Cb—IC1); Auditory (AN—IC2); Fronto-Parietal (FPN: IC3—rFPN and
IC23—lFPN); Dorsal Attention System (DAS: IC6—lDAS and IC17—rDAS); Sensory Motor (SMN—IC7, IC8,
IC33); Salience (SN—IC 10 and IC19); Visual (VN: IC11—Primary Visual and IC24—Lateral Visual); Default
Mode (DMN—IC15, IC20, IC28 and IC31); Precuneous (IC25 and IC27) and Language (LN—IC 26) networks
based on their anatomical view. Montreal Neurological Institute (MNI) coordinates are shown as well.
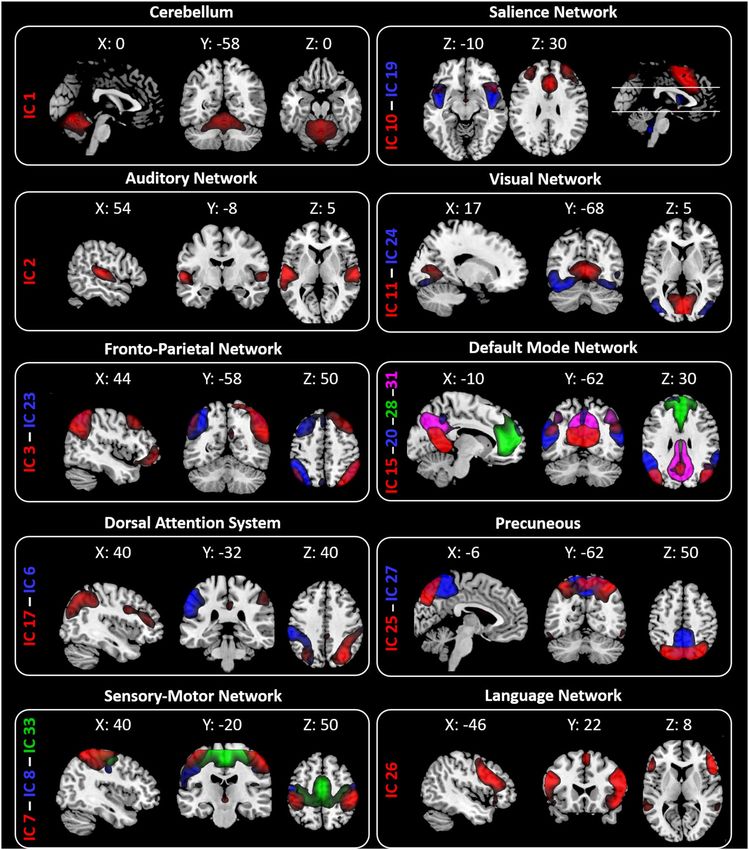
Characterization of the BOLD RSNs by Higuchi’s fractal dimension. The rm-ANOVA model
for FD values revealed that the interaction effect GROUPs × ICs was significant (Wilks’ λ = 0.262, F19,20 = 2.962,
p = 0.010). Because the sphericity assumption was violated (Mauchly’s W < 0.001, χ189 2 = 307.650, p < 0.001), the
ε adjustment was adopted in the univariate test for repeated measures, which resulted significant (F9,117 = 1.936,
ε = 0.480, p = 0.045). At univariate level, MO differed from HC in FD values of IC1/Cb (F1,38 = 10.638, p = 0.002),
IC10/aSN (F1,38 = 4.842, p = 0.034) and IC11/PV (F1,38 = 4.716, p = 0.036). Compared to the HC, higher FD values
were observed in MO for IC10/aSN (d = 0.80; Fig. 2—left panel) and IC1/Cb (d = 0.84; Fig. 2—right panel). The
opposite pattern was observed for IC11/PV (d = − 0.76; Fig. 2—middle panel) with lower FD for the MO com-
pared to the HC.
Scientific Reports | (2021) 11:18701 | https://doi.org/10.1038/s41598-021-98213-3 4
Vol:.(1234567890)www.nature.com/scientificreports/
Figure 2. RSNs BOLD characterization by Higuchi’s fractal dimension (FD). For each panel (Left, Middle and
Right)—Spatial maps of the IC obtained by GIFT toolbox. Grand average and standard error for the FD values
(k = 12) are shown for both groups HC (blue) and MO (green). Left panel—Shows the results obtained for IC10
representing the aSN. Middle panel—Shows the results for IC 11 representing the PV. Right panel—Shows the
results for IC 1 representing the Cerebellum. All images have been co-registered into the Montreal Neurological
Institute (MNI) space. The numbers above each image refers to the X, Y and Z coordinates in MNI space. aSN
anterior part of the salience network, PV primary visual network.
Figure 3. Scatterplots between BOLD IC FD values and clinical variables. Correlation analysis between FD
values of IC1 (Cb) and IC10 (aSN) BOLD activity and clinical variables (Frequency and VAS).
Correlation analysis. Significant correlation was found between severity of migraine pain, as assessed by
0–10 VAS, and FD values of IC1 (r = 0.448, p = 0.049) and IC10 (r = 0.469, p = 0.037), while attacks frequency
correlated with FD values of IC10 (r = − 0.486, p = 0.030) (Fig. 3).
No other significant correlation was found between DTI metrics of the hypothalamus, considered as a whole
or in its single ROIs, and FD metrics of the networks, as well as with clinical variables.
Discussion
Confirming our initial hypothesis, we detected an interictal alteration of hypothalamic diffusion-weighted MRI
signal in the migraine group. Compared to HC, DTI MRI showed higher values of MD, AD, and RD within the
hypothalamus when measured as a single ROI. In migraine patients we also detected significantly higher FD
then in the HCs at the level of the salience network and cerebellum, while FD was lower in the primary visual
network. Nonetheless, the complexity of cortical networks correlated with attacks frequency and severity of
migraine pain. In the exploratory analysis on the contribution of anterior and posterior bilateral hypothalamic
ROIs, we detected higher values of MD, AD, and RD within the all ROIs, with lower values of FA in the posterior
hypothalamus bilaterally.
Microstructure of the hypothalamus. The hypothalamus, through its orexinergic and non-orexiner-
gic neuroendocrine system, is a fundamental brain hub devoted to coordinating appropriate physiological and
behavioral responses to threatening or potentially threatening internal and external factors19,20. For this func-
Scientific Reports | (2021) 11:18701 | https://doi.org/10.1038/s41598-021-98213-3 5
Vol.:(0123456789)www.nature.com/scientificreports/
tion, the hypothalamus, particularly in its posterior part, is anatomically connected to the two most important
systems of the brain programmed to control pain, the one located in the frontal l obes21 and the one located in the
midbrain2,22. Through these systems, the hypothalamus has an important antinociceptive f unction23.
With the help of modern neuroimaging, some recent studies have supported the historical view24 of the
hypothalamus as a cerebral structure playing a pivotal role in the recurrence of migraine attacks, its anterior
part showing increased neural activity up to 48 h before an attack, in a time period when premonitory symp-
toms may occur1–3. Hypothalamic activation has also been described during the chronic daily or almost daily
presentation of migraine attacks, especially in its anterior part when migraine is chronic, and its posterior region
during headaches6, 7, 25. Volume of the posterior hypothalamic regions in voxel-based morphometry processing
was found lower in episodic migraine patients when compared with c ontrols26.
Mean, axial, and radial diffusivity were significantly higher in patients than in HC, both considering the
hypothalamus as a whole and assessing its anterior and posterior bilateral ROIs separately. The MD metric
typically is comprised of RD and AD and quantifies the overall magnitude of water diffusion by indicating both
cellular swelling and cellular density27. In particular, AD and RD diffusivity is considered to be in vivo surrogate
markers of myelin and axonal damage, respectively. We also observed that despite FA DTI metric did not statisti-
cally differ between groups when we considered the hypothalamus as a whole, in the exploratory analysis on the
hypothalamic ROIs significantly lower values were detected in the posterior parts bilaterally.
The peculiar diffusivity pattern of higher MD, AD, and RD, with lower FA, we found in patients with MO may
reflect slightly decreased cellularity (neuronal and glial cells) and/or loss in the directional organization of highly
anisotropic myelinated fibers interconnecting individual hypothalamic nuclei in combination with an increased
cell density28. Indeed, anatomically, the hypothalamus is formed by a conglomerate of grey matter nuclei and by
interconnecting myelinated fibers; animal models have indicated that increased cell swelling may coincide with
increased in neural electric response29.
Within network fractal dimensionality. The involvement of salience, visual, and cerebellar networks
in migraine pathophysiology is not a novel finding. The salience network includes dorsal anterior cingulate
and anterior insular cortices30. Among its many functions, the SN is involved in self-awareness through the
integration of sensory, emotional, and cognitive information31. In previous studies performed in MO patients,
the SN showed less intrinsic functional c onnectivity32,33 and lack of BOLD response habituation to p ain34,35 in
comparison to HC.
The visual areas probably play a major role in the pathophysiology of migraine. In fact, n europhysiological36
37,38
and psychophysiological responses, fMRI BOLD evoked activity and spontaneous connectivity33,39,40, meta-
bolic activity41,42 and structural a bnormalities43 of the visual areas were all several times found to be altered in
patients with episodic migraine when between attacks.
Even though the cerebellum was found to be activated in response to painful stimuli in several studies, it
received less attention by researchers who attempt to shed light on migraine pathophysiology40,44–48. Its involve-
ment in migraineur pain comes not at odd since it is well known that the deep cerebellar nuclei process noxious
stimuli49–51 and take part in the perception of pain and its inhibition through their connections with the brain-
stem and the thalamus48,52.
Our findings add a further dimension to the understanding of the pathophysiology of MO; increased fractal
dimensionality within the salience and cerebellar networks and decreased FD within the primary visual net-
work could be explained postulating that loss or gain in complexity in brain activity reflects more flexible and/
or efficient information processing, as a result of short and long-range interactions between neuronal structures
operating at multiple dimensional levels such as space and time53. Therefore, the complex pattern found in
SN and cerebellum may reflect an increased efficiency demand of brain networks devoted to the integration
of sensory, emotional, and cognitive information related to the severity of migraine presentation. In support
of this interpretation, we detected that both SN and cerebellum FD correlated positively with the frequency of
the recurrence of migraine attacks and with the subjective perception of ictal pain intensity, a datum already
described by o thers34,48. The reduced efficiency in information processing we detected within the PV network
may be the morpho-functional counterpart of the neurophysiological finding of an initially slower interictal
visual cortical reactivity54 as well as of the cortical hypometabolism found with the FDG-PET42 in between
attacks of episodic migraine.
Relevance for migraine pathophysiology. In recent years, the attention of researchers has shifted from
the brain stem to the hypothalamus as a possible generator of migraine. The neuroimaging results obtained
longitudinally over a period of 1 month led researchers to believe that the hypothalamus, especially the anterior
part, plays a primary role in the beginning of the premonitory phase of the attack1–3. Our study shows that the
hypothalamus presents structural abnormalities, both in its anterior and posterior regions, even when it is not
in a premonitory phase or during migraine attacks. We speculate that these microstructural abnormalities may
reflect rising in hypothalamic excitability, and that could be considered as a neuroanatomical substrate favoring
the beginning of the prodromal phase and, therefore, the ignition of an attack. The involvement of cortical net-
works detected by us in the same group of patients could be another favorable factor on which external modifi-
able factors could further lower the threshold for the activation of the trigeminovascular system which, together
with the hypothalamic-pituitary neuroendocrine system, tries to maintain correct homeostasis of the body, i.e.
to prevent brain dysexcitability55. In this regard, it is interesting to note that most of the areas forming part of
the networks analyzed by us were active, together with the hypothalamus, even during the pre-monitory phase
of migraine1, and that, in migraine families, a gene module in the visual cortex can determine a complex genetic
Scientific Reports | (2021) 11:18701 | https://doi.org/10.1038/s41598-021-98213-3 6
Vol:.(1234567890)www.nature.com/scientificreports/
trait setting peculiar gene–gene interactions, transcriptomic, and gene-networking both at the cortical level and
at the level of the neuroendocrine system56.
Interestingly, our results show no correlation between microstructural metrics of the hypothalamus and
cortical complexity metrics in interictal migraine. This could mean both that the hypothalamus is not crucial in
the determinism of cortical dysfunction among migraine attacks or that it may become so only when a migraine
attack is about to initiate, i.e. at a time when hypothalamus should coordinate appropriate behavioral responses
to threatening or potentially threatening internal and external factors19,20. Overall, the mechanistic underpin-
nings of these complex multilevel changes, from structure to function, are still far from being understood as
they fit into the complex puzzle of migraine pathophysiology. In the context of this complexity, we note that
the area belonging to the networks in which we found abnormal fractal dimensionalities are indeed similar to
brain regions in which abnormal cortical hyperresponsiveness to sensory stimuli was previously detected, and
therefore considered another factor favoring the repetition of migraine a ttacks57.
A limitation of our study relies in the nature of migraine syndrome, i.e. its high genotypic and phenotypic
variability that implies a less immediate generalizability of the results. A larger cohort of patients might allow
a better characterization of phenotypic subgroups of migraine patients. Another possible limitation is the lack
of correlation between morpho-functional and psychometric variables, such as pain rumination or anxiety.
Future work must investigate the same diffusivity metrics also in the premonitory phase and during migraine
attacks. It remains to be seen whether these interictal microstructural anomalies are permanent or can be nor-
malized by pharmacological and non-pharmacological therapies, commonly used for migraine prophylaxis.
Materials and methods
Participants. We prospectively enrolled 20 patients affected by episodic migraine without aura (MO) from
the headache consultation of Sapienza University of Rome Polo Pontino in Latina (Italy). Patients were initially
diagnosed according to the International Classification of Headache Disorders (ICHD) IIIbeta and confirmed
according to the ICHD-III58. We included only patients who did not have a migraine attack during the scan or in
a period between 3 days before or after the scan, as well as those who were not overusing medication or did not
have prophylaxis in progress or do it in the 3 months before the scan. We recruited 20 healthy subjects with no
personal or family history of migraine or other primary headaches as controls (HC). For all participants in the
study, the exclusion criteria were the presence of other concomitant neurological disorders, or obvious psychiat-
ric, endocrinological, autoimmune, connective tissue disorders, and ophthalmological disorders as assessed with
a complete neuro-ophthalmological evaluation including best-corrected visual acuity, slit-lamp biomicroscopy,
intraocular pressure measurement, and indirect ophthalmoscopy. This study is part of a larger one performed
between 2013 and 2019, in which the same participant underwent multiple neuroimaging procedures during the
same experimental session. All the scanning sessions took place during the afternoon. Women who participated
in the study were scanned outside the days of menstruation (11.4 ± 4.0 days from menstruation onset in HCs,
12.0 ± 3.9 in MO patients). All participants were first informed about the aims of the study and the procedures,
then signed informed consent. The study was approved by the ethical committee of the Sapienza University of
Rome (RIF.CE 4839). All experiments were performed in accordance with the Declaration of Helsinki.
fMRI data acquisition and preprocessing. MRI data were obtained on a Siemens 3 T Verio scanner
using a 12-channel head coil. Structural anatomic scans were performed using a T1-weighted sagittal mag-
netization-prepared rapid gradient echo (MPRAGE) series (TR: 1900 ms, TE: 2.93 ms, 176 sagittal slices,
0.508 × 0.508 × 1 mm3 voxels)15. We acquired an interleaved double-echo Turbo Spin Echo sequence proton den-
sity and T2-weighted images (repetition time: 3320 ms, echo time: 10/103 ms, matrix: 384 × 384, field of view:
220 mm, slice thickness: 4 mm, gap: 1.2 mm, 50 axial slices). Diffusion tensor imaging (DTI) was acquired by
using single-shot echo-planar imaging, with a 128–channel head coil (TR 12,200 ms, TE 94 ms, 72 axial slices,
2 mm thickness, isotropic voxels). Images from the same participants and during the same session were obtained
with diffusion gradients applied along 30 non-collinear directions, effective b values of 0 and 1000 s/mm2 were
used. Functional MRI data were obtained using T2*-weighted, echo-planar imaging (TR: 3000 ms, TE: 25 ms,
40 axial slices, 3.906 × 3.906 × 3 mm, 150 volumes). Functional resting scans lasted seven minutes and 30 s, dur-
ing which participants were instructed to relax, avoid motion and keep their eyes closed, but not to fall asleep.
Data pre-processing was carried out using SPM12 software (http://www.fil.ion.ucl.ac.uk/spm/) implemented
in MATLAB (version R2016b, MathWorks, Inc., Natick, MA, USA). Data were realigned to the first volume to
correct for head motion using a 6-parameter rigid body process and resliced by cubic spline interpolation. The
structural (T1-MPRAGE) and functional data were co-registered for each participant dataset. Normalization
procedure transformed structural and realigned EPI images into a common stereotactic space based on Talairach
and Tournoux59, resampled by 3 mm in each direction. Finally, the spatially normalized functional images were
smoothed isotropically at 8 × 8 × 8 mm.
Diffusion tensor imaging (DTI) analysis. FSL 6.0 software package (FMRIB Image Analysis Group,
Oxford, England; https://fsl.fmrib.ox.ac.uk/fsl/fslwiki) was used to process image data.
The FSL Diffusion Toolbox (FDT) was used to correct susceptibility induced distortions60, eddy c urrents61,
and motion a rtifacts62, while the brain extraction tool (BET) was used to create brain masks from the b0 image
of each participant63. An automated quality control framework was used to assess diffusion MRI d ata64.
The FSL toolbox DTIFIT fits the pre-processed image based on a diffusion tensor model to yield AD (axial
diffusivity), FA (fractional anisotropy), MD (mean diffusivity), and RD (radial diffusivity).
For each subject, a region of interest (ROI) was defined, which covers the whole of the hypothalamus.
In addition, for each subject we defined 4 further regions of interest covering the left and right anterior
Scientific Reports | (2021) 11:18701 | https://doi.org/10.1038/s41598-021-98213-3 7
Vol.:(0123456789)www.nature.com/scientificreports/
hypothalamus—mostly with neuroendocrine function—and the left and right posterior hypothalamus, includ-
ing the wake promoting nuclei. For this purpose, we used the coordinates provided by Boes et al.65. The size of
the hypothalamic ROI in the 2 mm space was 6 voxels, 3 per hemisphere, equally for the anterior and posterior
ROIs. Mean AD, FA, MD, and RD values in the hypothalamus for every subject were calculated by averaging
those voxels in the ROI.
fMRI data analysis. After data preprocessing, resting-state data of all participants were concatenated (HC
and MO) and analyzed using spatial independent component analysis (ICA) based on the infomax algorithm, as
implemented in the Group ICA of fMRI Toolbox (GIFT—http://trendscenter.org/software/gift/) to decompose
the data into functional networks that exhibited a unique time course profile. Two data reduction steps were
carried out using principal component analysis, subject-specific and group-level steps. Firstly Subject-specific
data were reduced to 50 components and subsequently reduced data were concatenated over time. Secondly, at
group level, data were reduced into 36 group independent components (ICs) using the expectation–maximiza-
tion algorithm included in GIFT66.
Spatial ICAs was also performed separately for HC and MO patients to ensure that the resulting components
had similar resting-state fluctuations in the two groups as in the resulting components obtained from all 40
participants combined.
The number of ICs was estimated using the minimum description length (MDL) c riterion67,68. In our specific
case, 33 independent components (ICs) were indicated to be estimated. Subject-specific spatial maps and time
courses were obtained using the back-reconstruction approach (GICA)69.
From the 33 ICs, we identified the relevant RSNs by applying a previously described p rocedure66. Two experi-
enced neuroradiologists (E.T. & F.C.) blindly reviewed the components discarding those showing spatial overlap
with vascular, ventricular, edge regions corresponding to artifacts70. This process resulted in 20 meaningful ICs
that we sorted into 10 functional networks, based on the spatial correlation between independent components
and the template provided by GIFT T oolbox66. The functional networks were arranged into (Fig. 1): Cerebellum
(Cb—IC1); Auditory Network (AN—IC2); Fronto-Parietal Network (FPN—IC3 and IC23); Dorsal Attention
System (DAS—IC6 and IC17); Sensory Motor Network (SMN—IC7, IC8, IC33); Salience Network (SN—IC 10
and IC19); Visual Network (VN—IC11 and IC 24); Default Mode Network (DMN—IC15, IC20, IC28, and IC31);
Precuneous (IC25 and IC27) and Language Network (LN—IC 26).
Characterization of the BOLD RSNs by Higuchi’s fractal dimension. Higuchi’s fractal dimension
(FD)11 is a nonlinear measure of waveform complexity in the time domain. Discretized functions or signals
could be analyzed as time sequences X(1), X(2), …, X(N), where N is the total number of samples. From the
starting time sequence, a new self-similar time series X_m^k can be calculated as:
k N −k
Xm : x(m), x(m + k), x(m + 2k), . . . , x(m + int k)
k
for m = 1, 2, …, k where m is the initial time; k is the time interval, k = 1, 2, …, kmax; kmax is a free parameter,
and int(r) is the integer part of the number r.
The length, Lm(k), of each curve Xkm is calculated as:
1 � N −1
Lm (k) = |X(m + ik) − X(m + (i − 1)k)| · �
int N−m
�
k � �
k
i=1,int N−m
k
where N is the length of the original time series X and (N − 1)/{int[(N − m)/k]k} is a normalization factor. Lm(k)
was averaged for all m forming the mean value of the curve length L(k) for each k = 1, …, kmax as:
k
Lm (k)
L(k) = m=1
k
An array of mean values L(k) was obtained, and the FD was estimated as follow:
FD = ln(L(k))/ln(1/k) for k = 1, 2, . . . , kmax
In practice, the original curve or signal can be divided into smaller parts with or without overlap, called
“windows”. Then, the method for computing FD should be applied to each window where N should be seen as
the length of the window. In that case, FD values are calculated for each window, with or without overlap. Indi-
vidual FD values can be averaged across all windows for the entire curve, and the mean FD value can be used
as a measure of curve complexity.
Here, using the single-subject IC time courses for each RSN, we calculated FD in non-overlapped time
windows of 150 s (corresponding to 50 of our fMRI volumes). The choice of the free parameter k has a crucial
role in FD estimation. For each window we estimated twenty-four values of FD for k = 2, …, 25. The value 25
was equal to half of the samples within our 50 volumes window (i.e. 150 s). kmax is equal to half of the window
length the maximum length that can be chosen. There were three windows within our 150 volume scans, therefore
we estimated three measures of FD at each value of k (e.g. FD2, FD3, FD4, …., FD24). These three measures
were averaged to give one mean value of FD for each k, for each subject12,17,71. The process was then repeated
Scientific Reports | (2021) 11:18701 | https://doi.org/10.1038/s41598-021-98213-3 8
Vol:.(1234567890)www.nature.com/scientificreports/
for every subject and every RSN. Higuchi’s (FD) can be seen as a quantitative nonlinear measure of the BOLD
signal dynamics15,16.
Sample size calculation. As our primary endpoint was to detect differences in the hypothalamic micro-
structure between HC and MO, a sample size calculation was based on pilot data from 20 subjects, ten for each
group, enrolled independently from the current study. For HC, FA was 0.282 ± 0.049, MD 1.134E−03 ± 1.704E−04,
AD 1.404E−03 ± 1.707E−04, and RD 9.944E−04 ± 1.772E−04. For MO, FA was 0.232 ± 0.032, MD
1.371E−03 ± 1.221E−04, AD 1.647E−03 ± 1.164E−04, and RD 1.237E−03 ± 1.251E−04. Assuming that the values
in each subject group were normally distributed with a within-group SD of 0.048 for FA, 1.887E−04 for MD,
1.891E−04 for AD, and 1.943E−04 for RD, to fulfill the desired power of 90% with the significance level at 5%,
the required sample size was for FA 20 subjects for each group, for MD 14, for AD 14, and for RD 15. To be more
conservative, we decided to complete the enrollment when 20 subjects for each group were scanned in MRI.
Statistical analysis. Kolmogorov–Smirnov test for normality indicated that DTI metrics of hypothalamus
and its 4 regions of interest and FD values of all the twenty retained ICs did not differ from a Gaussian distribu-
tion (consistently, p > 0.200).
In order to control the type I error rate due to the multiple comparisons, we carried out a model of mul-
tivariate analysis of variance (MANOVA), a model of repeated-measures of multivariate analysis of variance
(rm-MANOVA), and a model of repeated-measures analysis of variance (rm-ANOVA) on the DTI metrics of
the hypothalamus, the DTI metrics the four regions of interest of hypothalamus, and the FD values, respectively.
MANOVA, followed by univariate ANOVAs, was employed to investigate the GROUPs effect (between-subject
factor: HC vs. MO) on AD, FA, MD, and RD (dependent variables). As the presence of outliers can increase type
I error rate in MANOVA, Mahalanobis Distance was used to identify potential multivariate outliers. Mahalano-
bis Distance critical value of chi-square distribution, for degrees of freedom = 4 and p < 0.001, was 18.47. Uni-
variate ANOVA results were examined only if Wilks’ Lambda multivariate significance criterion was satisfied.
rm-MANOVA, followed by univariate rm-ANOVAs, was employed to investigate the PARTs × SIDEs × GROUPs
interaction effect (PARTs and SIDEs are the two within-subject factors: respectively, anterior vs. posterior part of
hypothalamus and left vs. right hypothalamus; GROUPs is the between-subject factor: HC vs. MO) on FA, MD,
AD, and RD (dependent variables). For the rm-MANOVA, Mahalanobis Distance critical value of chi-square
distribution, for degrees of freedom = 16 and p < 0.001, was 39.25. As for MANOVA, univariate ANOVA results
were analyzed only if the Wilks’ Lambda multivariate significance criterion was achieved. rm-ANOVA was
performed on the FD values to investigate the interaction effect GROUPs × ICs (the two GROUPs as a between-
subject factor: HC vs. MO; the twenty ICs as a within-subjects factor: IC1 vs. IC2 vs. IC3 vs. IC6 vs. IC7 vs. IC8 vs.
IC10 vs. IC11 vs. IC15 vs. IC17 vs. IC19 vs. IC20 vs. IC23 vs. IC24 vs. IC25 vs. IC26 vs. IC27 vs. IC28 vs. IC31 vs.
IC33) (Fig. 1). As for MANOVA and rm-MANOVA, univariate ANOVA results were analyzed only if the Wilks’
Lambda multivariate significance criterion was achieved. The sphericity of the covariance matrix was verified
with the Mauchly sphericity test. In the case of violation of the sphericity assumption, the Greenhouse–Geisser
epsilon adjustment was used. Cohen’s d was used as a measure of effect size in univariate ANOVAs of MANOVA,
rm-MANOVA, and rm-ANOVA models.
Analysis of Pearson correlation coefficient was performed respectively between FD values for each IC and
DTI metrics values for hypothalamic ROIs and clinical variables (e.g.: the severity of headache attacks, ranging
0 to 10; the duration of migraine history, in years; the number of monthly migraine attacks; the number of days
from the last migraine attack; the monthly number of acute medications).
The significance threshold was set at a p-value < 0.05.
Data availability
Clinical, imaging and statistical data will be available upon request from any qualified investigator.
Received: 30 May 2021; Accepted: 30 August 2021
References
1. Maniyar, F., Sprenger, T., Monteith, T., Schankin, C. & Goadsby, P. J. Brain activations in the premonitory phase of nitroglycerin-
triggered migraine attacks. Brain 137, 232–241 (2014).
2. Schulte, L. H. & May, A. The migraine generator revisited: continuous scanning of the migraine cycle over 30 days and three
spontaneous attacks. Brain 139, 1987–1993 (2016).
3. Schulte, L. H., Mehnert, J. & May, A. Longitudinal neuroimaging over 30 days: Temporal characteristics of migraine. Ann. Neurol.
87, 646–651 (2020).
4. Denuelle, M., Fabre, N., Payoux, P., Chollet, F. & Geraud, G. Hypothalamic activation in spontaneous migraine attacks. Headache
47, 1418–1426 (2007).
5. Schulte, L. H., Menz, M. M., Haaker, J. & May, A. The migraineur’s brain networks: Continuous resting state fMRI over 30 days.
Cephalalgia https://doi.org/10.1177/0333102420951465 (2020).
6. Schulte, L. H., Allers, A. & May, A. Hypothalamus as a mediator of chronic migraine. Neurology 88, 2011–2016 (2017).
7. Coppola, G. et al. Increased neural connectivity between the hypothalamus and cortical resting-state functional networks in
chronic migraine. J. Neurol. 267, 185–191 (2020).
8. Coppola, G., Parisi, V., Di Renzo, A. & Pierelli, F. Cortical pain processing in migraine. J. Neural Transm. 127, 551–566 (2020).
9. Moulton, E., Becerra, L., Johnson, A., Burstein, R. & Borsook, D. Altered hypothalamic functional connectivity with autonomic
circuits and the locus coeruleus in migraine. PLoS ONE 9, 10 (2014).
10. Sedrak, M. et al. Diffusion tensor imaging and colored fractional anisotropy mapping of the ventralis intermedius nucleus of the
thalamus. Neurosurgery 69, 1124–1129 (2011).
11. Higuchi, T. Approach to an irregular time series on the basis of the fractal theory. Phys. D Nonlinear Phenom. 31, 277–283 (1988).
Scientific Reports | (2021) 11:18701 | https://doi.org/10.1038/s41598-021-98213-3 9
Vol.:(0123456789)www.nature.com/scientificreports/
12. Kesić, S. & Spasić, S. Z. Application of Higuchi’s fractal dimension from basic to clinical neurophysiology: A review. Comput.
Methods Programs Biomed. https://doi.org/10.1016/j.cmpb.2016.05.014 (2016).
13. Feingold, J., Gibson, D. J., Depasquale, B. & Graybiel, A. M. Bursts of beta oscillation differentiate postperformance activity in
the striatum and motor cortex of monkeys performing movement tasks. Proc. Natl. Acad. Sci. USA https://doi.org/10.1073/pnas.
1517629112 (2015).
14. Lundqvist, M. et al. Gamma and beta bursts underlie working memory. Neuron https://doi.org/10.1016/j.neuron.2016.02.028
(2016).
15. Porcaro, C. et al. Haemodynamic activity characterization of resting state networks by fractal analysis and thalamocortical mor-
phofunctional integrity in chronic migraine. J. Headache Pain 21, 1 (2020).
16. Porcaro, C., Mayhew, S. D., Marino, M., Mantini, D. & Bagshaw, A. P. Characterisation of haemodynamic activity in resting state
networks by fractal analysis. Int. J. Neural Syst. https://doi.org/10.1142/s0129065720500616 (2020).
17. Marino, M. et al. Neuronal dynamics enable the functional differentiation of resting state networks in the human brain. Hum.
Brain Mapp. 40, 1445–1457 (2019).
18. Cottone, C. et al. Neuronal electrical ongoing activity as a signature of cortical areas. Brain Struct. Funct. https://doi.org/10.1007/
s00429-016-1328-4 (2017).
19. James, M. H., Campbell, E. J. & Dayas, C. V. Role of the orexin/hypocretin system in stress-related psychiatric disorders. Curr. Top.
Behav. Neurosci. 33, 197–219 (2017).
20. Grafe, L. A. et al. Orexin 2 receptor regulation of the hypothalamic–pituitary–adrenal (HPA) response to acute and repeated stress.
Neuroscience 348, 313–323 (2017).
21. Jin, J. et al. Orexin neurons in the lateral hypothalamus project to the medial prefrontal cortex with a rostro-caudal gradient.
Neurosci. Lett. 621, 9–14 (2016).
22. Malick, A., Strassman, R. M. & Burstein, R. Trigeminohypothalamic and reticulohypothalamic tract neurons in the upper cervical
spinal cord and caudal medulla of the rat. J. Neurophysiol. 84, 2078–2112 (2000).
23. Razavi, B. M. & Hosseinzadeh, H. A review of the role of orexin system in pain modulation. Biomed. Pharmacother. 90, 187–193
(2017).
24. Pearce, J. M. S. Migraine: A cerebral disorder. The Lancet 324, 86–89 (1984).
25. Lerebours, F. et al. Functional connectivity of hypothalamus in chronic migraine with medication overuse. Cephalalgia 39, 892–899
(2019).
26. Chen, Z., Chen, X., Liu, M., Ma, L. & Yu, S. Volume of hypothalamus as a diagnostic biomarker of chronic migraine. Front. Neurol.
10, 606 (2019).
27. Beaulieu, C. The basis of anisotropic water diffusion in the nervous system: A technical review. NMR Biomed. 15, 435–455 (2002).
28. Mandl, R. C. et al. Functional diffusion tensor imaging: Measuring task-related fractional anisotropy changes in the human brain
along white matter tracts. PLoS ONE 3, 10 (2008).
29. Tasaki, I. & Byrne, P. M. Rapid structural changes in nerve fibers evoked by electric current pulses. Biochem. Biophys. Res. Com-
mun. 188, 559–564 (1992).
30. Menon, V. Salience network. In Brain Mapping Vol. 2 (ed. Toga, A. W.) 597–611 (Academic Press, 2015).
31. Menon, V. & Uddin, L. Q. Saliency, switching, attention and control: A network model of insula function. Brain Struct. Funct. 214,
655–667 (2010).
32. Yang, F.-C. et al. Altered brain functional connectome in migraine with and without restless legs syndrome: A resting-state func-
tional MRI study. Front. Neurol. 9, 25 (2018).
33. Hodkinson, D. J. et al. Cortico-cortical connections of primary sensory areas and associated symptoms in migraine. eNeuro 3,
2016 (2016).
34. Stankewitz, A., Schulz, E. & May, A. Neuronal correlates of impaired habituation in response to repeated trigemino-nociceptive
but not to olfactory input in migraineurs: An fMRI study. Cephalalgia 33, 256–265 (2013).
35. Lee, J. et al. Reduced insula habituation associated with amplification of trigeminal brainstem input in migraine. Cephalalgia 37,
1026–1038 (2017).
36. Abagnale, C. et al. Impaired short-term visual paired associative plasticity in patients with migraine between attacks. Pain 162,
803–810 (2021).
37. Shepherd, A. J. Increased visual after-effects following pattern adaptation in migraine: A lack of intracortical excitation?. Brain
124, 2310–2318 (2001).
38. Shepherd, A. J., Beaumont, H. M. & Hine, T. J. Motion processing deficits in migraine are related to contrast sensitivity. Cephalalgia
32, 554–570 (2012).
39. Soheili-Nezhad, S. et al. Structural and functional reorganization of the brain in migraine without aura. Front. Neurol. 10, 442
(2019).
40. Russo, A. et al. Advanced visual network and cerebellar hyperresponsiveness to trigeminal nociception in migraine with aura. J.
Headache Pain 20, 46 (2019).
41. Boulloche, N. et al. Photophobia in migraine: an interictal PET study of cortical hyperexcitability and its modulation by pain. J.
Neurol. Neurosurg. Psychiatry 81, 978–984 (2010).
42. Lisicki, M. et al. Evidence of an increased neuronal activation-to-resting glucose uptake ratio in the visual cortex of migraine
patients: A study comparing 18FDG-PET and visual evoked potentials. J. Headache Pain 19, 49 (2018).
43. Magon, S. et al. Cortical abnormalities in episodic migraine: A multi-center 3T MRI study. Cephalalgia 39, 665–673 (2019).
44. Moulton, E. A. et al. Painful heat reveals hyperexcitability of the temporal pole in interictal and ictal migraine States. Cereb. Cortex.
21, 435–448 (2011).
45. Stankewitz, A., Aderjan, D., Eippert, F. & May, A. Trigeminal nociceptive transmission in migraineurs predicts migraine attacks.
J. Neurosci. 31, 1937–1943 (2011).
46. Russo, A. et al. Pain processing in patients with migraine: An event-related fMRI study during trigeminal nociceptive stimulation.
J. Neurol. 259, 1903–1912 (2012).
47. Schwedt, T. J. et al. Enhanced pain-induced activity of pain-processing regions in a case-control study of episodic migraine.
Cephalalgia 34, 947–958 (2014).
48. Mehnert, J., Schulte, L., Timmann, D. & May, A. Activity and connectivity of the cerebellum in trigeminal nociception. Neuroimage
150, 112–118 (2017).
49. Siegel, P. & Wepsic, J. G. Alteration of nociception by stimulation of cerebellar structures in the monkey. Physiol. Behav. 13, 189–194
(1974).
50. Moulton, E. A., Schmahmann, J. D., Becerra, L. & Borsook, D. The cerebellum and pain: Passive integrator or active participator?.
Brain Res. Rev. 65, 14–27 (2010).
51. Moulton, E. A. et al. Aversion-related circuitry in the cerebellum: Responses to noxious heat and unpleasant images. J. Neurosci.
31, 3795–3804 (2011).
52. Saab, C. Y. & Willis, W. D. Cerebellar stimulation modulates the intensity of a visceral nociceptive reflex in the rat. Exp. Brain Res.
146, 117–121 (2002).
53. Goldberger, A. L., Peng, C. K. & Lipsitz, L. A. What is physiologic complexity and how does it change with aging and disease?.
Neurobiol. Aging 23, 23–26 (2002).
Scientific Reports | (2021) 11:18701 | https://doi.org/10.1038/s41598-021-98213-3 10
Vol:.(1234567890)www.nature.com/scientificreports/
54. Coppola, G., Di Lorenzo, C., Schoenen, J. & Pierelli, F. Habituation and sensitization in primary headaches. J. Headache Pain 14,
65 (2013).
55. Coppola, G., Pierelli, F., Schoenen, J., Wang, S.-J. & Chen, W.-T. Neurophysiological Model of Migraine Pathophysiology: Bringing
the Past into the Future 223–236 (Springer, 2021).
56. Rasmussen, A. H. et al. Functional gene networks reveal distinct mechanisms segregating in migraine families. Brain 143, 2945–
2956 (2020).
57. de Tommaso, M. et al. Altered processing of sensory stimuli in patients with migraine. Nat. Rev. Neurol. 10, 144–155 (2014).
58. ICHD. Headache Classification Committee of the International Headache Society (IHS) The International Classification of Head-
ache Disorders, 3rd edition. Cephalalgia 38, 1–211 (2018).
59. Talairach, J. & Tournoux, P. Co-planar Stereotaxic Atlas of the Human Brain (Georg Thieme Verlag, 1988).
60. Andersson, J. L. R., Skare, S. & Ashburner, J. How to correct susceptibility distortions in spin-echo echo-planar images: Application
to diffusion tensor imaging. Neuroimage 20, 870–888 (2003).
61. Andersson, J. L. R. & Sotiropoulos, S. N. An integrated approach to correction for off-resonance effects and subject movement in
diffusion MR imaging. Neuroimage 125, 1063–1078 (2016).
62. Jenkinson, M., Bannister, P., Brady, M. & Smith, S. Improved optimization for the robust and accurate linear registration and
motion correction of brain images. Neuroimage 17, 825–841 (2002).
63. Smith, S. M. Fast robust automated brain extraction. Hum. Brain Mapp. 17, 143–155 (2002).
64. Bastiani, M. et al. Automated quality control for within and between studies diffusion MRI data using a non-parametric framework
for movement and distortion correction. Neuroimage 184, 801–812 (2019).
65. Boes, A. D. et al. Connectivity of sleep- and wake-promoting regions of the human hypothalamus observed during resting wake-
fulness. Sleep 41, 9 (2018).
66. Allen, E. A. et al. Tracking whole-brain connectivity dynamics in the resting state. Cereb. Cortex 24, 663–676 (2014).
67. Calhoun, V. D., Adali, T., Pearlson, G. D. & Pekar, J. J. A method for making group inferences from functional MRI data using
independent component analysis. Hum. Brain Mapp. 14, 140–151 (2001).
68. Porcaro, C., Zappasodi, F., Rossini, P. M. & Tecchio, F. Choice of multivariate autoregressive model order affecting real network
functional connectivity estimate. Clin. Neurophysiol. 120, 436–448 (2009).
69. Calhoun, V. D., Adali, T., Pearlson, G. D. & Pekar, J. J. Spatial and temporal independent component analysis of functional MRI
data containing a pair of task-related waveforms. Hum. Brain Mapp. 13, 43–53 (2001).
70. Griffanti, L. et al. Hand classification of fMRI ICA noise components. Neuroimage 154, 188–205 (2017).
71. Smits, F. M. et al. Electroencephalographic fractal dimension in healthy ageing and Alzheimer’s disease. PLoS ONE 11, e20154
(2016).
Acknowledgements
The contribution of the G.B. Bietti Foundation in this paper was supported by the Italian Ministry of Health
and Fondazione Roma.
Author contributions
C.P. analyzed the recordings and made substantial contributions to drafting the manuscript; G.D.L. performed
the sample size calculation and the statistical analysis; A.D.R., E.T., V.P., F.C., M.F., C.D.L., V.D.P., and F.P. were
involved in recruiting and performing the recordings; G.C. made substantial contributions in drafting the manu-
script; G.D.L., and S.S. was implied in drafting the manuscript.
Competing interests
The authors declare no competing interests.
Additional information
Correspondence and requests for materials should be addressed to G.C.
Reprints and permissions information is available at www.nature.com/reprints.
Publisher’s note Springer Nature remains neutral with regard to jurisdictional claims in published maps and
institutional affiliations.
Open Access This article is licensed under a Creative Commons Attribution 4.0 International
License, which permits use, sharing, adaptation, distribution and reproduction in any medium or
format, as long as you give appropriate credit to the original author(s) and the source, provide a link to the
Creative Commons licence, and indicate if changes were made. The images or other third party material in this
article are included in the article’s Creative Commons licence, unless indicated otherwise in a credit line to the
material. If material is not included in the article’s Creative Commons licence and your intended use is not
permitted by statutory regulation or exceeds the permitted use, you will need to obtain permission directly from
the copyright holder. To view a copy of this licence, visit http://creativecommons.org/licenses/by/4.0/.
© The Author(s) 2021
Scientific Reports | (2021) 11:18701 | https://doi.org/10.1038/s41598-021-98213-3 11
Vol.:(0123456789)You can also read