Icings and groundwater conditions in permafrost catchments of northwestern canada
←
→
Page content transcription
If your browser does not render page correctly, please read the page content below

www.nature.com/scientificreports

            OPEN           Icings and groundwater conditions
                           in permafrost catchments of
                           northwestern Canada
                           Hugo Crites1, Steve V. Kokelj2 & Denis Lacelle1*
                           Icings are sheet-like masses of ice that form on the ground surface or in fluvial channels from
                           groundwater seepage. Although the presence of icings in the landscape is known, few studies
                           investigated their regional distribution and explored relations with terrain factors including permafrost
                           and winter baseflow conditions. Here, we mapped the distribution of icings in a 618,430 km2 area
                           of northwestern Canada from a stack of 573 Landsat imageries (1985–2017) and determined using
                           hydrometric data the winter baseflow contribution to the total annual discharge of 17 rivers in the study
                           area. The 1402 mapped icings occur preferentially at the foothills of heavily faulted karstic mountainous
                           regions in the continuous permafrost. Winter baseflow and its contribution to annual discharge was
                           lower in continuous permafrost catchments than in discontinuous permafrost but showed a general
                           increase over the 1970–2016 period. As such, the distribution of icings appears to be sensitive to
                           winter air temperatures and winter baseflow conditions and icings located at the southern boundary of
                           continuous permafrost would be more sensitive to degrading permafrost and the predicted increase in
                           winter baseflow.

                           Permafrost and hydrology are coupled components in many Arctic systems1–4. In northwestern Canada and
                           Alaska, warming climate has caused an increase in active layer thicknesses and permafrost temperatures5–7,
                           which have affected hydrological processes. For example, the recent reduction in the area of ponds and lakes in
                           discontinuous permafrost has been associated with an increase in sub-subsurface drainage and connectivity8,9.
                           Additionally, despite little change in total annual discharge10,11, there is evidence from gauging stations of an
                           increase in winter baseflow for many rivers12–14. These changing permafrost and groundwater conditions may
                           affect seasonal ice formation from the freezing of groundwater seeping to the surface such as icings, also known
                           as naled or aufeis. The sustained groundwater flow that form these features provide critical habitats for overwin-
                           tering of certain fish species, including the Dolly Varden char15–17 and are a source of perennial drinking water
                           for some northern communities18. Icings can also store large amounts of ice that progressively melts during the
                           summer and recharge local streams and rivers long after the melt of late-lying snowbanks.
                               Icings are horizontal to sub-horizontal sheet-like ice mass that develop during winter on the surface by the
                           freezing of groundwater that repeatedly or continuously seep from the supra-permafrost (ground icings), from
                           a spring (spring icings), or that emerges from below the river ice (river icings)19–22. Icings have been reported in
                           all Arctic regions23–28 and studies have focused on their morphological characteristics22, their development and
                           energy balance22,29,30, their seasonal and perennial contributions to fluvial discharge31 and groundwater recharge
                           conditions18,32. Spring icings commonly form in places where the perennial groundwater flow through a talik is
                           forced to the surface by a reduction in aquifer permeability due to permafrost that impedes sub-surface flow19,22,33.
                           In similar fashion, river icings form in places along fluvial channels where baseflow is sufficiently restricted by
                           the freezing along a cross-section of the channel caused by either a change in channel gradient or in thickness of
                           alluvial sediments19,22,33. Spring and river icings tend to occur at the same location year after year, generally with
                           the same shape, and to be larger than ground icings which have a more random spatial and temporal recurrence
                           in the landscape19,22,33,34. Given the strong linkage between icings and groundwater flow, insights on the response
                           of icings under degrading permafrost and changing groundwater conditions may be gained by investigating their
                           distribution in the landscape and relations with terrain and winter discharge conditions.

                           1
                             Department of Geography, Environment and Geomatics, University of Ottawa, Ottawa, ON, Canada. 2Northwest
                           Territories Geological Survey, Government of Northwest Territories, Yellowknife, NWT, Canada. *email: dlacelle@
                           uottawa.ca

Scientific Reports |   (2020) 10:3283 | https://doi.org/10.1038/s41598-020-60322-w                                                             1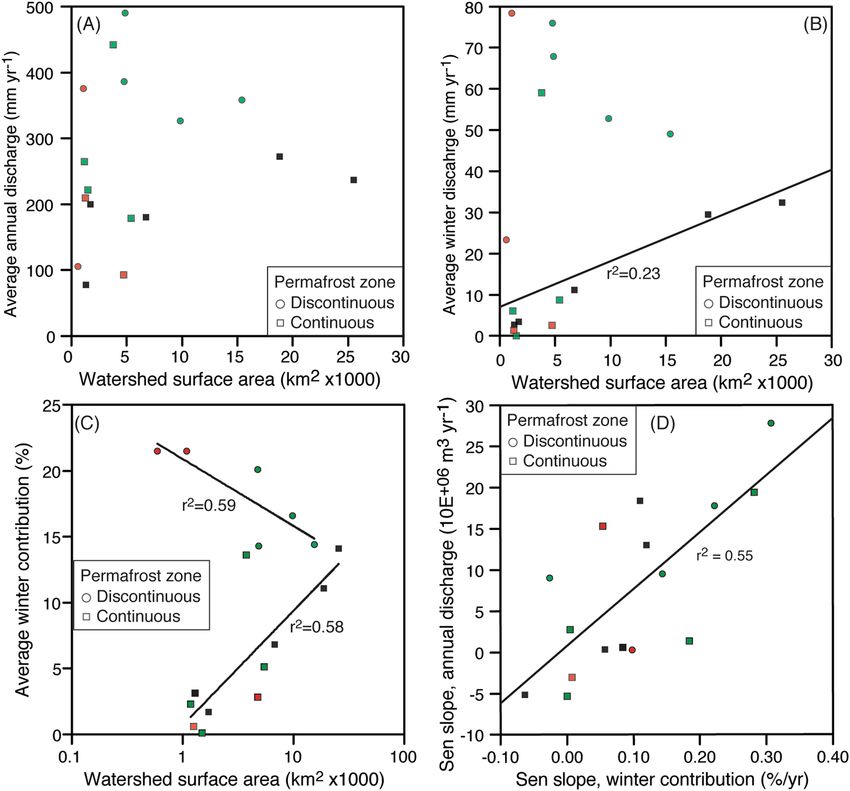
www.nature.com/scientificreports/                                                             www.nature.com/scientificreports

                           Figure 1. Icing occurrence in northwestern Canada. The icings were identified using a semi-automated
                           approach and a dense stack of Landsat imageries. Active gauging stations and level-3 watersheds are also
                           showed (see Table 1 for gauging station names). Digital elevation model (DEM) background derived from 30 m
                           Canadian Digital Elevation Data (www.geogratis.ca). Map generated using ArcGISv10.

                               The objectives of this study are to: (1) map using a semi-automated approach the distribution of spring and
                           river icings in northwestern Canada from a dense stack of Landsat imageries (1985–2017); (2) determine using
                           the Environment Canada historical hydrometric data the winter baseflow contribution to the total annual dis-
                           charge of rivers in the study area and their temporal trends (1970–2016). Based on the results, relations between
                           the distribution of icings, terrain and winter baseflow conditions were explored which can inform about the
                           response of icings to changing permafrost and groundwater conditions.

                           Study area
                           The study region in northwestern Canada ranges from 62 to 69°N and from 118 to 140°W; covering an area of
                           about 618,430 km2 (Fig. 1). Elevations range from sea level along the Beaufort Sea coastline to 2920 m a.s.l. in
                           the Mackenzie Mountains, with nearly 50% of the study area located below 400 m a.s.l. A total of 28 ecoregions
                           are found within the study area; the northern sector includes low-lying alluvial and glaciated terrain (Mackenzie
                           Delta and various plains), fluvially-incised moraines (Peel Plateau) and the Richardson and Brooks mountain
                           ranges. The southern sector is more mountainous and includes the Mackenzie, Selwynn and Ogilvie mountains.
                           The geology of the study area is predominantly composed of lower Cretaceous sandstone-conglomerate-shale and
                           siliclastic rocks, Jurassic shale-siltstone, Carboniferous limestone-dolomite, Permian clastic and carbonate rocks
                           and Cambrian to Silurian limestone35. The surficial geology is quite varied with mainly fine-grained glacial depos-
                           its in glaciated regions and colluvial deposits at the bottom of hillslopes; colluvium and bedrock are commonly
                           found at higher elevation36,37. Vegetation range from tundra in the northern plains and mountainous regions to
                           boreal forest in the southern region. Wetlands and peatlands are also common features on poorly drained lacus-
                           trine sediments and become more common southward in the Mackenzie Valley38.
                                The climate in the study area is characterized by a subarctic climate regime with cold winters and cool sum-
                           mers. The nine climate stations in the study area report mean annual air temperature (MAAT) for the period
                           1980–2010 ranging from near −0.7 °C at Fort Simpson in the southern region to near −10.5 °C at Tuktoyaktuk
                           in the north. The temperature conditions throughout the mountainous region are not well documented; how-
                           ever temperature inversions leading to colder winter temperatures in the valley bottoms probably occur39. Since
                           1980, the northern region has experienced a warming trend of 0.07 to 0.11 °C yr−1, whereas the more southern
                           region experienced a warming of 0.01 to 0.07 °C yr−1; with four stations showing a significant trend at
www.nature.com/scientificreports/ www.nature.com/scientificreports
Annual Winter Sen slope, winter Sen slope, annual
Map Period of Drainage discharge contribution contribution (% discharge (m3
ID Station ID Station name record area (km2) (mm) (%) yr−1) yr−1)
1 09DA001 Hess River above Emerald Creek 1977–2016 4840 491 14.3 0.144+ 9.5E + 06
2 09DB001 Beaver River below Matson Creek 1996–2016 4770 387 20.1 0.222 1.8E + 07
3 09EA004 North Klondike River near the mouth 1975–2016 1090 377 21.5 0.098 3.1E + 05
4 09FA001 Whitestone River near the mouth 1979–2016 6730 180 6.8 -0.063 −5.2E + 06
5 09FB002 Eagle River at Dempster Highway bridge 1945–2016 1720 200 1.7 0.057+ 3.5E + 05
6 10MA001 Peel River above Canyon Creek 1970–2016 25500 237 14.1 0.110* 1.8E + 07+
7 10MA002 Ogilvie River at km197.9 Dempster Highway 1975–1996 5410 179 5.1 0.005 2.7E + 06
8 10MA003 Blackstone River near Chapman Lake airstrip 1984–1995 1180 265 2.3 0.046 1.9E + 06
9 10MB004 Bonnet Plume River above Gillespie Creek 1981–1994 3760 442 13.6 0.282 1.9E + 07
10 10MD002 Babbage River below Caribou Creek 1978–1994 1500 221 0.1 0 −5.3E + 06
11 10GA001 Root River near the mouth 1975–2016 9820 327 16.6 0.307*** 2.8E + 07*
12 10HB005 Redstone River 63 km above the mouth 1980–1995 15400 359 14.4 −0.026 9.0E + 06
13 10JD002 Whitefish River near the mouth 1978–1991 4740 93 2.8 0.054 1.5E + 07
14 10LA002 Arctic Red River near the mouth 1974–2016 18800 272 11.1 0.120*** 1.3E + 07
15 10LC003 Rengleng River below highway no. 8 1976–2016 1300 78 3.1 0.084** 6.1E + 05
16 10LC007 Caribou creek above highway no. 8 1975–2016 590 106 21.5 0.974*** 7.2E + 05*
17 10MC007 Rat River near Fort McPherson 1981–1990 1260 210 0.6 0.008 −3.0E + 06
Table 1. Gauging stations in study area, winter contribution to total annual discharge, and trend analysis
results. Map ID corresponds to gauging stations on Fig. 1. Level of significance of trend: + (0.1) *(0.05) **(0.01)
***(0.001).
Permafrost is continuous in the northern plains and higher elevations in mountainous regions (55% of study
area)40,41. Extensive discontinuous permafrost occurs at lower latitudes and elevations (40% of the study area)40,41.
Mean annual ground temperatures (2013–2015) in the discontinuous permafrost zone ranged between −2
and 0 °C with colder temperatures in the continuous permafrost zone (−6 to −4 °C). Permafrost temperatures
between 2007 and 2015 along the Wrigley and Fort Good Hope corridor (63 to 66°N) showed an increase of
0.02–0.03 °C y−1 while further north in the Mackenzie valley changes in ground temperature have been closer to
0.1 °C per year42,43.
The study area includes 55 level-three watersheds and most of the rivers are characterized by sub-arctic to arc-
tic nival flow regime. Gauging records of 23 rivers in NWT over the 1977–2007 period showed that winter base-
flow contributes 1.2–87% to the total annual discharge, with the majority (20 out of the 23 stations) experiencing
an increase in winter baseflow contribution (0.5–271% yr−1)14. Similar observations between 1949 and 2005 were
made for 21 gauging stations in the Yukon River basin where groundwater contributed 4.7–47.4% of the total
annual discharge and with an increase of 0.4–2.6% yr−112. It was suggested that the increase in groundwater con-
tribution was attributed to permafrost degradation in response to warming air temperature12.
The presence of permafrost largely restricts groundwater recharge to places where fractured bedrock, sink-
holes or dissolution channels are exposed at the surface44. In the central Mackenzie Valley (Smith Creek, White
Sand Creek and Gayna rivers) and northern Yukon (Fishing Branch and Firth rivers), groundwater is recharged
mostly from Fall precipitation through saturated organic soils with no advection of heat to the subsurface32,45. A
similar recharge system has also been described for the North Klondike watershed in YT46. Based on noble gas
and isotope geochemistry, groundwater circulation times in the study area were found to be in the order of two
to three decades45. The groundwater mostly discharge through overburden but direct discharge via fissures in
exposed bedrock and talus has been observed where bedrock intersects the surface due to folding or if the unit is
intersected by a fault. Although folding is the predominant structural style in the Mackenzie Mountains, thrust
faults remain important for groundwater flow47.
Results
Distribution of icings in northwestern Canada. In the study area, a total of 1402 icings with >30%
annual occurrence between 1985–2017 were identified (although most occurred annually) (Fig. 1). Known icing
occurrences in Tombstone Territorial Park and in northern YT and adjacent NWT were identified in the map-
ping (i.e., ref. 24). Additionally, a comparison with late-winter high-resolution imagery confirmed the presence of
icings in the Sahtu highlands and on the Hare Indian river (Fig. S1). The average surface area of the icings was 0.2
km2 and a total of 19 icings had surface areas greater than 2 km2 (Fig. 2a). These mega icings account for 21% of
the total icing area in the mapped region. The cumulative surface area of icings is 277 km2 and accounts for 0.04%
of the study area. Due to the pixel resolution of the Landsat images (30 m), featureswww.nature.com/scientificreports/ www.nature.com/scientificreports
likely to occur in mountainous regions by factors of 2.9 to 1.3: the Mackenzie (factor of 2.9), followed by the
North Ogilvie (2.0×), British-Richardson (1.4×) and Selwynn mountains (1.3×); the plains contained the low-
est likelihood of icing occurrence (www.nature.com/scientificreports/ www.nature.com/scientificreports
Figure 2. Frequency distribution of mapped icings in northwestern Canada. (A) Surface area of icings. (B)
Histogram showing the normalized frequency distribution of icings with respect to elevation in study area in
100 m elevation bins. (C) Histogram showing the normalized frequency distribution of icings with respect to
ecoregions. (D) Histogram showing the normalized frequency distribution of icings with respect to permafrost
zones (c = continuous; d = discontinuous). (E) Histogram showing the distance between icings and the closest
geological fault in 1 km bin interval. (F) Histogram showing the normalized frequency distribution of icings
with respect to surficial geology. (G) Histogram showing the normalized frequency distribution of icings with
respect to watersheds.
because the low winter air temperatures, presence of frozen ground and winter baseflow conditions favours their
development. In the study area, the freezing-degree days ranges from about 3700 in the southern region to about
4500 in the northern region (ref. 49 https://climateatlas.ca/). As such the winter air temperature in the continuous
permafrost zone increases length and severity of the freezing season and the likelihood that baseflow will be
impeded in braided fluvial channels allowing for the development of icings24,47. It has also been suggested that the
persistence of icings during the summer can cause lower ground temperatures in their vicinity than the surround-
ing landscape, which may create a positive feedback, promoting the development of icings during the following
winter22. The lower abundance of icings in discontinuous permafrost catchments cannot be explained by the
Scientific Reports | (2020) 10:3283 | https://doi.org/10.1038/s41598-020-60322-w 5www.nature.com/scientificreports/ www.nature.com/scientificreports
Figure 3. Number and extent of icings within their watersheds. Scatter plots of watershed surface area relative
to (A) number of icings in the watershed; (B) mean surface area of icings in the watershed; (C) maximum
surface area of icing in the watershed; (D) cumulative surface area of icings in the watershed. Linear trend lines
are shown for statistically significant relations (P < 0.1).
absence of perennial springs since many springs have been identified in the discontinuous permafrost zone50.
However, the rivers in the discontinuous permafrost zone typically have higher winter baseflow and winter con-
tribution to total annual discharge relative to those in continuous permafrost (Fig. 4). It is thus plausible that
higher winter baseflow combined with convective heat exchange of the flowing water and a lower freezing-degree
days prevents freezing of the river to its bed to impede baseflow. The absence of icings during years with higher
winter baseflow was observed along the Fishing Branch by the inhabitants of Old Crow (i.e., ref. 24). A first order
assessment of the winter baseflow conditions that support the development of spring and river icings can be made
from the winter discharge in their respective watersheds. Our results suggest that icings are generally found in
continuous permafrost watersheds with: (1) winter flowwww.nature.com/scientificreports/ www.nature.com/scientificreports
Figure 4. Hydrometric data of gauging stations in northwestern Canada separated by permafrost zone.
(see Table 1 for list of stations). (A) Relation between annual discharge and watershed area in continuous
and discontinuous permafrost. (B) Relation between winter discharge and drainage area in continuous and
discontinuous permafrost. (C) Relation between winter discharge contribution to total annual discharge and
drainage area in continuous and discontinuous permafrost. (D) Relation of Sen slope trend between total
annual discharge and winter contribution. Note: Red symbol = no icings in the watershed; Green symbol =
icings along the river with a gauging station; Black symbol = icings in the watershed but not along the river on
which the gauging station is found. Linear trend lines are shown for statistically significant relations (P < 0.1).
with sun spot number, PDO and AO revealed that only a few stations had significant relations at thewww.nature.com/scientificreports/ www.nature.com/scientificreports
Figure 5. Fraction of winter baseflow stored in icings. The volume of water stored in the icings that is derived
from winter baseflow contribution to total annual discharge was calculated for the eight icings (out of the 1402
ones) that have a gauging station along the river. The calculation is corrected for volume of water stored in the
icings and assumes icing thickness of 2.5 m. The fraction of winter baseflow stored in icings (Iwb) was calculated
( )
from: Iwb(%) = (Isa × It )/ Dw + Isa × It × 100 where, Isa = surface area of icing (m2), It = thickness of icing
Da
(m), Dw = winter discharge (m3), Da = total annual discharge (m3).
Methods
Mapping of icings. To map the distribution of spring and river icings in northwestern Canada, 573 level-2
Landsat images acquired between 1985–2017 and corrected for possible anisotropy in reflectance distribution
created by large and mountainous areas were obtained from ESPA level-2 (https://espa.cr.usgs.gov). All images
selected for analysis had a low cloud coverage (≤ 20%) and acquisition dates between May 1st and June 30th. The
late spring-early summer corresponds to a period when most of the snow has melted from the landscape and
icings are more easily identifiable on the imagery. The list of path/row Landsat scenes is provided in Table S2.
The methodology uses a dense stack of Landsat 5 TM Landsat 7 ETM + imageries and follows a semi-automated
approach established around Yellowknife (NWT)34, but modified for the study area with varied physiographic char-
acteristics (Fig. S5). The mapping was done in ArcGIS 10.5 using Python scripts and involved a series of steps using
the Landsat LT2 images. The Normalized Difference Snow Index (NDSI) was first calculated to discriminate snow,
ice and water from bare soils and clouds. The Maximum Difference Ice Index (MDII) was then calculated on the
thresholded-NDSI rasters to differentiate ice, water, snow and wet marl. Following these two steps, late-lying snow-
banks at higher elevations in the Mackenzie Mountains, the Ogilvie Mountains, British-Richardson Mountains
and the Selwynn Mountains were still being classified as ice. The snowbanks at high elevation were thus removed
from the classification by creating a Topographic Position Index (TPI), a measure of terrain ruggedness and local
elevation index, that defines hilltops, slopes and valley bottoms. The TPI values between < −5 and > +5 were used
to mask late-lying snow on hilltops and slopes (mainly north-facing slopes). The approach was successful in remov-
ing most of the snow; however, snow still remained along some slopes and elevated plateaus. As icings tend to
develop in valley bottoms along stream/river channels19, we thus created a slope mask (slopes>30°) to remove these
snow patches. Following the application of the TPI and slope mask, mainly late-lying spring to early summer ice
remained on the imageries; some noise was removed manually. Finally, the lake and river ice was removed using a
Normalized Difference Water Index (NDWI) from mid-summer cloud-free scenes58. Pixels classified as water were
digitized into polygons shapefiles using the Raster to Polygon tool. However, multiple braided rivers are present
in the mountain ranges located west of the Mackenzie River and these can contain icings. Therefore, the NDWI
was only applied to the flatter area east of the Mackenzie River. In addition, topographic shadows were being clas-
sified as water bodies by the water index. However, when exploring the pixel values of shadows and water bodies
in the thermal band, values were much higher for water bodies than in the shaded areas. Hence, a thresholding
value>105 in the thermal band was selected to remove shadows from the water mask. Finally, processes that are
not icing-related are sometimes responsible for substantial snow and ice accumulation along the shorelines of rivers
and lakes past the snowmelt period. This remnant ice and snow was eliminated from the classification by growing
the water mask outwards by 1.5 times the pixel resolution34.
Following these steps, each scene resulted in a binary raster; where 0 indicated “no ice” and 1 indicated ice. To
calculate icing recurrence, a raster containing the total image count for a given Landsat extent was created and
used to normalize the dataset across the study area as the number of scenes varied between Landsat extents. To
obtain percentage of recurrence, binary rasters from a stack were added together using the Raster Calculator and
then divided by the amount of scenes in that stack. Using the Raster to Polygon tool, icing polygons were then
created from the recurrence map; pixels with a value>30% were selected (note, the option Simplify Polygons was
Scientific Reports | (2020) 10:3283 | https://doi.org/10.1038/s41598-020-60322-w 8www.nature.com/scientificreports/ www.nature.com/scientificreports
not selected in order to retain the pixel’s edge). Polygon attributes such as centroid, coordinates surface area were
calculated with the Calculate Geometry function.
The identification of spring and river icings is limited by the pixel resolution of the Landsat images (30 m)
and featureswww.nature.com/scientificreports/ www.nature.com/scientificreports
16. Stewart, D. B., Mochnacz, N. J., Sawatzky, C. D., Carmichael, T. J. & Reist, J. D. Fish life history and habitat use in the Northwest
Territories: bull trout (Salvelinus confluentus). Can. Manuscr. Rep. Fish. Aquat. Sci. 2801 46 p. + Appendices (2007).
17. Mochnacz, N. J., Bajno, R., Reist, J. D., Low, G. & Babaluk, J. A. Distribution and biology of Bull Trout (Salvelinus confluentus) in the
Mackenzie Valley, Northwest Territories, with notes on sympatry with Dolly Varden (Salvelinus malma). Arctic 66, 79–93 (2013).
18. Clark, I. D., Lauriol, B., Harwood, L. & Marschner, M. Groundwater Contributions to Discharge in a Permafrost Setting, Big Fish
River, N.W.T., Canada. Arctic, Antarct. Alp. Res. 33, 62 (2001).
19. Carey, K. L. Icings developed from surface water and ground water. US Army Cold Reg. Res. Eng. Lab. Monogr. III-D3 (1973).
20. Pollard, W. & van Everdingen, R. O. Formation of seasonal ice bodies. in Periglacial Geomorphology (eds. Dixon, J. C. & Abrahams,
A. D.) 281–304 (Wiley, 1992).
21. Pollard, W. H. Icing processes associated with high Arctic perennial springs, Axel Heiberg Island, Nunavut, Canada. Permafr.
Periglac. Process. 16, 51–68 (2005).
22. Harden, D., Barnes, P. & Reimnitz, E. Distribution and character of naleds in northeastern Alaska. Arctic 30, 28–40 (1977).
23. Heldmann, J. L., Pollard, W. H., Mckay, C. P., Andersen, D. T. & Toon, O. B. Annual Development Cycle of an Icing Deposit and
Associated Perennial Spring Activity on Axel Heiberg Island, Canadian High Arctic. Arctic, Antarct. Alp. Res. 37, 127–135 (2005).
24. Lauriol, B., Cinq Mars, J. & Clark, I. D. Localisation, Genese et Fonte de Quelques Naleds du Nord du Yukon (Canada). Permafr.
Periglac. Process. 2, 225–236 (1991).
25. Lacelle, D., Lauriol, B. & Clark, I. D. Effect of chemical composition of water on the oxygen-18 and carbon-13 signature preserved
in cryogenic carbonates, Arctic Canada: Implications in paleoclimatic studies. Chem. Geol. 234, 1–16 (2006).
26. Tolstikhin, N. I. & Tolstikhin, 0. N. Groundwater and surface water in the permafrost region. (1976).
27. Veillette, J. J. & Thomas, R. D. Icings and seepage in frozen glaciofluvial deposits, District of Keewatin, N.W.T. Can. Geotech. J. 16,
789–798 (1979).
28. Akerman, H. J. Studies on naledi (icing) in West Spitsbergen. in Fourth Canadian Permafrost Conference 189–202 (National Research
Council of Canada, 1982).
29. Hu, X. & Pollard, W. H. J. L. Energy exchange during river icing formation in a subarctic environment, Yukon Territory, Canada.
Géographie Phys. Quat. 2, 1–12 (1999).
30. Hu, X. & Pollard, W. H. The Hydrologic Analysis and Modelling of River Icing Growth, North Fork Pass, Yukon Territory, Canada.
Permafr. Periglac. Process. doi:10.1002/(sici)1099-1530(199709)8:33.0.co;2-7 (1997).
31. Clark, I. D. & Lauriol, B. Aufeis of the Firth River Basin, Northern Yukon, Canada: Insights into permafrost hydrogeology and karst.
Arct. Alp. Res. 29, 240–252 (1997).
32. Utting, N., Clark, I., Lauriol, B., Wieser, M. & Aeschbach-Hertig, W. Origin and Flow Dynamics of Perennial Groundwater in
Continuous Permafrost Terrain using Isotopes and Noble Gases: Case Study of the Fishing Branch River, Northern Yukon, Canada.
Permafr. Periglac. Process. 23, 91–106 (2012).
33. Woo, M. Permafrost Hydrology. (Springer, 2012). doi:10.1007/978-3-642-23462-0
34. Morse, P. D. & Wolfe, S. A. Geological and meteorological controls on icing (aufeis) dynamics (1985 to 2014) in subarctic Canada. J.
Geophys. Res. Earth Surf. 120, 1670–1686 (2015).
35. Norris, D. K. Geology of the northern Yukon and northwestern District of Mackenzie. (Geological Survey of Canada, map 1581A,
scale 1:500,000, 1985).
36. Aylsworth, J. M. et al. Surficial geology, subsurface materials, and thaw sentivity of sediments. Bull. Geol. Surv. Canada 41–48 (2001).
37. Côté, M. M., Duchesne, C., Wright, J. F. & Ednie, M. Digital compilation of the surficial sediments of the Mackenzie Valley corridor,
Yukon Coastal Plain, and the Tuktoyaktuk Peninsula. 38. https://doi.org/10.4095/292494 (2013)
38. Tarnocai, C. & Zoltai, S. C. Wetlands of arctic Canada. Wetl. Canada 29–53 (1988).
39. Lewkowicz, A. G., Bonnaventure, P. P., Smith, S. L. & Kuntz, Z. Spatial and thermal characteristics of mountain permafrost,
northwest canada. Geogr. Ann. Ser. A Phys. Geogr. https://doi.org/10.1111/j.1468-0459.2012.00462.x (2012).
40. Bonnaventure, P. P., Lewkowicz, A. G., Kremer, M. & Sawada, M. C. A Permafrost Probability Model for the Southern Yukon and
Northern British Columbia, Canada. Permafr. Periglac. Process. 23, 52–68 (2012).
41. Heginbottom, J., Dubreuil, M. & Haker, P. Canada permafrost, 1:7 500 000 scale. Natl. Atlas Canada, 5th Ed. Sheet MCR 4177 (1995).
42. Smith, S. L., Chartrand, J. & Duchesne, C. Report on 2017 field activities and collection of ground-thermal and active-layer data in
the Mackenzie corridor, Northwest Territories. https://doi.org/10.4095/313036 (2018)
43. Smith, S. L., Chartrand, J., Duchesne, C. & Ednie, M. Report on 2016 field activities and collection of ground thermal and active
layer data in the Mackenzie Corridor, Northwest Territories. https://doi.org/10.4095/306212 (2017)
44. van Everdingen, R. O. Morphology, hydrology and hydrochemistry of karst in permafrost terrain near Great Bear Lake, Northwest
Territories. (1981).
45. Utting, N., Lauriol, B., Mochnacz, N., Aeschbach-Hertig, W. & Clark, I. Noble gas and isotope geochemistry in western Canadian
Arctic watersheds: tracing groundwater recharge in permafrost terrain. Hydrogeol. J. 21, 79–91 (2012).
46. Lapp, A., Clark, I. D., Macumber, A. L. & Patterson, R. T. Hydrology of the North Klondike River: carbon export, water balance and
inter-annual climate influences within a sub-alpine permafrost catchment. Isotopes Environ. Health Stud. 53, 500–517 (2017).
47. Michel, F. A. Hydrogeology of central Mackenzie Valley. J. Hydrol. 85, 379–405 (1986).
48. RB, W., B, W., J, V., WC, D. & LP, G. Aufeis accumulations in stream bottoms in arctic and subarctic environ- ments as a possible indicator
of geologic structure. In Recent US Geological Survey studies in the Tintina Gold Province, Alaska, United States, Yukon, Canada: results of
a 5-year project. (eds. Gough, P. P. & Day, W. C.) (US Geological Survey Science Investigation Report 2007–5289, 2010).
49. Smith, S. L., Riseborough, D. W., Bonnaventure, P. P. & Duchesne, C. An ecoregional assessment of freezing season air and ground surface
temperature in the Mackenzie Valley corridor, NWT, Canada. Cold Reg. Sci. Technol. https://doi.org/10.1016/j.coldregions.2016.02.007
(2016)
50. Michel, F. A. Hydrogeology of the central Mackenzie Valley. J. Hydrol. 85, 379–405 (1986).
51. Svensmark, H. & Friis-Christensen, E. Variation of cosmic ray flux and global cloud coverage—a missing link in solar-climate
relationships. J. Atmos. Solar-Terrestrial Phys. 59, 1225–1232 (1997).
52. Carslaw, K. S. Cosmic Rays, Clouds, and Climate. Science (80-.). 298, 1732–1737 (2002).
53. Meehl, G. A., Arblaster, J. M., Matthes, K., Sassi, F. & van Loon, H. Amplifying the Pacific Climate System Response to a Small 11-
Year Solar Cycle Forcing. Science (80-.). 325, 1114–1118 (2009).
54. Baranova, N. Evaluating groundwater in a permafrost watershed using seasonal geochemical and isotope dicharge trends, Ogilvie
River, Yukon. (MSc thesis, University of Ottawa, 2017).
55. Prokoph, A., Adamowski, J. & Adamowski, K. Influence of the 11year solar cycle on annual streamflow maxima in Southern Canada.
J. Hydrol. 442–443, 55–62 (2012).
56. Bense, V. F., Ferguson, G. & Kooi, H. Evolution of shallow groundwater flow systems in areas of degrading permafrost. Geophys. Res.
Lett. 36, 2–7 (2009).
57. Burt, T. P. & Williams, P. J. Hydraulic conductivity in frozen soils. Earth Surf. Process. 9, 411–416 (1976).
58. McFeeters, S. K. The use of the Normalized Difference Water Index (NDWI) in the delineation of open water features. Int. J. Remote
Sens. 17, 1425–1432 (1996).
59. Kane, D. L. Physical mechanics of aufeis growth. Can. J. Civ. Eng. 8, 186–195 (1981).
60. Lin, A. & Wang, X. L. An algorithm for blending multiple satellite precipitation estimates with in situ precipitation measurements in
Canada. J. Geophys. Res. Atmos. 116 (2011).
Scientific Reports | (2020) 10:3283 | https://doi.org/10.1038/s41598-020-60322-w 10www.nature.com/scientificreports/ www.nature.com/scientificreports
Acknowledgements
This project was supported by a Natural Sciences and Engineering Research Council of Canada (NSERC)
Discovery Grant. We thank the two reviewers for their constructive comments on the manuscript.
Author contributions
H.C., S.V.K., D.L. conceived the study; H.C., D.L. carried out analyses. All authors discussed the results, edited
and commented on the manuscript.
Competing interests
The authors declare no competing interests.
Additional information
Supplementary information is available for this paper at https://doi.org/10.1038/s41598-020-60322-w.
Correspondence and requests for materials should be addressed to D.L.
Reprints and permissions information is available at www.nature.com/reprints.
Publisher’s note Springer Nature remains neutral with regard to jurisdictional claims in published maps and
institutional affiliations.
Open Access This article is licensed under a Creative Commons Attribution 4.0 International
License, which permits use, sharing, adaptation, distribution and reproduction in any medium or
format, as long as you give appropriate credit to the original author(s) and the source, provide a link to the Cre-
ative Commons license, and indicate if changes were made. The images or other third party material in this
article are included in the article’s Creative Commons license, unless indicated otherwise in a credit line to the
material. If material is not included in the article’s Creative Commons license and your intended use is not per-
mitted by statutory regulation or exceeds the permitted use, you will need to obtain permission directly from the
copyright holder. To view a copy of this license, visit http://creativecommons.org/licenses/by/4.0/.
© The Author(s) 2020
Scientific Reports | (2020) 10:3283 | https://doi.org/10.1038/s41598-020-60322-w 11You can also read