Identifying the Financial Risk Factors of Excessive Indebtedness of Rural Communes in Poland - MDPI
←
→
Page content transcription
If your browser does not render page correctly, please read the page content below
sustainability

Article
Identifying the Financial Risk Factors of Excessive
Indebtedness of Rural Communes in Poland
Aldona Standar 1          and Agnieszka Kozera 2, *
 1    Department of Economics and Economic Policy in Agribusiness, Faculty of Economics and Social Sciences,
      University of Life Sciences, Wojska Polskiego 28, 60-637 Poznan, Poland; standar@up.poznan.pl
 2    Department of Finance and Accounting, Faculty of Economics and Social Sciences, University of Life
      Sciences, Wojska Polskiego 28, 60-637 Poznan, Poland
 *    Correspondence: agnieszka.kozera@up.poznan.pl

 Received: 9 December 2019; Accepted: 18 January 2020; Published: 21 January 2020

 Abstract: The purpose of this paper is to identify the financial risk factors of excessive indebtedness
 of Polish rural communes. The objective of this research task is to verify the following research
 hypothesis: the main determinant of the risk of excessive indebtedness is the rural communes’
 own income potential. To meet the objective of this research, an empirical study was carried out
 in three steps. The first step of the research procedure was the analysis of the operation of Polish
 rural communes in the context of financial management. In the second step was the analysis of
 indebtedness of rural communes compared to other types of Polish administrative units in 2007–2017.
 The evolution of the level and share of total debt in total incomes of entities studied was analyzed, and
 the share of overindebted rural communes was identified. In the third step, a discriminatory analysis
 was performed to build a model able to forecast the financial risk factors of excessive indebtedness
 for Polish rural communes. The problem of increasing indebtedness can be observed in a growing
 number of communes and on an increasing scale in Poland. The discriminant analysis showed that
 the share of the operating surplus and own income in total income, as well as the amount of the EU
 funds per capita (in zlotys), are particularly significant. The study reveals that the smaller the share
 of the operating surplus in total income is as well as the greater the share of own income in total
 income and the amount of the EU funds in zlotys per capita are, the lower the value of the estimated
 discriminatory function is and the higher the risk of excessive indebtedness of a rural commune is.

 Keywords: communes; excessive indebtedness; financial risk; Poland; discriminant analysis

1. Introduction
     Along the lines of what is in place in other European countries, Polish government entities handle
only a part of local and regional tasks. In accordance with the principle of subsidiarity, the essential
part of tasks having no relevance from the countrywide perspective is performed by local government
units, namely, local authorities which are subordinate to, and represent the interests of, a local or regional
community. Since 1999, a three-level local government model has been in place in Poland, comprising
communes, districts, and voivodeships. As basic local government units (LGUs), the communes carry
out tasks of importance in the local context while the districts represent an intermediate level in charge of
supra-communal tasks. In turn, voivodeships, the largest entities in the country’s territorial division, carry
out regional tasks.
     To perform their tasks and functions, Polish local government entities access defined sources
of incomes, i.e., own incomes (including fiscal and non-fiscal income and property income) and
transferred incomes (targeted grants and state budget subsidies). The sources and structure of
LGU incomes are highly important for the implementation of their financial management tasks and

Sustainability 2020, 12, 794; doi:10.3390/su12030794                        www.mdpi.com/journal/sustainability
Sustainability 2020, 12, 794 2 of 25
policies. LGUs with certain own incomes from precisely defined sources are more autonomous and
better positioned to perform their tasks and functions, especially including expensive infrastructural
investments. Conversely, a considerable share of transferred incomes (grants, subsidies), largely based
on a discretionary allocation of funds by central authorities, restricts the LGUs’ financial autonomy. To
perform their own tasks, and, in particular, to implement infrastructure investments, local government
entities may access repayable sources of finance (including credit and loans).
When considering the basic entities of the Polish local government sector, attention should be paid to
rural communes, which represent the largest population of communes (1548 as at 1 November 2018, i.e.,
over 60% of all communes). In 2018, over 15 million people lived in rural areas in Poland. Rural communes
were inhabited by nearly 11 million people, i.e., as much as 30% of the total population [1]. The increase in
the total number of people inhabiting these areas results from the phenomenon of suburbanisation, which
has been observed in recent years. In view of this fact, local communities have growing needs, especially
for technical and social infrastructure. According to research carried out by many scientists, including
Kozera and Głowicka-Wołoszyn [2], the functional type of many rural communes is transforming from the
one characterised by the traditional agricultural function to the type with residential and service-providing
functions. At the local level, it is communes that are chiefly burdened with the financial costs of inhabitants’
growing needs. In order to implement different projects, rural communes often need to rely on EU funds
as their own income is limited. In Poland, the communes’ own income potential strictly depends on the
functional type they represent. Even though the own income potential of Polish rural communes becomes
increasingly higher, it still is the composite result of the demographic potential, local entrepreneurship, and
local economic conditions, especially the location rent. As regards many rural communes, low levels of
own income potential may be a barrier to socioeconomic development. This is because insufficient incomes
make it more difficult to access external funds, whether repayable or non-repayable (including from the
EU), which are determinant for the scope of communal investments and local development [3]. As a
result, they use repayable sources of financing. By using these funds, rural communes can function under
conditions where their income does not correspond to the costs of tasks implemented. Simultaneously, they
can maintain high standards of these tasks [4]. The difficult financial situation of local governments has a
negative influence on all citizens [5] and economic development in general [6–8]. Excessive indebtedness
of local government units, especially the rural communes whose financial independence is below the
average level in other administrative types of communes, may lead to the loss of financial liquidity or, in
extreme cases, it may even result in falling into a debt spiral [9]. Although according to Polish law, this
situation does not result in the bankruptcy of a local government unit, the state takes responsibility for
local finance. In view of this fact, it is necessary to apply different measures to prevent the occurrence of
this situation. For example, it is necessary to manage the debt adequately and identify the financial risk
factors of excessive indebtedness of local government units. Although these actions are not enforced by
law, they are the most important aspects of financial management [10]. In international literature, different
approaches to debt management procedures are presented, which would be worth looking into. Special
attention is paid to the need for a long-term approach to debt management [11–13].
However, a budget deficit cannot be regarded as a purely negative development. Its scale
(usually, the relative figures calculated in relation to budget incomes) and, first of all, its reasons
must be considered when assessing it [14]. Debt incurred by local government units to finance
ongoing expenditure should definitively be judged negatively and is a prohibited practice in certain
countries [15]. In accordance with the golden rule for a balanced budget, local government should not
undertake liabilities to finance their current tasks.
The risk of indebtedness is affected by factors related with administration, government, law, the
economic base of local government units, their general financial situation as well as the amount and
character of debt [16]. Kosak-Wojnar and Surówka [17] indicate that the activity of local government
units is characterised by the occurrence of different risks, including financial ones, which are related
with the methods of financing of the tasks implemented. One of them is the risk of excessive debt.
According to Filipiak [18], at present, it is caused not only by the fact that local government unitsSustainability 2020, 12, 794 3 of 25
implement an increasingly broad spectrum of tasks but also by the consequences of the economic
and financial crisis, the decreasing amount of own income. According to Standar [19], the risk is also
caused by the implementation of numerous projects co-financed from EU funds.
It should be noted that in the literature worldwide, especially in America, financial risks are
understood as economic distress [20], sometimes as fiscal health [21] and fiscal or financial stress [22].
A solution to this problem is greatly influenced by [23,24]. First, the problem is that local authorities
show little interest in this process. According to Kolha et al. [23], of the 50 states covered by their
study, only 15 rely on indicators to monitor the local financial conditions. Many of them use indicators
that fail to identify local problems before they become important. The above is related to the next
major issue involved in this research topic: the selection of indicators. During her research in
264 municipalities of the Chicago metropolitan area, Handrick [25] found that the analysis of fiscal
health is a complex concept whose dimensions, though interlinked, affect each other in an indirect
or non-linear manner. This means they must be measured separately rather than being combined
into a comprehensive indicator of fiscal standing. Another view is presented by Wang et al. [26] who
defined four dimensions of financial condition: dimensions in cash, budget, long-run and service-level
solvencies, and 11 financial condition indicators. In turn, Jones and Walker [24] proved the existence of
a relationship between incomes and population, on one side, and the emergence of fiscal hazards, on
the other. In the relevant literature, the third important aspect is tackled by Rivenbark and Roenigk [27].
They noted the importance of the decision to analyze, interpret, and present the financial condition to
selected officials and to see what management practices help in the analysis of financial conditions.
The recent interest in the issue of the financial risk of communes has increased, as evidenced by recent
research in all the world, e.g., in China—[28], in Hungary—[29], in Spain—[30], in Poland—[31].
The purpose of this paper is to identify the financial risk factors of excessive indebtedness of Polish
rural communes. The objective of this research task is to verify the following research hypothesis: the
main determinant of the risk of excessive indebtedness is the rural communes’ own income potential.
To meet the objective of this research, the empirical study was carried out in three steps. The first step
of the research procedure was the analysis of the operation of Polish rural communes in the context
of financial management. In the second step was the analysis of indebtedness of rural communes
compared to other types of Polish administrative units in 2007–2017. The evolution of the level and
share of total debt in total incomes of entities studied was analysed, and the share of overindebted
rural communes was identified. In the third step, a discriminatory analysis was performed to build a
model able to forecast the financial risk factors of excessive indebtedness for Polish rural communes.
This paper addresses the issues of public debt, which, in the theoretical sense, are a part of general
economic and public finance theories. Generally, there are two conflicting doctrines regarding debt.
According to the orthodox doctrine, debt is the consequence of defective financial management. In
turn, the interventionist doctrine claims that debt should be viewed as a positive development which
stimulates economic growth and makes investments financially feasible [16].
2. Materials and Methods
The empirical research was based on the database published by the Ministry of Finance [32] and
the Central Statistical Office of Poland [1]. The results are presented in Polish currency (the key data
was converted to euro as per the weighted average exchange rate of the National Bank of Poland,
which was from 3.52 EUR/PLN to 4.36 EUR/PLN [33]). In the first part of the research, basic methods
of descriptive statistics were used to process the empirical data collected from the database so as to
analyse the indebtedness of rural communes in Poland. The results were shown in boxplots. Tukey [34]
introduced the boxplot to exploratory data analysis. In the third part of the research, discriminant
analysis was used to build a model enabling prediction of excessive indebtedness of rural communes
and identification of chief financial factors causing the risk of excessive indebtedness of these entities.
This method was selected following a literature study and an attempt to build other models, e.g., a
logit model, which, however, failed to deliver satisfactory results for the discriminant analysis.Sustainability 2020, 12, 794 4 of 25
Discriminant analysis is a classification method that is categorised as both a method of multidimensional
statistical analysis and as a taxonomic method [35]. It is used for ordering and classification of economic
and financial phenomena according to many explanatory variables at the same time [36–38]. Several
assumptions needed to be verified in order to use this analysis. While the variables should follow a normal
distribution, the discriminatory analysis is tolerant to a moderate violation of this assumption in the case
of large samples. The model was built using Statistica software which checks the tolerance value [39,40].
Should that principle be violated, a wrong matrix message will be displayed, making it impossible to
continue the analysis. The next assumption is about the sample size. In this case, the number of variables
is adequate for the number of cases [40]. Because the discriminatory analysis is highly sensitive to outliers,
the variables were scanned for outlying observations, which were subsequently removed.
There are different methods for undertaking discriminant analysis. The most common linear
function was used to estimate the form of the discriminant model [41]:
Zlj = βo + β1 X1 + . . . + βk Xk (1)
where:
Zlj —dependent variable for j-th item (j = 1, 2, . . . , n) in l-th class (excessive debt—yes/no);
βo —discriminant function constant;
β1 , . . . , βk —discriminant function coefficients (i = 1, 2, . . . , k);
X1 , . . . , Xk —explanatory variables (i = 1, 2, . . . , k).
The objects under study are classified according to the estimated function value, which is usually
a combination of several financial indicators (cf. [40,42,43], which clearly differentiate (discriminate)
the collection of items. In order to allocate an item under study to a particular group, the discriminant
function value of the total value of products of variables and function parameters (i.e., the indicators’
weights) is compared with the limit value [44,45].
The discriminant function is a basic tool used in discriminant analysis. When adequate explanatory
variables are selected, the function can be used to allocate an item (e.g., a commune) to a particular group
of items [44,46]. As far as the prediction of financial factors causing the risk excessive indebtedness of
local government units is concerned, discriminant analysis can be used to divide the rural communes
under study into two separate classes: 0 and 1, referring to the communes unthreatened or threatened
by the risk of excessive debt (dependent variable). The main period covered by the discriminatory
model is 2012 to 2014. It was selected purposely because a large number of rural communes experienced
debt problems at that time. This situation was preceded by the public finance crisis, which had reduced
their incomes while intensifying pressure on the communes to make investments co-financed with
available EU funds. Two subsequent discriminative models for the periods 2007–2009 and 2015–2017
were developed in order to carry out a comparative analysis of the main financial factors behind
excessive indebtedness of Polish rural communes.
In our research, the rural communes, during the three years, where the average share of the total
debt in the total income was greater than 50%, were classified as the communes with excessive debt.
The authors of this paper defined the excessive indebtedness threshold as a situation where the ratio of
total liabilities to total income is 50%. Until the end of 2013, the total liabilities/total income ratio was
the official indebtedness indicator, and could not exceed 60% [47]. The authors set a more restrictive
level because even a ratio of 50% meant financial problems for local government units. First of all,
communes with such a high ratio of debt to total income had a poor credit rating, restricting their
ability to access repayable instruments (loans). Secondly, local government authorities with a lower
financial rating often relied on shadow-banking loans whose high interest rates posed a considerable
risk of sending them into a debt spiral in the next years. What also needs to be emphasized is that even
at the same level of debt (numerator), the ratio can vary in function of fluctuations in total income
(denominator), which could drive a further several percentage point increase in the ratio, resulting in
the commune going beyond the defined threshold.
A set of 18 financial indicators was used as explanatory variables showing the financial situation
and functioning of the local government units under study. They served as predictors of the riskSustainability 2020, 12, 794 5 of 25
of excessive indebtedness of local government units. The indicators recommended by the Ministry
of Finance and by experts in local finance [48] were selected (later in this paper, you may find
the characteristics of indicators taken into consideration when building the discriminatory model).
The selection was also based on an overview of the literature and previous studies concerning the
forecasting of the financial threat of local government units (cf. [43]). The variables were calculated
as average values (medians) for three-year periods and they characterised the financial condition
of local government units, especially referring to the financial independence and attractiveness of
these entities. The time frames of this study were selected purposely because, as mentioned earlier,
the communes considered reported the highest levels of debt at that time, translating into a risk of
excessive indebtedness. Having made the substantive selection of discriminant variables, they were
statistically verified. As a result of conducted statistical verification, due to a high correlation with the
other variables, eight variables were eliminated from further analysis. In consequence, the model was
based on the following ten variables (financial indicators) characterised by high discriminatory power:
— share of own incomes in total incomes (%, OI/TI) which reflects the financial independence from
the state budget and financial autonomy (the higher the ratio, the greater the local government’s
financial autonomy);
— the share of property (investment) expenditures in total incomes (%, PE/TI) showing the scale of
investments in relation to the entity’s income potential (the higher the ratio, the greater the focus
on development);
— share of remunerations and related expenditure in current expenditure (%, R/CE), a ratio which
shows the proportion between personnel costs and in-kind expenses, and therefore tells whether
the incomes are distributed properly;
— the level of property (investment) expenditure per capita in PLN (PE/M) showing the LGU’s
investment potential per inhabitant;
— fiscal wealth indicator per capita (in zlotys, FWI)—the indicator shows the commune’s income
potential, which is decisive to the economic power of local government units (The expenditure
capacity is determined especially by the amount of income from local taxes received by the
commune (agricultural tax, forest tax, property tax, vehicle tax, tax on civil law transactions,
tax from the tax card income, income from the exploitation fee), which indicates the scale of an
entity’s fiscal wealth [49]);
— the level of income from income taxes which are state budget incomes in PLN per capita (IT/M),
reflecting the residential and economic attractiveness of the LGU (the higher the ratio, the greater
the financial autonomy of the local government);
— the amount of EU funds accessed in PLN per capita (EU/M), showing the activity and effectiveness
of local authorities in accessing additional investment funds;
— the operating surplus in PLN per capita (OS/M), reflecting the financial standing of the commune:
its capacity to invest and incur debt;
— the share of operating surplus in total incomes (%, OS/TI), showing the part of the total income
potential accounted for by investment funds obtained primarily in the form of investment grants
and savings from the current part of the budget;
— self-financing ratio (SFR)—the ratio refers to the share of operating surplus and property income
in property expenditures. It indicates the extent to which a local government unit finances
investments with its own funds, i.e., the financing capacity. The higher the ratio is, the lesser is
the risk of losing financial liquidity due to excessive debt service costs. However, on the other
hand, if the ratio is high, it may also indicate a low implementation of investments in relation to
the potential of a particular local government unit.
Afterwards, the selected explanatory variables were standardized. Outliers (extreme values) were
eliminated from the data set, as they could considerably affect the results of research. As a consequence,
upon removal of outliers, 140 rural communes were found to be overindebted in 2012–2014. Thus, the mainSustainability 2020, 12, 794 6 of 25
discriminant model was based on 280 rural communes split into two equal groups. Group 1 consisted
of 140 communes with a ratio of total debt to total incomes beyond 50%; Group 2 was composed of 140
randomly selected communes which did not exhibit overindebtedness in the study period.
3. Results and Discussion
3.1. Functioning of Polish Rural Communes
Ever since Poland joined the European structures, much attention has been paid to rural
development [49–51], also in the context of assessing the financial condition of rural areas, including
excessive indebtedness [52–55]. Research carried out under the Socioeconomic Development of Rural Areas
in Poland project by the Institute of Rural and Agriculture Development [56] and by the Foundation for
the Development of Polish Agriculture [57] is of particular importance in this regard. The role of rural
areas in the national economy is reflected by their area and population (as they make up over 90% of
the national territory and are home to over 30% of the total population) [1].
Three administrative types of Polish basic local government units can be identified: urban communes
(whose borders coincide with the limits of the commune capital city), rural communes (which do not
include any cities) and urban-rural communes (which include both cities within their administrative
boundaries and territories located beyond city limits). In 2017, there were 2478 communes, of which rural
units (over 60% of the total number) and urban units (barely 13%) formed the largest and the smallest group,
respectively [1]. The basic functions of rural communes continue to be related to agriculture. However, the
ongoing processes and developments, including the increasing demographic and economic potential of
rural areas (especially those located near big cities, i.e., metropolitan areas), contribute to changing the
nature of functions fulfilled by rural areas. Indeed, many of them shift from a typical agricultural function
towards a residential and service functional type [2]. At the same time, the needs of the local community
keep growing, including in the area of technical and social infrastructure; and it is largely the responsibility
of local government units to implement the relevant investments.
In Poland, the operational framework for financial management of local government units is
provided in several documents, including the Constitution of the Republic of Poland [58], the Public
Finance Act [59] and the Act on Incomes of Local Government Units [60]. In turn, the scope of
municipal government activities is set forth in the Municipal Government Act [61] and the European
Charter of Local Self-Government [62]. The foundation for municipal operations is the capacity to
generate income and the ability and possibility to obtain revenue in an amount necessary to finance the
needs of the local community. The European Charter of Local Self-Government (Article 9) [62] grants
the right to sufficient own financial resources and the freedom to allocate them. Also, it specifies that
the financial resources of local communities should be proportional to their competence, i.e., to the
extent of tasks carried out by the local government. What matters from the perspective of communes is
the guarantee that any changes in their tasks and competencies shall be accompanied by corresponding
changes in the delivery and redistribution of dedicated funds [63].
Own income potential of municipal government units (which includes most sources of own
incomes) is one of the drivers of stable local development. Own incomes of entities active in the local
government sector are incomes that involve fiscal sovereignty and ownership of specific sources of
income or the authority to introduce and develop specific incomes. In turn, as provided for in the
Constitution of the Republic of Poland, own incomes of LGUs are incomes other than general subsidies
and targeted grants from the state budget. In this sense, own incomes of LGUs also include incomes
derived from their share in collected income taxes (personal income and corporate income taxes) which
are state budgetary income. This is the very category of income which puts the LGUs in a position
to make changes, including improving the development level of the socioeconomic infrastructure,
enhancing innovativeness, and providing the local community with better conditions and standards
of living. Own incomes of Polish communes mainly include local taxes and fees (e.g., property tax,
agricultural tax, forestry tax), income taxes and funds derived from the sale and lease of property. AtSustainability 2020, 12, 794 7 of 25
the same time, the amount of own incomes per capita and their share in total incomes are among the
main indicators of these units’ financial autonomy [63–67].
In Poland, urban communes have by far the highest level of own incomes, which amounted to
PLN 96.4 billion (EUR 22.6 billion) in 2017, i.e., PLN 320 million per commune (EUR 75.2 million).
Because of their high demographic and economic potential, urban communes, especially big cities
(metropolises), accumulate a large part of the total own incomes of communes. In absolute terms, rural
communes have a distinctively small own income potential. In 2017, their total own income totaled
barely PLN 18 billion (EUR 4.2 billion), which is only PLN 12 million per commune (EUR 2.8 million).
Between 2007 and 2017, an enhancement was observed in the own income potential of basic Polish
LGUs. The greatest increase in own incomes (by more than 95%) was found in rural communes; this
could have been caused by the benefits they derive from suburbanization. Indeed, this process drives
an increase in the demographic and economic potential of rural communes. As a consequence, many of
them shift to another functional type which, in turn, translates into much greater tax revenues (Table 1).
Table 1. Selected indicators of financial management in Polish communes in 2007–2017.
Specification 2007 2008 2009 2010 2011 2012 2013 2014 2015 2016 2017
Level of own income in million PLN
total 57,337.3 65,063.2 63,284.0 66,548.2 70,441.7 73,930.5 78,604.8 84,604.7 88,347.0 91,003.8 96,388.9
urban 39,188.2 43,932.8 42,461.0 43,988.7 46,112.3 47,945.2 50,868.8 54,535.7 56,702.7 58,383.3 61,543.6
urban-rural 9019.1 10,514.6 10,348.0 11,130.6 11,982.2 12,717.5 13,468.9 14,534.9 15,192.1 15,835.1 16,965.6
rural 9130.0 10,615.9 10,475.0 11,428.9 12,347.2 13,267.9 14,267.1 15,534.1 16,452.2 16,785.5 17,879.7
Level of own income level in PLN per capita
total 1504.3 1707.0 1658.7 1727.8 1828.4 1918.6 2041.6 2198.4 2297.4 2368.3 2508.7
urban 2074.7 2332.8 2258.1 2333.1 2450.4 2552.8 2716.5 2920.5 3043.4 3142.8 3317.6
urban-rural 1063.2 1234.1 1205.7 1271.0 1361.7 1444.3 1530.1 1643.7 1713.7 1779.5 1898.0
rural 849.7 986.3 972.9 1048.1 1131.9 1212.1 1300.1 1416.3 1501.4 1532.7 1635.4
Share of own income in total income (%)
total 55.2 58.2 54.9 52.7 53.1 52.9 54.5 55.4 55.8 51.6 50.8
urban 64.8 68.5 65.1 62.5 62.2 60.8 62.0 62.5 62.9 60.1 59.7
urban-rural 48.1 51.0 48.0 46.5 47.4 48.3 50.1 51.1 51.3 45.7 44.6
rural 37.1 39.3 36.8 35.9 37.1 38.5 40.3 41.9 42.7 37.8 36.8
Level of investment expenditure in PLN per capita
total 530.7 621.2 729.9 840.6 785.9 673.7 631.6 747.7 687.4 477.8 662.8
urban 654.0 754.2 839.1 893.3 856.0 800.5 743.9 888.9 806.3 536.8 685.0
urban-rural 388.8 480.0 597.8 718.1 666.0 528.0 476.8 559.3 528.1 400.4 598.4
rural 426.7 500.8 644.8 848.0 761.9 573.9 564.9 659.6 614.4 440.7 677.8
Financial result in million PLN (surplus / budget deficit)
total 1925.3 −2303.4 −1,0994.1 −1,2498.7 −8506.9 −2567.7 −135.1 −1922.8 2458.8 6098.4 −769.7
urban 1366.9 −1915.1 −7484.0 −6544.8 −5372.8 −2701.5 −567.6 −1349.5 1014.8 3266.5 −179.8
urban-rural 207.8 −323.9 −1791.0 −2517.6 −1399.1 −122.6 93.6 −189.7 511.6 1198.2 −298.7
rural 350.6 −64.4 −1719.0 −3436.3 −1735.0 256.4 338.9 −383.5 932.3 1633.7 −291.2
Relation of budget deficit to realised investment expenditure (%)
total × 9.7 39.5 38.6 28.1 9.9 0.6 6.7 × × 3.0
urban × 13.5 47.5 38.9 33.4 18.0 4.1 8.1 × × 1.4
urban-rural × 7.9 34.9 40.0 23.9 2.6 × 3.8 × × 5.6
rural × 1.2 24.7 37.1 20.8 × × 5.3 × × 3.9
×—In the years concerned, the types of communes covered by the analysis did not report a budget deficit (had
a budget surplus instead). Hence, it is impossible to calculate the ratio between budget deficit and investment
expenditure. Source: own study based on data from the Central Statistical Office of Poland [1].
Polish rural communes are characterized by the smallest own income potential per capita. They are
mostly agricultural in nature, which results in low levels of income derived from property tax, personal
income tax and corporate income tax; note that these are the main sources of own incomes for urban units.
In 2017, own incomes collected by rural communes averaged at PLN 1635 per capita (284 EURO), i.e., over
60% less than in urban communes. In addition to having the smallest own income potential per capita,
rural communes also prove to be the most heterogeneous in this regard (Table 1).
Note also that rural communes report the smallest financial autonomy, quantified with the share of
own incomes in total incomes. In 2017, in rural communes, the share of own incomes in total incomes
was barely 37%, compared to over 50% for an average municipality. Irrespective of the administrative
type of territorial units covered by this study, a smaller share of own incomes in their total incomesSustainability 2020, 12, 794 8 of 25
may be observed in 2009–2010 and in 2016–2017. In the first period, the reduced share of own incomes
in total incomes (which means a decline in the levels of financial autonomy) resulted from smaller
amounts of taxes being levied to finance the municipal budgets; but in 2016–2017, the tax receipts were
growing. Therefore, the reduction in the contribution of own incomes to total incomes of the LGUs
under consideration was the consequence of larger budgetary incomes drawn from non-fiscal sources.
Indeed, transfer incomes from the state budget (mainly including targeted grants allocated to delegated
tasks) have grown considerably since 2016. This is because the benefits under the Rodzina 500+
program (put in place in Poland in 2016 to support large families) are disbursed through the municipal
budget. The extent of this support measure is so large that it prevents the proper interpretation of the
indicator discussed. Therefore, when analyzing the decreasing level of own incomes in total incomes,
it must be benchmarked against the increasing level of own incomes per capita. The above means that
the financial autonomy of basic Polish LGUs does not decline [67].
LGUs must invest in order to ensure economic development within their territories. In Poland,
local government units make up a considerable part of economic processes. As part of their own tasks,
they take investment measures to improve the conditions and standards of living for the population
through development processes and improvements to technical and social infrastructure. Measures are
also taken to attract capital, which stimulates the creation of new jobs. In relative terms, the biggest
investment expenditure is incurred by urban communes, especially in urban districts and in the largest
ones (metropolises). In 2017, investment expenditure incurred by urban communes was PLN 685 per
capita (EUR 180.9), compared to PLN 678 per capita (EUR 159.2) in rural communes. According to
Dolewka [68] and a number of other researchers, practice demonstrated that big cities allocate greater
financial resources to infrastructural development; this results from a different scale of needs which are
primarily caused by the number of residents. Although rural communes have a smaller investment
potential than other municipality types, they recorded the highest growth in investments over the study
period. However, the increase in investment expenditure resulted in a greater budget deficit; that trend
prevailed in municipal government units practically throughout the period covered by this study (Table 1).
Undoubtedly, the global economic crisis which occurred during the study period had an adverse
effect on the budgetary performance of Polish communes. Indeed, the local finance crisis resulted in
decreasing the level of own income potential of all local government units. A study by Kozera [69]
suggests that over 60% of rural communes experienced a clear reduction in own incomes between 2008
and 2009. The decline in own incomes of rural communes was especially due to income streams, which
depend on the economic situation, primarily including incomes derived from the share in personal
and corporate income taxes. It perpetuated the fiscal imbalance manifested through growing budget
deficits and the deteriorating operational performance (reduction in the operating surplus or increase
in operational deficit). The rapid decline in financial performance in both rural and other types of
communes was observed in 2009–2011. At that time, their total budget deficit reached the peak level.
Rural communes recorded the highest budget deficit (a total of PLN 3436.3 million—EUR 860.2) in
2010. In 2009–2011, a budget deficit was reported by 70% of all rural communes [30]. However, the
way the funds derived from the deficit are spent sometimes fails to comply with that rule. When
analyzing the ratio between the budget deficit and investment expenditure of Polish communes, it
can be noticed that peak levels were recorded in 2009–2011. The average budget deficit/investment
expenditure ratio was nearly 25% in 2009 and went up to over 37% in 2010 (Table 1).
3.2. The Indebtedness in Poland between 2007 and 2017
Today, public debt is a problem faced by most market economy countries. That economic category is
commonly defined as total financial liabilities of public authorities caused by the excess of expenditure
over income. Recently, the world has experienced a sharp increase in public debt levels. In the 1990s,
public debt was also recorded in economies in transition, including Poland. This was the consequence of
public finance disruptions that accompanied the economic transformation. In recent years the financial
and economic crisis resulted in serious challenges being posed to many European governments [70].Sustainability 2020, 12, 794 9 of 25
In the study period (2007–2017), the average level of public debt expressed as a percentage of GDP
went up from 61.7% to 82.1% in European Union countries. When comparing the 2007 and 2017 figures,
note that only three countries (Malta, Denmark and Bulgaria) recorded a decline in debt levels. It was
the opposite in other countries, especially in Greece, Portugal and Spain which are among the most
indebted economies. In Poland, the debt/GDP ratio in 2007 and 2017 was 45% and 50.6%, respectively.
This is a safe level because, in accordance with national and Union legislation, the state-level public
debt ratio cannot exceed 60% [71].
When comparing the levels of state-level public debt in Poland between 2017 and 2007, note that
it grew by over 82%, from PLN 527.4 billion to PLN 961.9 billion (from EUR 139.4 billion to EUR 225.9
billion). Of the three sectors that generate state-level public debt, the government sector had the greatest
contribution; in the study period, it varied in the range of 94.8% (2007) to 92.8% (2017) of total state debt.
Its decreasing importance in the debt structure results from the fact that local government debt grows at a
faster rate. In 2007, that sector accounted for PLN 24.5 billion (EUR 6.5 billion) of debt (4.9% of state-level
public debt) and reached as much as PLN 69.5 billion (EUR 16.3 billion) (7.8% of state-level public debt)
in 2017. When comparing the growth rates between the sectors considered, it can be noticed that local
government debt grew quickest (and nearly doubled) whereas government debt grew by a half and
social insurance debt decreased by 96% as a result of open pension funds being transferred to the Social
Insurance Institution. It needs to be emphasized that local government debt reached the highest level (PLN
60–70 billion—EUR 14.5–16.7 billion) in 2011–2015, contributing 8–9% to state-level public debt (Table 2).
Table 2. Level and structure of state-level public debt in Poland by sectors in 2007–2017.
Sector 2007 2008 2009 2010 2011 2012 2013 2014 2015 2016 2017
The level of public debt (in billion PLN)
Government 500.2 566.9 623.6 692.4 748.8 770.8 813.5 755.0 805.1 895.6 892.3
Local government 24.5 28.1 39.3 53.5 64.3 67.4 68.4 71.7 72.1 69.6 69.5
of which communes 10.0 10.8 14.6 21.9 26.0 26.2 25.8 26.4 25.4 23.9 24.9
Social security 2.7 2.8 7.0 2.0 2.3 2.3 0.4 0.1 0.1 0.1 0.1
Total 527.4 597.8 669.9 747.9 815.4 840.5 882.3 826.8 877.3 965.3 961.9
The structure of public debt (%)
Goverment 94.8 94.8 93.1 92.6 91.8 91.7 92.2 91.3 91.8 92.8 92.8
Local goverment 4.9 5.0 6.3 7.7 8.6 8.7 8.4 9.5 9.0 7.8 7.8
of which communes
as % local goverment 40.8 38.4 37.2 40.9 40.4 38.9 37.7 36.8 35.2 34.3 35.8
as % total 1.9 1.8 2.2 2.9 3.2 3.1 2.9 3.2 2.9 2.5 2.6
Social security 0.5 0.5 1.0 0.3 0.3 0.3 0.0 0.0 0.0 0.0 0.0
Source: The authors’ compilation based on [72–74].
The level and growth of local government debt were heavily impacted by debt generated by
communes, Polish basic LGUs. From 2007 to 2017, municipal debt grew by PLN 14.9 billion (EUR
3.5 billion), i.e., one-and-a-half times. Considering the individual components of local government
debts, municipal debt had the largest share, varying in the range of 40.8% in 2007 to 35.8% in 2017.
Although it moved down in the structure of local government debt (the indebtedness of other LGUs
grew at a faster rate), its share in the structure of total debt increased (Table 2).
3.3. The Indebtedness of Rural Communes in Poland between 2007 and 2017
Polish law imposes restrictions on debt levels. They result not only from decisions made by
national authorities but also from international agreements (Poland signed the fiscal compact in 2013)
and membership in integration groupings (Poland joined the European Union in 2004). Pursuant to a
provision of Chapter X of the Constitution of the Republic of Poland, it is prohibited to raise loans
or to provide guarantees as a consequence of which the government debt would exceed 3/5 (60%) of
GDP (Article 216, Para. 5 [58]). The debt ratios are also regulated under the Public Finance Act. It
primarily imposes some restrictions on the way the LGUs may enter into commitments, and provides
for prudence and recovery procedures applicable to entities of the public finance sector if the ratio
of government debt to GDP (and the ratio to GDP of the amount resulting from the conversion ofSustainability 2020, 12, 794 10 of 25
government debt to the Polish currency based on the arithmetic mean of average currency exchange
rates published by the National Bank of Poland within a budget year, in the case of debt expressed in
foreign currencies), less spare funds of the Ministry of Finance, exceeds 55% [75]. Until the end of 2013,
the indebtedness of communes was limited by the ratio of total debt to total incomes (Article 170 [46]).
From 1 January 2014, the debt incurred within a year cannot exceed the average operating surplus
from the last three years (Article 243 [59]). The new debt indicator is an individual restriction for local
government units. It is particularly beneficial to local governments with a large income potential that
translates into a strong collateral for loans. In turn, the indicator previously used as a debt limit (ratio
of total liabilities to total income) offers a very important advantage: it allows us to compare the figures
between different local government units, and therefore the Ministry of Finance continues to present it
as one of key yardsticks of financial condition of LGUs. As a consequence, the total liabilities/total
income ratio is the one used in this paper as an indicator of indebtedness.
Communes are basic local government units. They implement the largest number of public tasks
assigned to the entities of the local government sector in Poland. We can distinguish between three
administrative types of communes: urban, rural and urban-rural communes. Rural communes are the
largest group because they make more than 60% of the total number of communes in Poland and they are
the most diversified group of commune governments among all administrative types. These communes
are characterised not only by their fundamental agricultural function but also, especially in recent years,
they have been losing this function in favour of the service-providing and residential functions, which are
characteristic of other administrative types. Due to the progressing suburbanisation processes, they are the
most convenient places to live and run a business. Thus, they are becoming a residential, production and
logistic base. On the other hand, communes with natural values are often transformed into specialised
centres of tourism and recreation. In communes with natural resources, the development of other than
the industrial function usually does not make sense. The industry often becomes the main source of
income for the local community. The change in the significance and role of rural communes results in
a larger number of investments adjusted to the needs of new inhabitants, investors and tourists. The
implementation of these tasks requires considerable funds. On the one hand, the authorities of communes
feel the competitive pressure of other local governments. On the other hand, they feel that they have
a unique opportunity to use the EU funds and make numerous capital-intensive investments with a
minimal amount of their own funds. In order to create local development and increase the attractiveness
of rural areas for residential and business investments, the authorities of communes use all possible
financial sources. They increasingly tend to use repayable sources.
Rural communes increasingly use repayable funds to implement investments. This fact is proven by
the change in the average amount of total liabilities per capita (Table 3). From one year to another, the
average value (median) of this indicator has been increasing in the local governments under study. It rose
from 268 zlotys (EUR 71) in 2007 to 898 zlotys (EUR 218) per capita in 2011 (i.e., by 227%). Then it slightly
decreased to 751.9 zlotys (EUR 205) per capita in 2017 (i.e., by 4%). It is necessary to note that during the
entire period under study, in rural communes, the median of the total debt per capita in zlotys was lower
than in urban–rural communes or in urban ones. It is noteworthy that there was not only an increase in
the total debt of rural governments but also we could observe increasing differences between entities in
the amount of their debt due to the growing number of communes with excessive amounts of debt. In
2011, when this indicator reached the greatest value, there were 239 communes where the debt per capita
exceeded 1500 zlotys (EUR 264). In the commune of Rewal, the indicator amounted to 6400 zlotys (EUR
1553) per capita. In 2017, 235 communes exceeded the limit of 1500 zlotys. In the commune of Ostrowice,
the debt per capita exceeded 18,000 zlotys (EUR 3106), whereas in the commune of Rewal, it exceeded
14,000 zlotys (EUR 8841) [32].Sustainability 2020, 12, 794 11 of 25
Table 3. The level of total liabilities of communes classified according to the administrative type in Poland between 2007 and 2017 (%).
Debt per Capita (in Zlotys)
Specification
2007 2008 2009 2010 2011 2012 2013 2014 2015 2016 2017
Median
total 312.5 311.6 448.7 799.2 948.9 939.1 921.4 929.7 764.5 706.5 734.7
urban 426.9 439.3 622.9 859.9 983.3 997.3 1012.0 1021.6 935.0 855.5 870.0
urban-rural 392.9 400.6 559.9 900,9 1060.5 1049.7 1038.2 1064.7 994.5 922.5 963.0
rural 267.7 267.7 368.6 739.5 897.8 873.5 846.2 859.1 774.2 706.0 751.9
Range
total 2570.3 4264.9 7161.9 6408.5 6414.3 7951.8 35,603.7 37,434.5 36,962.0 30,241.1 20,038.6
urban 2570.3 1815.4 2269.3 3090.9 4066.4 4610.3 4422.6 5576.3 3767.9 2720.2 3972.8
urban-rural 2415.4 2566.5 3052.5 3110.8 3998.5 3428.1 4220.5 4688.0 5544.5 5321.0 12,130.5
rural 2136.2 4264.9 7161.9 6408.5 6414.3 7951.8 35,603.7 37,434.5 36,220.0 30,172,5 18,676.2
Coefficient of variation * (%)
total 61.4 69.4 61.7 42.3 39.6 40.8 40.7 41.6 55.9 57.2 58.1
urban 46.2 45.8 38.8 31.1 32.4 33.7 28.3 25.0 30.3 34.7 38.1
urban-rural 45.9 57.1 47.9 33.1 30.9 32.6 32.9 35.5 40.2 43.9 41.8
rural 65.8 75.9 74.0 48.9 43.7 45.9 46.6 47.0 52.3 56.3 55.5
Number of communes with debt per capita exceeding 1500 zlotys
Total 15 19 53 218 379 408 353 433 382 334 404
urban 2 3 6 24 33 36 27 39 35 32 36
urban-rural 4 5 19 60 107 124 108 131 131 115 133
rural 9 11 28 134 239 248 218 263 216 187 235
*: positional measure. Source: the authors’ compilation based on data published by the Ministry of Finance [32].Sustainability 2020, 12, 794 12 of 25
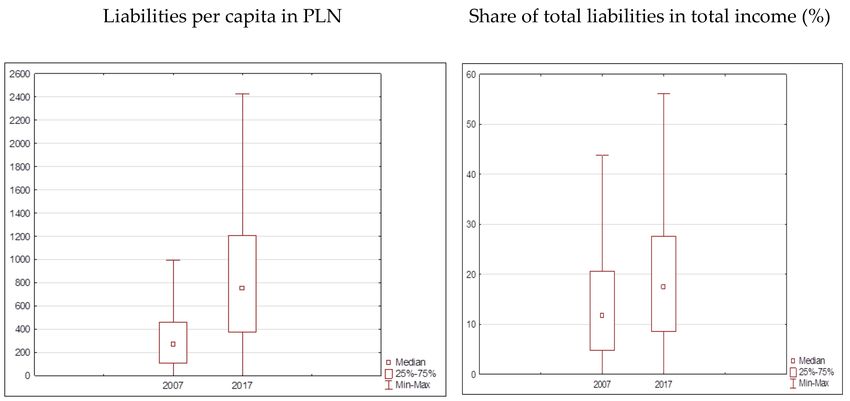
The overall increase in the amount of communes’ debt resulted in an increase in the average
share of total liabilities in total income. Until the end of 2013, 60% was the maximum limit allowed by
law [32,46]. Until 2011, the median of this indicator was increasing in local government units (Table 3,
Figure 1). Also the range between the maximum and minimum value of the share of total liabilities in
the total income of communes was increasing systematically. In 2007, the maximum amount of debt
exceeded the statutory limit only by 5%, but in 2017, it exceeded the limit by over seven times. It shows
that there is a growing number of communes facing the problem of increasing indebtedness.
Figure 1. A box-plot for total liabilities per capita (in zlotys) and the share of total liabilities in total
income (%) in rural communes in Poland between 2007 and 2017. Source: the authors’ compilation
based on data published by the Ministry of Finance [32].
The comparison of individual groups of administrative units shows that rural communes were
the least indebted group during the whole period under study. The median of the share of total
liabilities in the total income of rural communes was 2–4 p.p. smaller than the median for the other
administrative types. However, it is necessary to note the fact that this group of local government
units was characterised by the greatest increase in the total debt. Simultaneously, this group was
characterised by the greatest coefficient of variation and range in all the communes; it was equal to the
maximum value of the debt indicators. It shows that this group of local government units was the most
diversified in its indebtedness. During the whole period under study, there was high diversification,
reaching the highest level between 2007 and 2009, i.e., nearly 70%. Later it dropped to about 40%. The
increase in the median of the indicator under analysis and the increase in the coefficient of variation
show that the group of rural communes facing the problem of growing indebtedness is becoming
larger. It is noteworthy that regardless of the administrative type, in each group there were entities
which exceeded the limit of the maximum share of the total debt in total income. However, among
rural communes there were local governments with the biggest problems (Table 4).
There was a significant number of communes where the share of liabilities in the total income
exceeded the limit of 50%, which was assumed in this study. In 2017, nearly 5% of rural communes
exceeded this limit. It is noteworthy that it was the largest group among the administrative types
under analysis. It is necessary to note that the number of communes which exceeded the limit of 50%
for the indicator in question was the largest in 2011, when the total debt reached the highest level. It
may have been caused by the fact that at the time many expensive investments were being financed
with a share of EU funds. In 2007, there were only 20 communes in this group. In 2011, there were 252,
whereas in 2017, there were 91 (Table 4).Sustainability 2020, 12, 794 13 of 25
Table 4. The share of total liabilities in the total income of communes classified according to the administrative type in Poland between 2007 and 2017 (%).
Share of Debt in Total Income (%)
Specification
2007 2008 2009 2010 2011 2012 2013 2014 2015 2016 2017
Median
total 14.3 13.3 18.0 28.6 32.7 31.6 29.7 29.4 25.6 20.3 19.3
urban 18.9 17.5 26.6 32.5 35.4 35.8 33.9 31.7 29.2 22.7 21.4
urban-rural 17.9 16.8 22.4 33.4 37.2 35.0 34.1 33.1 30.3 24.0 23.3
rural 11.7 10.9 14.2 25.8 29.8 28.0 26.7 26.3 23.0 18.1 17.4
Range
total 64.7 88.8 83.6 106.0 129.7 146.0 259.0 304.2 405.7 360.8 437.3
urban 54.4 52.4 61.1 86.1 95.3 94.9 80.1 78.6 74.1 66.8 69.5
urban-rural 64.0 62.1 78.5 83.1 129.7 99.6 106.4 93.9 129.2 89.1 275.9
rural 64.7 88.8 83.6 106.0 110.7 146.0 259.0 304.2 405.7 360.8 437.3
Coefficient of variation * (%)
total 57.6 64.6 60.6 42.2 38.0 39.8 38.6 39.2 43.8 48.8 49.0
urban 41.5 48.3 38.1 33.4 30.0 30.3 27.4 26.1 25.0 30.3 33.5
urban-rural 45.2 53.5 48.2 34.1 28.4 32.0 32.1 33.5 35.5 39.9 41.8
rural 66.5 74.6 72.7 47.5 41.8 44.6 44.0 43.7 48.1 53.9 54.7
Number of communes with share of liabilities in total income exceeding 50%
total 34 27 82 258 439 339 292 268 215 98 91
urban 2 2 13 30 45 39 27 19 16 4 7
urban-rural 12 9 31 79 142 122 111 102 82 36 31
rural 20 16 38 149 252 178 154 147 117 58 53
*: positional measure. Source: the authors’ compilation based on data published by the Ministry of Finance [32].Sustainability 2020, 12, 794 14 of 25
There were similar statistics for the debt of urban and urban-rural communes. The debt indicator
increased from 17–18% in 2007 to 35–37% in 2011, and then it dropped to 21–23% in 2017. In 2017,
the most indebted urban communes were Świeradów-Zdrój (69.5%), whereas the most indebted
urban-rural communes were Byczyna (275.9%), Lubsko (84.8%) and Myślenice (77.4%). In comparison
with 2007, in 2017, the average debt of urban communes increased by 103.8%, whereas the average
debt of urban-rural communes increased by 145.1%. It is necessary to add that the group of urban
communes was more homogenous in terms of the indicator value, whereas urban-rural communes
were more diversified. This fact is proved not only by the high coefficient of variation but also by high
maximum values, which also indicate the range (Tables 3 and 4).
3.4. Identifying the Financial Risk Factors of Excessive Indebtedness of Rural Communes by Means of
Discriminant Analysis
The first step in identifying the financial factors behind excessive indebtedness of rural communes
based on the discriminative analysis was to pick the units at excessive debt levels, defined as those
with a liabilities/total income ratio above 50%. That group was by far the largest in 2012–2014, with
140 units (i.e., nearly 9% of all rural communes in Poland). Research suggests that excessive debt levels
are found in rural communes of different functional types. However, typical units affected by excessive
indebtedness are agricultural communes with a tourist function (nearly 17% of all communes of that
type recoded excessive debt levels) and communes with residential and service functions (over 15%
of all communes of that type). Conversely, agricultural communes were less frequently affected by
excessive indebtedness (only 6% of them; the calculations are based on author’s research presented
in [2]). The key investment target for the authorities of tourist communes (located mainly in northern
and southern Poland) was the enhancement of tourist and similar infrastructure. In turn, communes
with residential and service functions (located in main metropolitan centers, in the immediate vicinity
of big cities) mainly invested in the technical and social infrastructure. This was driven, on the one
hand, by the needs of tourists, new residents or entrepreneurs and, on the other, by the capacity to
meet these needs by accessing EU financing instruments. The purpose of investments implemented by
communes (financed or co-financed with repayable funds) is to make the region more attractive (e.g.,
in terms of tourism or residential aspects). As a consequence, local government units derive more
revenue from various types of local taxes (e.g., property tax, personal income tax) and local fees (e.g.,
visitors taxes, resort taxes). Usually, financial problems affecting these local government units resulted
from the implementation of large-scale investments, sending them into a debt spiral. This is because
the banks denied credit to them whereas shadow banks were eager to grant loans at an interest rate
three times that charged by the banks [76].
Table 5 presents a selection of socioeconomic characteristics of rural communes at excessive debt
levels and those with a debt maintained within one-half of their budgets. Heavily indebted communes
demonstrate more favorable socioeconomic indicators than those which do not report excessive debt.
Rural communes at high debt levels witnessed a higher positive net migration rate and a higher share
of councilors with a higher level of education. Also, heavily indebted communes reported rapid
growth of entrepreneurship as the number of operators entered to the REGON register per 10,000
population was much higher than in other rural communes. At the same time, residents of excessively
indebted communes were more socially active as they establish foundations, associations and social
organizations (Table 5).Sustainability 2020, 12, 794 15 of 25
Table 5. Socioeconomic characteristics of excessively indebted Polish rural communes in 2012–2014
(average (median) values).
Rural Communes in Which the Share of
Specification Total Liabilities in Total Revenues t p
Was Less than 50% Was Higher than 50%
Share of arable land in total area (%) 66.92 58.92 5.06 0.00
Population at non-working age per 100 persons
59.96 58.99 2.20 0.03
at working age
Migration balance per 1000 people 0.09 1.76 −3.62 0.00
Percentage of councilors with a high level of
28.08 31.66 −2.75 0.01
education (%)
Percentage of population using the sewage
37.03 42.73 −2.49 0.01
system (%)
Percentage of population using the gas
15.56 20.95 −2.41 0.02
network (%)
Average floor area of the flat per person 28.26 29.21 −2.30 0.02
Entities entered in the REGON register per
687.76 800.16 −4.93 0.00
10,000 population
Newly registered units in the REGON register
64.26 75.55 −4.69 0.00
per 10,000 population
Foundations, associations and social
32.38 34.76 −2.38 0.02
organizations per 10,000 population
Source: the authors’ calculations based on data published by the Central Statistical Office [1].
The discriminant model of the risk of excessive indebtedness of rural communes was built in
four stages. At the first stage, the aim of the study and classification criteria were defined, and a
group of local government units was selected for analysis. The aim of the study was to build a
discriminant model enabling prediction of the danger of excessive indebtedness of rural communes
and identification of the financial factors of excessive indebtedness of these entities. The model includes
ten financial indicators selected based on substantive and statistical criteria (Step 2).
The first step of the research method consisted of entering the share of the operating surplus in
total income (OS/TI) as a variable. It was characterised by the greatest discriminatory power due to the
greatest F statistic value (Table 6). Further steps involved entering the share of own income in total
income (OI/TI) and the amount of the EU funds in zlotys per capita (EU/M) as variables. The third step
was the final one, because the other variables did not have sufficient discriminatory power due to the
low F statistic value. Table 7 shows the data characterising the variables in the model. The critical
significance level p shows that the variables significantly contributed to distinguishing between rural
communes threatened or unthreatened by excessive indebtedness. The value of partial Wilks’ lambda
indicates that the OS/TI variable had the greatest discriminatory contribution.
Table 6. The results of an analysis of the discriminant function (stepwise progressive method).
Number of Last Variable
Step Wilks’ Lambda F
Variables Entered
Step 1 1 OS/TI 0.9742 13.87
Step 2 2 OI/TI 0.9118 3.51
Step 3 (final step) 3 EU/M 0.9028 2.01
Source: the authors’ calculations based on data published by the Ministry of Finance [32] and Central Statistical
Office [1].You can also read