Monitoring Report 2018/19 - West Sussex Joint Minerals Local Plan West Sussex Waste Local Plan - West Sussex County Council
←
→
Page content transcription
If your browser does not render page correctly, please read the page content below
West Sussex Joint Minerals Local Plan
West Sussex Waste Local Plan

Monitoring Report 2018/19
West Sussex Minerals and Waste Local Plans                                 Monitoring Report 2018/19

Contents
Executive Summary .................................................................................. 1
1.      Introduction .................................................................................... 3
        The Local Authorities ........................................................................ 3
        What is the Authority Monitoring Report? ............................................ 3
        The County of West Sussex ............................................................... 4
2.      Local Plan Progress .......................................................................... 5
        Minerals and Waste Development Scheme ........................................... 5
        West Sussex Waste Local Plan ........................................................... 5
        West Sussex Joint Minerals Local Plan ................................................. 5
        Shoreham Harbour Joint Area Action Plan............................................ 6
3.      Aggregates ..................................................................................... 7
4.      Non-Aggregate Minerals ................................................................... 9
        Silica Sand...................................................................................... 9
        Brick Clay ....................................................................................... 9
        Building Stone (Sandstone) ............................................................. 11
        Chalk ........................................................................................... 12
        Oil and Gas ................................................................................... 13
        Production of Secondary and Recycled Aggregates ............................. 13
5.      Waste .......................................................................................... 16
        Roles and Responsibilities ............................................................... 16
        Waste Local Plan (2014) ................................................................. 17
        Waste Arisings .............................................................................. 18
        MSW ............................................................................................ 20
        C&I Waste .................................................................................... 22
        CD&E Waste ................................................................................. 24
        Total Waste .................................................................................. 25
        Waste Management Capacity in West Sussex ..................................... 26
        Built Waste Management Capacity.................................................... 26
        Non-Inert Landfill .......................................................................... 27
        Inert Waste Landfill and Recovery .................................................... 28
        Imports and Exports ...................................................................... 31
6.      Planning Applications ..................................................................... 34
7.      Enforcement/Monitoring ................................................................. 35
8.      Duty to Co-operate ........................................................................ 37
Appendix A: Glossary of Terms ................................................................. 41
Appendix B: Mineral and Waste Sites in West Sussex ................................... 47
        Mineral Extraction Sites .................................................................. 47

                                                     i
West Sussex Minerals and Waste Local Plans Monitoring Report 2018/19
Other Minerals Infrastructure .......................................................... 50
Waste Sites .................................................................................. 52
Appendix C: Recovery Capacity in West Sussex........................................... 62
Appendix D: List of Planning Applications ................................................... 64
Minerals ....................................................................................... 64
Waste .......................................................................................... 65
Appendix E: Minerals and Waste Site Maps ................................................. 68
Appendix F: Waste Local Plan Indicators .................................................... 70
Appendix G: Joint Minerals Local Plan Indicators ......................................... 78
iiWest Sussex Minerals and Waste Local Plans Monitoring Report 2018/19
Executive Summary
Chapter 1 presents background information about the county of West Sussex
and the role of the Monitoring Report. The Monitoring Report relates to the
period 1 April 2018 to 31 March 2019, but also includes some relevant data and
information up to December 2019.
Chapter 2 summarises progress on the Local Plans. The Waste Local Plan
(WLP) was adopted in 2014. The Authorities undertook a review of the WLP in
2019 which concluded that the policies have generally performed as expected
and are still considered to be consistent with national policy, relevant and
effective, and working to achieve the vision and strategic objective of the Plan.
The Joint Minerals Local Plan (JMLP) was adopted in July 2018 and work is now
underway on the Single Issue Soft Sand Review of the JMLP, as required by
Policy M2 (Soft Sand).
Chapter 3 is about aggregates. Mineral Planning Authorities are required to
prepare a Local Aggregate Assessment (LAA) which assesses the demand and
supply of aggregates in its area on an annual basis including:
Land won sand and gravel;
Marine won sand and gravel;
Rail-imported sand and gravel;
Crushed rock;
Secondary and recycled aggregates.
This chapter includes a summary of the main headline figures taken from the
LAA. This shows that there is a landbank of 22 years for sharp sand and gravel
and 6.2 years for soft sand. The latest West Sussex Local Aggregate
Assessment (2019) was published in May 2020.
Chapter 4 is about non-aggregate minerals:
Silica sand – There are no permitted reserves of silica sand in West
Sussex and therefore no landbanks at individual sites. Any silica sand
produced from sites in West Sussex is ancillary to soft sand production.
Brick clay – There are three brickworks in West Sussex that are estimated
to have 25 years or more of permitted reserves. There is an allocation in
Policy M11 (Strategic Mineral Site Allocations) of the JMLP to provide an
extension to West Hoathly clay pit to provide two to three years additional
supply of Wadhurst clay to the existing brickworks. Policy M5 (Clay) also
allows for the extraction of brick clay to come forward subject to certain
policy criteria.
Building stone – There are four active building stone extraction sites in
West Sussex. There is no requirement for the Authorities to make
provision for the production of building stone, however, Policy M6
(Building Stone) of the JMLP allows for proposals for the extraction of
building stone to come forward subject to criteria.
Chalk – there are two active chalk pits in West Sussex which have an
estimated landbank of 88 years. Chalk is extracted on a small-scale basis
and there are significant reserves of chalk. Policy M4 (Chalk) of the JMLP
1West Sussex Minerals and Waste Local Plans Monitoring Report 2018/19
allows for proposals for chalk extraction to come forward subject to
criteria.
Oil and Gas – There are three sites in West Sussex where oil production is
permitted. There is no requirement for West Sussex to provide a
landbank of oil and/or gas. Policies M7a and M7b of the JMLP allow for
proposals for hydrocarbon development subject to criteria.
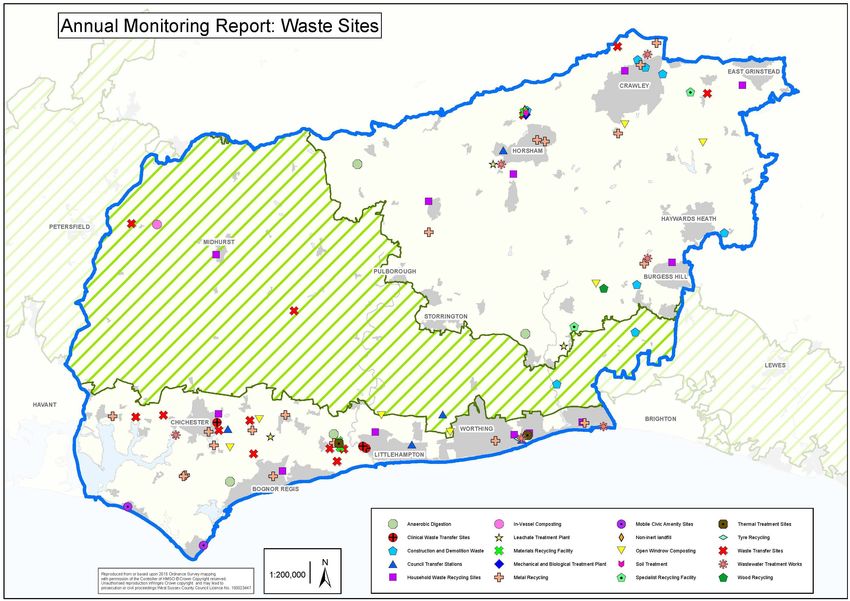
Chapter 5 is about waste. There are over 80 waste management sites in the
County. In order to achieve greater levels of recycling and a significant
reduction of waste going to landfill, the ‘Reclaim’ contract and Materials
Recycling Management Contract (MRMC) has had an impact on the number of
waste management facilities within the County. The ‘Reclaim’ contract has
resulted in improvements to Household Waste Recycling Sites (HWRS) and the
construction and operation of a Materials Recycling Management Facility (MRF)
and Mechanical and Biological Treatment Plant (MBT).
The estimated overall arisings of controlled waste in West Sussex in 2018/19
was 2.2mt and based on the high growth rate scenario in the forecasts that
underpinned the WLP, the amount of waste that may arise in 2031 may be close
to 2.3 million tonnes which is approximately 150,000 tonnes higher than
anticipated when the WLP was prepared. The greatest increase in waste is
anticipated in CD&E waste, of which 75% is inert waste that is recovered for
beneficial use, following recycling and there is flexibility in the WLP to respond to
this increase.
Chapter 6 summarises the planning applications and appeals that have been
determined over the monitoring period. During the monitoring year 23 minerals
and waste planning applications were considered in West Sussex.
Chapter 7 explains the role of the Compliance and Enforcement Teams. During
the monitoring year 33 investigations were resolved; there were seven Planning
Contravention Notices/Requests for information and two Enforcement Notices.
Chapter 8 is about the Duty to Co-operate. The Authorities are actively
engaged in the South East Waste Planning Advisory Group (SEWPAG) and the
South East England Aggregates Working party (SEEAWP). The Authorities have
engaged with relevant statutory bodies as part of the Duty to Co-operate and a
summary is provided.
2West Sussex Minerals and Waste Local Plans Monitoring Report 2018/19
1. Introduction
The Local Authorities
1.1 West Sussex County Council (WSCC) is the Mineral Planning Authority
(MPA) and Waste Planning Authority (WPA) for West Sussex, excluding
the parts of the County that lie within the South Downs National Park
(SDNP). The South Downs National Park Authority (SDNPA) is the MPA
and WPA for the area of West Sussex which falls within the SDNP. WSCC
and the SDNPA (the ‘Authorities’) have worked in partnership to produce
the West Sussex Waste Local Plan (WLP) which was adopted in April 2014,
and the Joint Minerals Local Plan (JMLP) which was adopted in July 2018.
The Authorities are undertaking a Single Issue Review, as required by
Policy M2 (Soft Sand), of the JMLP. The review will set the strategy for
meeting the demand for soft sand in the county. As well as preparing
local plans, the Authorities are responsible for determining planning
applications for minerals and waste development, and ensuring such
development is carried out in accordance with approved plans and any
conditions and legal agreements attached to the planning permission.
What is the Authority Monitoring Report?
1.2 The Authorities are required to prepare an Authority Monitoring Report
(AMR), hereafter referred to as the ‘Monitoring Report’, as set out in the
Planning and Compulsory Purchase Act 2004 (as amended by the Localism
Act 2011) and the Town and Country Planning (Local Planning) England)
Regulations 2012. The Monitoring Report presents:
Progress made on the timetables set out in the Minerals and Waste
Development Scheme (MWDS) for preparing planning documents;
How the policies in the WLP and JMLP are performing against their
indicators;
Minerals and waste trends, and relevant planning applications, in order
to monitor and review the effect of planning policies in practice.
1.3 The information contained in this Monitoring Report solely relates to issues
connected with mineral and waste activity. The seven district and
borough Councils (Adur, Arun, Chichester, Crawley, Horsham, Mid Sussex,
and Worthing) are preparing local plans covering other land-use planning
matters including housing and employment. These are as follows:
Adur Local Plan (December 2017);
Shoreham Harbour Joint Area Action Plan (October 2019);
Arun Local Plan 2011-2031 (July 2018);
Chichester District Local Plan (July 2015);
Chichester District Site Allocation DPD (January 2019);
Crawley Borough Local Plan (December 2015);
Horsham District Planning Framework (2015);
Mid Sussex District Plan 2014-2031 (2015);
3West Sussex Minerals and Waste Local Plans Monitoring Report 2018/19
South Downs National Park Local Plan (July 2019);
Worthing Core Strategy (2011).
1.4 Reference should also be made to the Authority Monitoring Reports
produced by the District and Borough Councils and for the South Downs
Local Plan.
1.5 Some of the primary data required to complete the monitoring report is
not directly available for the monitoring year. This is partly due to issues
surrounding commercial sensitivity of data (particularly the case for
minerals data) and partly because the data has not been systematically
collected on an annual basis (such as recycling figures for Construction &
Demolition (C&D) waste). This means that some figures used are
calculated based on a methodology. This monitoring report is for the
period 1 April 2018 to 31 March 2019 but some of the data for minerals
and waste relates to the calendar year 2019.
The County of West Sussex
1.6 West Sussex is situated in the South East region. It covers 1,990 square
kilometres (199,000 hectares) with more than half of the county protected
by national landscape designations including South Downs National Park,
the High Weald Area of Outstanding Natural Beauty (AONB) and
Chichester Harbour AONB. The county is divided into seven district and
borough councils and the SDNPA. The main coastal development
stretches from Bognor Regis in the west through Littlehampton and
Worthing to Shoreham-by-Sea, Southwick and Fishersgate to the east.
Inland, development in the east is concentrated around Burgess Hill on
the county boundary with East Sussex and in the north-east of the county
around Horsham, Crawley, and East Grinstead. The county has transport
links with London, Brighton and Hove and adjoining authorities (Brighton
and Hove City Council, and county and district/borough councils in East
Sussex, Hampshire, and Surrey).
1.7 The strategic road network includes the coastal A27, the A23/M23 route
from Brighton to London via Crawley, and the A24 from Worthing to
Horsham. The rail network crosses east/west along the developed coastal
area and north/south along two lines, the Brighton-London Mainline and
the Arun Valley; from Brighton to Three Bridges; and from Arundel to
Horsham and Crawley, continuing to London. Shoreham Harbour port is
important for imports and exports, and its location close to Brighton and
Hove and East Sussex results in cross-boundary movement of goods and
materials outside of the county. Gatwick Airport in the north of the
county, in Crawley Borough, is a major international airport that makes a
substantial contribution to the economic performance of West Sussex, the
south east, and London.
1.8 The varied geology of the County has given rise to a series of attractive
landscapes including the chalk of the South Downs, the clay of the Low
Weald and the sandstones of the High Weald. National landscape
designations cover over half of West Sussex, comprising of the South
Downs National Park (SDNP) and the High Weald and Chichester Harbour
Areas of Outstanding Natural Beauty (AONB).
4West Sussex Minerals and Waste Local Plans Monitoring Report 2018/19
2. Local Plan Progress
Minerals and Waste Development Scheme
2.1 Information on the plans and timetables for the preparation of both JMLP
and WLP are set out in detail within the Minerals and Waste Development
Scheme (MWDS). The most recent update to the MWDS was formally
approved in April 2020. This sets out the programme for the preparation
of the minerals and waste policy documents until 2021.
Signpost
For more information on the timetable, please refer to the West Sussex
Minerals and Waste Development Scheme 2020-2023 and the Local
Development Scheme (LDS) for the South Downs National Park Authority,
which refers to the West Sussex MWDS.
West Sussex Waste Local Plan
2.2 Following the examination hearings in 2013, the Inspector issued his final
report in February 2014 confirming that the Plan is sound and legally
compliant. The WLP was formally adopted by the County Council and
South Downs National Park Authority in April 2014.
2.3 A review in early 2019 examined whether the Plan remains relevant and
effective. The review of the WLP has identified that, since adoption of the
Plan in April 2014, there have been no substantive changes in national or
local circumstances and the policies have generally performed as
expected. They are still considered to be consistent with national policy,
relevant and effective, and working to achieve the vision and strategic
objectives of the Plan.
West Sussex Joint Minerals Local Plan
2.4 Following the examination hearings in 2017, the Inspector issued his final
report in May 2018 confirming that the Plan was sound and legally
compliant, subject to modifications. The JMLP was formally adopted by
the County Council and South Downs National Park Authority in July 2018.
2.5 Policy M2 of the JMLP requires the Authorities to undertake a Single Issue
Soft Sand Review (SSR) of the JMLP. In accordance with the MWDS, the
SSR was submitted to the Secretary of State in April 2020 and the
examination hearings are expected to take place between July and
August 2010.
5West Sussex Minerals and Waste Local Plans Monitoring Report 2018/19
Stage Date
Call for sites, evidence gathering, and July-December 2018
undertaking relevant technical studies
Informal public and stakeholder January-March 2019
consultation (Reg. 18 stage) for period of Approved by Cabinet Member
eight weeks
Summarising representations/preparation April-September 2019
of Proposed Submission Draft and Final
Sustainability Appraisal Report
Representations’ period (Reg. 19) on January-March 2020
Proposed Submission and Final Approved at Full Council
Sustainability Appraisal Report for period
of eight weeks
Summarising representations/preparation March-April 2020
of Submission Plan and Final
Sustainability Appraisal Report
Submission of final document and April 2020
Sustainability Appraisal Report to
Secretary of State
Preparation for Public Examination May-June 2020
Hearing
Pre-Meeting (as required) June 2020
Public Examination Hearing July-August 2020
Receive Inspector's Report October-November 2020
Adoption December 2020
Subject to approval at Full Council
Publication January 2021
Shoreham Harbour Joint Area Action Plan
2.6 The Shoreham Harbour Joint Area Action Plan (JAAP) which aims to
deliver regeneration and associated infrastructure was adopted in
October 2019. It was prepared by Adur District Council, Brighton & Hove
City Council, Shoreham Port Authority, and West Sussex County Council
(the Shoreham Harbour Regeneration Partnership). Policy M10
(Safeguarding Minerals Infrastructure) of the JMLP safeguards permanent
and temporary wharves in Shoreham Harbour and the JAAP is consistent
with the JMLP and provides adequate safeguarding in line with national
planning policy.
6West Sussex Minerals and Waste Local Plans Monitoring Report 2018/19
3. Aggregates
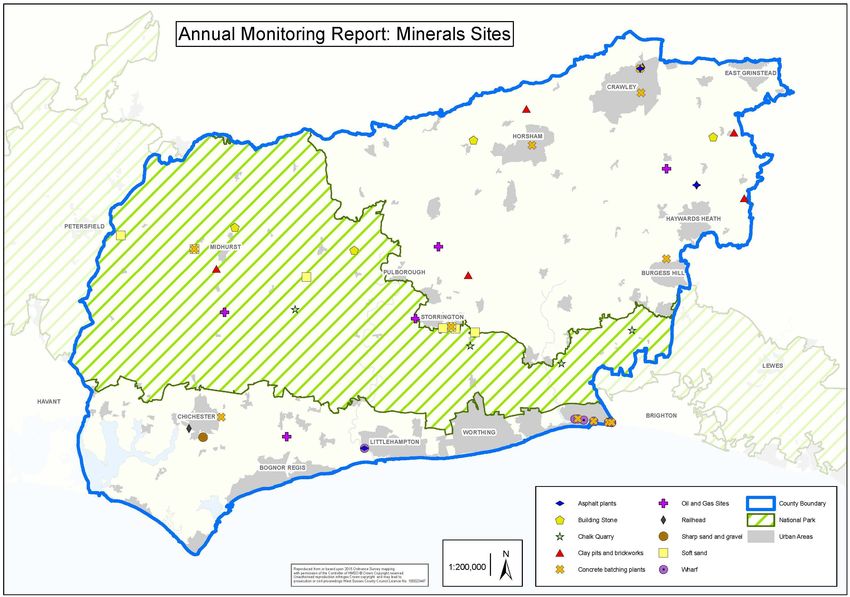
3.1 Mineral Planning Authorities are required to prepare a Local Aggregate
Assessment (LAA) which assesses the demand and supply of aggregates
in its area on an annual basis. The West Sussex LAA sets out the past to
current demand for, and supply for, aggregates in West Sussex from a
number of sources including:
Soft sand and sharp sand and gravel extracted at quarries in West
Sussex;
Recycled and secondary aggregate production;
Imported aggregate (e.g., crushed rock and sand and gravel) by rail
and sea.
3.2 The main headline figures taken from the LAA are presented in Table 1
and a list of sites (soft sand; sharp sand and gravel, wharves, and
railheads) is provided in Appendix B.
Signpost
For more information, please refer to West Sussex Joint Minerals Local
Plan: Assessment of Need for Aggregates: Local Aggregate
Assessment 2019 (May 2020), available on the County Council’s Local
Aggregate Assessment web page.
7West Sussex Minerals and Waste Local Plans Monitoring Report 2018/19
Table 1: Aggregate sales, reserves and landbank summary (West Sussex Local Aggregate Assessment, 2019)
Aggregate 2018 sales (mt) Trend 10-year average 3-year average LAA Rate Reserves Landbank (years) Capacity Comments
(2017 sales in (previous sales (mtpa) sales (mt) (mtpa) (mt) (based on (mtpa)
brackets) year sales) 2009-2018 2016-2018 LAA Rate)
Confidential Incidental sales from one soft sand quarry
Sharp Sand & Gravel Up 0.023 0.084 0.036 1 0.795 22 0.250
(Confidential) in 2018.
0.306
Soft Sand Up 0.289 0.316 0.372 2.300 6.2 0.502 -
(0.282)
0.391 Data derived from EA WDIs and reporting
Recycled/Secondary Aggregates Down 0.444 0.421 0.444 - - 06.10 on 2018/19. Survey response rates too
(0.393) low for accurate figures.
1.319
Marine Sand & Gravel (landings) Up 1.106 1.293 1.737 - -
(1.307) Headroom capacity of 0.167mtpa (using
2.070
0.090 updated LAA rate).
Rock Imports by Sea Down 0.106 0.097 0.166 - -
(0.164)
0.108
Rail Depot Sales (S&G) Up 0.117 0.090 0.184 - -
(0.084) Headroom capacity of 0.238mtpa (using
1.380
0.675 updated LAA rate)
Rail Depot Sales (CR) - 0.610 0.599 0.958 - -
(0.568)
Table notes:
The LAA rates applied are those which show the highest theoretical requirement per annum (i.e., the 10-year average + the highest demand scenario).
1
The 3-year average is more than 50% higher than the LAA rate. The landbank based on the 3-year average is 9.5 years and therefore there would be a theoretical shortfall to 2033 of 0.38mt.
8West Sussex Minerals and Waste Local Plans Monitoring Report 2018/19
4. Non-Aggregate Minerals
Silica Sand
Summary
Permitted reserves (all sites) ............................................................ 0
Sales (all sites) .............................................................................. 0
No. active silica sand sites .......................................................... None
4.1 In West Sussex, silica sand occurs in the upper reaches of the Lower
Greensand formation. The Soft and Silica Sand Study confirms that
most, if not all, of the Folkestone Formation sands are likely to be capable
of containing silica sand. The 2012 Soft Sand Study showed that three
existing soft sand sites in West Sussex supplied a small amount of silica
sand (in addition to soft sand) for horticultural, agricultural and leisure
uses. As the proportion of sand sold from these sites for these uses is
small, it is not considered appropriate to maintain a 10-year landbank for
individual sites. The need to provide a supply of silica sand was
considered through the preparation of the JMLP which contains no
allocations for silica sand. Development proposals for silica sand
extraction will be considered against Policy M3 (Silica Sand) of the JMLP.
Brick Clay
Summary
Permitted reserve (all sites) ..................................................... 17.8mt
Sales (all sites) ...................................................................... 0.30mt
No. active brickworks ................................................................... Five
No. brickworks with at least 25-year Landbank ............................. Three
4.2 There are five active brick clay extraction sites in West Sussex
(Appendix B). Brick clay supply is not subject to an apportionment figure
but still has an important role to play in West Sussex and the wider
economy. Overall, there is a total permitted reserve of 17.8mt across the
five sites.
4.3 Paragraph 208 of the NPPF states that MPAs should plan for maintaining a
stock of permitted reserves to support the level of actual and proposed
investment required for new or existing plant, and the maintenance and
improvement of existing plant and equipment. For brick clay reserves
should be at least 25 years. There are currently three brickworks in West
Sussex that have landbanks of 25 years or more.
4.4 Policy M11 of the JMLP allocates an extension to West Hoathly clay pit to
provide two to three years of additional supply of Wadhurst clay.
Policy M5 (Clay) of the JMLP also allows for proposals for the extraction of
brick clay to come forward subject to criteria.
9West Sussex Minerals and Waste Local Plans Monitoring Report 2018/19
Table 2: Brick Clay Permitted Reserves and Annual Sales (2009 to 2018)
Year Total brick clay reserve Annual Sales (mt)
remaining on sites with
planning permission (mt)
2009 15.9 0.35
2010 17.3 0.39
2011 16.8 0.33
2012 14.5 0.29
2013 14.3 0.25
2014 16.1 0.35
2015 18.7 0.28
2016 18.3 0.33
2017 18.0 0.33
2018 17.8 0.30
Annual Average - 0.32
Table Notes:
For 2009, 2010, and 2015, the reserve figure has increased due to an
operator returning a figure to replace an estimate in the previous AMR.
Table 3: List of active Brickworks in West Sussex and clay type
SDNP/ Brickworks Clay Type Product Landbank
WSCC
SDNP Pitsham Brickworks Gault Formation Handmade bricks, Less than
chimneys, tiles 25 years
(Independent
works)
WSCC Wealden/Warnham Weald Clay Commercial bricks In excess of
Brickworks Formation 25 years
WSCC Laybrook Weald Clay Commercial bricks 25 years
Brickworks Formation
WSCC Freshfield Lane Wadhurst Clay; Commercial bricks In excess of
Brickworks East Grinstead 25 years
Clay; Tunbridge
Wells Sandstone
WSCC West Hoathly Wadhurst Clay Commercial bricks Less than
Formation 25 years
Table Notes:
Some information may be based on estimates therefore updated reserve
data should be provided in support of any planning applications.
10West Sussex Minerals and Waste Local Plans Monitoring Report 2018/19
Building Stone (Sandstone)
Summary
Permitted reserve ................................................................... 2.64mt
Sales .................................................................................. 0.022mt
No. active quarries ...................................................................... Four
4.5 There are four active building stone extraction sites in West Sussex
(Appendix B). Three of these sites are extracting stone for building on a
small scale and one site has diversified into landscaping stone. The
estimated permitted reserve of building stone is 2.6mt. However, it
should be noted that the permitted reserve figure may include a high
proportion of material that is not suitable as a building stone product and
is only used for bulk fill. One operator estimated that generally only 15%
of permitted reserves at quarries are viable as a building stone product.
4.6 There is no requirement for the Authorities to make provision for the
production of building stone as it is generally a small-scale industry which
provides stone of distinctive character. Paragraph 204(f) of the NPPF
requires MPAs to “consider how to meet any demands for small scale
extraction of building stone at, or close to, relic quarries needed for the
repair of heritage assets, taking into account the need to protect
designated sites”.
4.7 There are no sites allocated for the extraction of building stone in the
JMLP. Policy M6 (Building Stone) of the JMLP allows for proposals for the
extraction of building stone to come forward subject to criteria set out in
the policy.
Table 4: Building stone Permitted Reserves and Annual Sales (2009 to 2018)
Year Total building stone reserve Annual Sales (mt)
remaining on sites with
planning permission (mt)
2009 2.77 0.026
2010 2.75 0.022
2011 2.75 0.001
2012 2.73 0.024
2013 2.71 0.021
2014 2.73 (revised estimate) 0.022
2015 2.70 0.022
2016 2.70 0.022
2017 2.66 0.022
2018 2.64 0.022
Annual Average - 0.020
Table Notes:
The total permitted reserve figures include bulk fill material and building
stone.
11West Sussex Minerals and Waste Local Plans Monitoring Report 2018/19
Some information may be based on estimates therefore updated reserve
data should be provided in support of any planning applications.
Chalk
Summary
Permitted reserve ............................................................. Confidential
Sales .............................................................................. Confidential
No. active quarries ....................................................................... Two
Landbank ............................................................................ 88 years
4.8 There are two active chalk pits in West Sussex (Appendix B) and three
inactive chalk pits. The estimated landbank for 2018/19 is 88 years.
Sites that are not extracting chalk are either being used for aggregate
recycling or will remain inactive until operators have further demand for
chalk. The chalk figures fluctuate greatly, due to changes in the amount
of chalk being produced and sold and more accurate estimates of
permitted reserves being provided by operators. Since the extraction of
chalk for use in the cement making process ceased at Shoreham Cement
Works in 1991, the annual production of the mineral has declined
significantly. However, there remains a large, permitted reserve of chalk
at Shoreham Cement Works but any future working is subject to a review
of the permission.
4.9 Some of the annual production figures are shown as confidential due to
operators’ commercial confidentiality. Policy M4 (Chalk) of the JMLP
enables proposals for chalk extraction to come forward subject to the
policy criteria.
Table 5: Chalk Permitted Reserves and Annual Sales (2009 to 2018 )
Year Total chalk reserve Annual Sales (mt)
remaining on sites with
planning permission (mt)
2009 12.48 Confidential
2010 12.43 Confidential
2011 12.43 Confidential
2012 12.41 Confidential
2013 12.03 Confidential
2014 Confidential Confidential
2015 Confidential Confidential
2016 Confidential Confidential
2017 Confidential Confidential
2018 Confidential Confidential
Annual Average - Confidential
Table Notes:
For 2014/15, Upper Beeding Quarry has been excluded from the
permitted reserves because the site is currently subject to an automatic
12West Sussex Minerals and Waste Local Plans Monitoring Report 2018/19
suspension due to insufficient information being submitted to allow the
determination of the Review of Mineral Permission application. The total
permitted reserves figure cannot be shown for reasons of confidentiality.
For 2015, reserves at one site have been excluded because they have
relinquished their rights to extract chalk. There has also been a revised
estimate of the reserves at the remaining sites.
Some information may be based on estimates therefore updated reserve
data should be provided in support of any planning applications.
Oil and Gas
Summary
No. of active sites ..................................................................... Three
4.10 There are three active sites in West Sussex where oil production is
permitted; Storrington, Lidsey and Singleton (Appendix B). Oil
exploration has taken place at Markwells Wood near Rowlands Castle and
an application to allow the production of hydrocarbons for a 20-year
period (Ref: SDNP/16/04679/CM) was withdrawn during 2016/17.
Temporary planning permission (until 2021) was granted in January 2018
at Lower Stumble, Balcombe for the exploration and appraisal of the
existing hydrocarbon borehole. Temporary planning permission (until
2020) was granted in September 2018 allowing retention of the Broadford
Bridge/Woodbarn Farm oil exploration site.
4.11 There is no requirement for West Sussex to provide a landbank of oil
and/or gas. This is due to the uncertainty of where oil and gas may be
located, which means that it is not feasible to allocate oil or gas sites, or
to safeguard potential areas of oil or gas from other development, as it is
for other minerals.
Production of Secondary and Recycled Aggregates
Summary
Recycled Aggregates:
Sales .........................................................................415,000 tonnes
Capacity .....................................................................529,500 tonnes
Secondary Aggregates:
Estimated capacity .......................................... 11,000 to 56,000 tonnes
4.12 In 2018/19 it was estimated that 415,000 tonnes of Construction and
Demolition (C&D) waste was recycled. At its peak, recycled aggregate
sales have been as high as 630,000 tonnes, indicating that capacity in the
past has been higher than current estimates.
4.13 Sites in West Sussex that process recycled aggregate have an estimated
maximum capacity of 529,500tpa. The figure comprises the following:
276,000tpa at aggregate recycling sites (temporary or permanent sites
that process inert waste into aggregates);
253,500tpa at merchant transfer sites (permanent sites that process
inert waste. This figure is 75% of the total amount of C&D waste that
13West Sussex Minerals and Waste Local Plans Monitoring Report 2018/19
these sites manage which is an average of the estimated recycling rate
achieved at these sites).
4.14 There is currently adequate capacity for recycling C&D waste within West
Sussex. The temporary nature of sites means that capacity varies year to
year, and supply can often respond to demand relatively quickly.
Table 6: C&D Waste Arisings and Recycled Aggregate Production (2009-2018)
Monitoring Year C&D Waste Arisings Recycled Aggregate
(tonnes) Production (tonnes)
2009 1,340,000 629,000
2010 949,000 630,000
2011 949,000 446,000
2012 949,000 446,000
2013 1,273,000 261,000
2014 1,323,500 377,000
2015 1,002,000 393,000
2016 1,198,000 456,000
2017 1,295,500 391,000
2018 1,272,500 415,000
10-Year Average (2009-2018) 1,155,150 444,400
Table Notes:
Before 2010/11, some C&D waste was recorded as recycled but was in
fact managed in other ways.
For 2011 and 2012, the figure for recycled aggregate production is taken
from AEAT Waste Forecast Report (2013).
The figures for recycled aggregate production from 2013/14 onwards have
been updated from the previous Monitoring Reports because a new
methodology (point of production method) has been used which provides
a better estimate of C&D recycling.
4.15 In West Sussex, the by-products from chalk and building stone have been
used as secondary aggregates. Other sources of secondary aggregate
include bottom ash from waste treatment facilities at two sites. An
estimate of the likely capacity for the production of secondary aggregates
has been calculated and is presented in Table 7.
Planning permission has been granted for a waste treatment facility at
Ford which includes a gasification plant generating energy from waste
(Ref: WSCC/096/13/F). The gasification process is estimated to
produce 21,000 tonnes of residue ash each year which will be
transported off-site for recycling or concrete product manufacture.
The bottom ash from the Energy from Waste plant at Lancing is
processed for Incinerator Bottom Ash Aggregates (IBAA) Purposes. In
2014, this amounted to 11,031 tonnes.
14West Sussex Minerals and Waste Local Plans Monitoring Report 2018/19
Table 7: Estimated Secondary Aggregate Capacity Scenarios
Secondary Aggregate Capacity Capacity Capacity
Recycling Capacity Scenario 1 Scenario 2 Scenario 3
(tonnes) (tonnes) (tonnes)
Lancing Energy from Waste 11,000 11,000 11,000
Ford Energy from Waste - 21,000 21,000
Remaining sites in WLP - - 24,000 2
Total 11,000 32,000 56,000
Table Notes:
Capacity Scenario 1: Current Situation – Lancing Energy from Waste
Plant.
Capacity Scenario 2: Energy from Waste Plant + Ford Site.
Capacity Scenario 3: Lancing Energy from Waste Plant + Ford Site +
remaining capacity in WLP. To meet the shortfall of non-inert recovery
capacity of 270,000 as set out in Policy W1 of the Waste Local Plan 2014.
The remaining capacity is calculated to be 130,000tpa (270,000 –
140,000 = 130,000tpa).
The above table does not include the Horsham EfW that was permitted at
appeal in February 2020.
2
An estimate of the amount of bottom ash that could be generated from the remaining
WLP sites has been calculated using a conversion factor of 5.5. This is an average of the
conversion factors of the Lancing and Ford Sites (4.5 and 6.6 respectively).
15West Sussex Minerals and Waste Local Plans Monitoring Report 2018/19
5. Waste
Summary: Waste Arisings
Estimated total arisings were 2.2mt. Based on the high growth rate
scenario in the forecasts that underpinned the WLP, the amount of waste
that may arise in 2031 may be close to 2.3mt which is approximately
150,000 tonnes higher than anticipated when the WLP was prepared.
Most of the increase is CD&E waste which is managed by a combination of
permanent and temporary recycling sites, as well as inert recovery
projects (landscape engineering, or quarry/sandpit restorations) and the
WLP is flexible enough to respond accordingly.
The total permitted annual capacity of waste facilities is 3.1mt (of which
2.67mt is ‘operational’, and 0.42mt is ‘not operational’). The capacity is
0.8mt higher than the arisings that are expected in 2031 under the WLP
high growth scenarios.
There has broadly been a decline in landfill and a rise in recovery of MSW
and C&I waste which is in line with the WLP’s aspiration to achieve ‘zero
waste to landfill’ by 2031.
Inert waste continues to be managed higher up the waste hierarchy, with
recycling and recovery being the main management method.
Although non-hazardous landfill capacity has depleted to zero, an
allocation for further landfill remains in the WLP and the Authorities,
through the DtC, continue to monitor the situation in the South East.
The estimated remaining ‘recovery’ capacity for inert waste at permitted
sites is 3.24mt and if all the remaining sites operate at ‘full capacity’ the
remaining ‘recovery’ capacity would run out by 2021/22 but generally new
permissions are granted to meet demand.
Roles and Responsibilities
5.1 WSCC and the SDNPA, as Waste Planning Authorities (WPA), are
responsible for strategic and local waste land use planning policy,
including the preparation of local plans and determining planning
applications. WSCC is also the Waste Disposal Authority (WDA) with
responsibility for co-ordinating and managing the disposal of municipal
waste, which includes Municipal Solid Waste (MSW), some commercial
and industrial (C&I) waste, and waste deposited at Household Waste
Recycling Sites (HWRS). The district and borough councils are responsible
for the collection of waste (Waste Collection Authorities – WCA).
5.2 A Municipal Waste Management Strategy (MWMS) for West Sussex is
jointly prepared by the WDA, WCA and the Environment Agency. A Joint
Materials Resource Management Strategy (JMRMS) for West Sussex
(2005-2035) was published in 2006. The JMRMS policies, objectives and
commitments and action plan will deliver:
45% recycling and composting through the Recycling and Waste
Handling Contract ‘Reclaim’ in partnership with the District and
Borough Councils by 2015;
16West Sussex Minerals and Waste Local Plans Monitoring Report 2018/19
80,000 tonnes of waste diverted from landfill through waste prevention
per year by 2015;
0% waste growth by 2015;
the necessary waste infrastructure to meet the EU Landfill Directive
targets and increase recycling.
5.3 WSCC has a long-term contract with Viridor Waste Management Ltd,
known as ‘Recycle for West Sussex’, dealing with the recycling of waste.
This has resulted in improvements to recycling infrastructure, such as
improved HWRS and a new Materials Recycling Management Facility
(MRF).
5.4 Another contract, the Materials Resource Management Contract (MRMC),
was awarded to Biffa and began in 2010. Planning permission was
granted for a 327,000tpa Mechanical and Biological Treatment (MBT) Plant
in 2009. This deals with the further treatment and disposal of municipal
waste, after recycling.
5.5 A Refuse Derived Fuel Contract (RDF) was awarded to West Sussex
Britannia Crest Seneca Partnership. In April 2018 exports to Germany
and Holland commenced, where the RDF is used to produce heat and
power.
5.6 The contracts are supported by a range of initiatives aimed at reducing
the amount of waste generated in the county and increasing the recycling
of C&I waste.
Waste Local Plan (2014)
5.7 The WLP was adopted in April 2014 and is used as a basis for decision
making of waste applications by the County Council and the South Downs
National Park Authority. Appendix F shows how each policy is performing
against its measure/indicator. If the monitoring identifies any significant
divergence from a trend or target, intervention may be required.
5.8 The review of the WLP undertaken in 2019 has identified that, since
adoption of the Plan in April 2014, there have been no substantive
changes in national or local circumstances and the policies have generally
performed as expected. They are still considered to be consistent with
national policy, relevant and effective, and working to achieve the vision
and strategic objectives of the Plan.
Signpost
For more detailed information, please refer to the Waste Local Plan
Review 2019 on the County Council’s Minerals and Waste Policy web
pages.
17West Sussex Minerals and Waste Local Plans Monitoring Report 2018/19
Waste Arisings
5.9 Waste arisings are presented in Table 8. Arisings are calculated for each
waste stream as follows:
MSW – taken from Waste Data Flow which comprises data collected by
the Waste Management department;
C&I – ‘Point of production’ methodology. 2017/18 figures have been
rolled forward for this Monitoring Report because the South East WPAs
are in the process of working together to agree a consistent
methodology for calculating arisings;
CD&E – The ‘point of production’ methodology used in previous years
has been updated using 2018 data.
Table 8: Management of waste in West Sussex by waste stream and
management method
MSW
Monitoring Landfilled Recycled/ Other Total
Year (tonnes) Composted Recovery (tonnes)
(tonnes) (tonnes)
2009/10 227,000 169,000 0 436,000
2010/11 175,000 172,000 56,000 403,000
2011/12 171,000 170,000 84,000 425,000
2012/13 158,000 160,000 96,000 414,000
2013/14 171,000 161,000 104,000 436,000
2014/15 170,000 166,000 109,000 445,000
2015/16 164,000 169,000 114,000 3 447,000
2016/17 200,000 177,000 66,000 4 443,000
2017/18 171,000 201,000 63,000 435,000
2018/19 130,000 202,000 103,000 435,000
3
Includes 41,000 tonnes of other waste (soil, hardcore, plasterboard asbestos, etc.)
which is collected at HWRS but is not classed as household waste for reporting purposes.
Some of this waste may be recycled.
4
Includes 44,675 tonnes of other waste (soil, hardcore, plasterboard asbestos, etc.)
which is collected at HWRS but is not classed as household waste for reporting purposes.
Some of this waste may be recycled.
18West Sussex Minerals and Waste Local Plans Monitoring Report 2018/19
C&I
Monitoring Landfilled Recycled/ Other Total
Year (tonnes) Composted Recovery (tonnes)
(tonnes) (tonnes)
2009/10 163,000 288,000 65,000 517,000
2010/11 113,000 345,000 147,000 605,000
2011/12 5 113,000 345,000 147,000 605,000
2012/13 113,000 345,000 147,000 605,000
2013/14 6 78,000 390,000 220,000 688,000
2014/15 67,000 386,000 231,000 684,000
2015/16 47,000 420,000 239,000 706,000
2016/17 61,000 208,000 229,000 498,250
2017/18 64,000 204,000 188,000 456,000
2018/19 7 64,000 204,000 188,000 456,000
CD&E
Monitoring Landfilled Recycled/ Other Total
Year (tonnes) Composted Recovery (tonnes)
(tonnes) (tonnes)
2009/10 469,000 630,000 241,000 1,340,000
2010/11 282,000 446,000 221,000 949,000
2011/12 282,000 446,000 221,000 949,000
2012/13 282,000 446,000 221,000 949,000
2013/14 8
250,000 526,000 497,000 1,273,000
2014/15 315,000 418,500 440,500 1,174,000
2015/16 323,000 449,000 230,000 1,002,000
2016/17 411,000 456,000 331,000 1,198,000
2017/18 683,000 391,000 221,000 1,295,000
2018/19 654,000 415,000 203,000 1,272,500
2018/19 Totals 848,000 821,000 494,000 2,163,000
5
Figures rolled forward from 2010/11 as no waste forecast was carried out.
6
The figures for C&I arisings from 2013/14 onwards have been based on the ‘Reconcile’
methodology that considers a number of datasets to capture the quantities of C&I waste
that are managed.
7
The figures for C&I arisings in 2018/19 have been rolled forward from 2017/18.
Should any updated data become available, the AMR will be updated.
8
The figures for C&D arisings from 2013/14 onwards have been updated from the
previous Monitoring Reports because a new methodology (point of production method)
has been used which provides a better estimate of C&D recycling.
19West Sussex Minerals and Waste Local Plans Monitoring Report 2018/19
5.10 The updated arisings are compared against the baseline figures in the
WLP and the forecasted growth rates that underpinned the WLP. The
forecasts were based on ‘upper’, ‘base case’ and ‘lower’ growth rates
(Table 9). Although it was deemed that the ‘base case’ was the most
likely to happen, the WLP was prepared in order to be flexible enough to
allow for the lower and higher growth rates to be achieved. For the
purposes of this Monitoring Report, the waste arisings since the adoption
of the WLP have been assessed against the higher growth rates.
Table 9: WLP Growth Rates
Waste Stream Lower Base Case Higher
Municipal Solid Waste (MSW) -0.5% 0% +0.5%
Commercial -1.0% 0% +1.0%
Industrial -2.0% -1.0% -1.0%
Construction, Demolition and Excavation (CD&E) 0% 0% 0.5%
MSW
5.11 MSW arisings are monitored by the Waste Management department at
WSCC. The total MSW arisings figure for 2018/19 is 435,000 tonnes.
Figure 1 shows the baseline and high growth forecasts that underpinned
the WLP, as well as updated forecasts, taking account of actual arisings
since adoption of the WLP. It shows that MSW arisings have been slightly
higher than had been anticipated, with a peak in 2015 of 447,000 tonnes,
compared to the anticipated (baseline) 2015 figure of 413,000 tonnes.
The updated arisings data suggests that MSW arisings may be as high as
467,000 tonnes in 2031, rather than 445,000 tonnes, that was forecast in
the high growth scenario underpinning the WLP. This only represents an
increase of 22,000 tonnes, which is not considered significant.
5.12 The amount of MSW waste going to landfill has been falling since 2013 to
its lowest in 2018/19 (130,000 tonnes) and recovery has been broadly
increasing. There was a deviation from this trend in 2016/17 and
2017/18 due to an interim contract to send waste to landfill. Since
2017/18 recycling rates have been rising in line with the rates forecasted
in the scenarios 9. Prior to this, they were below 45%. The management
of MSW waste is broadly performing in line with the scenarios that
underpinned the WLP for an increase in recycling rates, an increase in
waste going to recovery and a declining amount going to landfill which is
in line with the WLP’s aspiration to achieve ‘zero waste to landfill’ by 2031.
9
Ricardo – AEA (2013). West Sussex Waste Forecasts and Capacity Review 2013.
20West Sussex Minerals and Waste Local Plans Monitoring Report 2018/19
Figure 1: MSW Waste Arisings and Forecasts (2013-2031)
Figure 2: MSW Arisings by Management Type (2013-2031)
21West Sussex Minerals and Waste Local Plans Monitoring Report 2018/19
C&I Waste
5.13 C&I arisings are calculated using the ‘reconcile method’ which was
updated in 2016 from the ‘point of production’ method that was used to
underpin the WLP. Rather than applying data based on business profiles
and waste production factors, a method first applied in 2009 through a
Department of Environment, Food & Rural Affairs (DEFRA) survey, the
‘reconcile method’ makes use of data published in the Environment
Agency (EA), which is collated via data that operators must submit to the
EA as part of the waste permitting regime. This methodology was
deemed to be sound at examinations of other authority plans nationally,
therefore, this approach was also applied to West Sussex. The total C&I
arisings figure for 2018/19 is 456,000 tonnes. Figure 3 shows the
baseline and high growth forecasts that underpinned the WLP, as well as
updated forecasts, taking account of actual arisings since adoption of the
WLP (to 2017).
5.14 Figure 3 shows that arisings are likely to be lower than originally
anticipated, with a fall of almost 200,000 tonnes between 2015 and 2016
(due to the change in methodology). When applying the new
methodology and using that as the basis for the updated forecasts, it
shows that in 2031, C&I arisings may be 524,000 tonnes, rather than the
originally forecasted 701,000 tonnes. This means that, in 2031, C&I
arisings will likely be 177,000 tonnes lower than anticipated (at the
highest growth rates) when the WLP was prepared.
5.15 The amount of C&I waste going to landfill has been falling since 2013
(from 113,000tpa), down to between 47,000 and 64,000 tonnes per
annum in the last four years, and recovery has been broadly increasing
which is in line with the WLP’s aspiration to achieve ‘zero waste to landfill’
by 2031. Recycling rates were broadly in line with the scenarios that
underpin the WLP until 2016/17 when it fell to between 42% and 45%
which could be as a result of the rise in recovery rates at the same time.
C&I recycling rates are between 12% and 18% below those forecasted in
the WLP.
22West Sussex Minerals and Waste Local Plans Monitoring Report 2018/19
Figure 3: C&I Waste Arisings and Forecasts (2013-2031)
Note: The arisings data for C&I waste since adoption of the WLP is produced as
a single figure. The growth rates however vary for the commercial and industrial
elements of the waste streams. In order to overcome this (as it is not clear
what the split is between the two elements of the stream), a 1% uplift has been
applied to the higher growth rate. This sets an over estimation but is considered
to be more accurate than attempting to split it and risk under forecasting.
Figure 4: C&I Arisings by Management Type (2013-2031)
23West Sussex Minerals and Waste Local Plans Monitoring Report 2018/19
CD&E Waste
5.16 Arisings for CD&E waste in 2018/19 were calculated using the ‘reconcile
methodology’ methodology which was considered to be a more accurate
was of forecasting CD&E arisings. The ‘reconcile methodology’ has been
used since 2013/14.
5.17 Figure 5 shows that CD&E waste arisings are anticipated to be higher than
the forecasts that underpinned the WLP. In 2031, it is anticipated that
CD&E waste arisings could be as high as 1.4 million tonnes (high growth
scenario) which is 350,000 tonnes higher than the original high growth
forecast at 2031 (1.05mt).
5.18 The percentage of CD&E waste being recycled has fallen steadily over the
10-year period, notably since 2013/14, and has been below the recycling
rates in the scenarios that underpinned the WLP forecasts. This pattern
can be explained by the change to the ‘reconcile’ methodology in
2013/14. Although the percentage of CD&E waste going to landfill is on a
broadly upward trend, most of the inert element is likely to be used in
recovery projects such as engineering operations and the restoration of
former mineral workings and can therefore be classed as ‘recovered’.
Figure 5: CD&E Waste Arisings and Forecasts (2013-2031)
24West Sussex Minerals and Waste Local Plans Monitoring Report 2018/19
Total Waste
5.19 The estimated overall arisings of controlled waste in West Sussex in
2018/19 was 2.2mt. Figure 6 sets out a combined forecast for all waste
streams and compares it to the forecasts that underpinned the WLP. It
shows that the amount of waste that may arise in 2031 may be close to
2.3 million tonnes (high growth); approximately 150,000 tonnes higher
than anticipated when the WLP was prepared. This is not considered to be
a significant amount and the WLP could respond accordingly. The major
increase in waste is anticipated in CD&E waste, of which 75% is inert
waste that is recovered for beneficial use, following recycling.
Table 10: Updated waste forecast (high growth)
Waste Stream Original High Growth Updated High Growth Difference
Forecast (at 2031) Forecast (at 2031)
MSW (0.5%) 445,000 464,000 +19,000
C&I (1%) 701,000 519,000 -182,000
CD&E (0.5%) 1,049,000 1,358,000 +309,000
Total 2,195,000 2,341,000 +146,000
Figure 6: All waste arisings and forecasts (2013-2031)
25West Sussex Minerals and Waste Local Plans Monitoring Report 2018/19
Waste Management Capacity in West Sussex
5.20 A summary of the waste capacities (‘operational’ and ‘not operational’) for
each waste management type and a list of sites is presented in
Appendix B. The waste site capacity data has been updated for this
monitoring report using information from the waste survey, the
Environment Agency’s Waste Data Interrogator, discussions with
operators and Development Management colleagues.
Built Waste Management Capacity
5.21 There has been a general increase in capacity across all waste
management categories from the baseline capacities in the adopted WLP.
Total capacity (for all waste facilities, excluding that for inert recovery and
non-inert landfill), is circa 3.1mt (2.67mt = ‘operational’ and 0.42mt =
‘not operational’). The high growth scenario (which was planned for in
order to give contingency), shows that arisings may be as high as 2.3mt
which means that current planned capacity is 0.8mt higher than the
arisings expected in 2031 under the high growth scenarios. Table 11
shows waste site capacities against the shortfalls in Policy W1 of the WLP.
In summary this shows:
Transfer capacity - New capacity has been permitted to meet the
shortfalls in Policy W1. There is an additional 15,000 tonnes of
capacity that is ‘not operational’ at this time also. If the recycling,
recovery, and renewable energy facility allowed on appeal in
February 2020 at the Former Wealden Brickworks, Langhurstwood
Road, Horsham (WSCC/015/18/NH) is implemented, this will
supersede the transfer capacity that is currently operational at the site
which may result in a shortfall;
Recycling and composting of non-inert waste - New capacity has
been permitted to meet the shortfalls in Policy W1. There is also an
additional 75,000 tonnes of capacity that is currently ‘not operational’.
The figures for recycling capacity and the shortfalls/surplus (Table 11)
should be treated with some caution as recycling capacity includes an
amount that may take place at transfer sites which is difficult to assess
due to the range of activities taking place at these sites;
Aggregate Recycling – There is 518,250 tonnes of ‘operational’
recycling capacity and a further 11,250 tonnes of capacity at permitted
sites that are ‘not operational’. There is no shortfall in the WLP for
aggregate recycling, but when compared to estimated sales, there is a
headroom capacity of at least 103,250 tonnes. The temporary nature
of aggregate recycling sites means that capacity tends to fluctuate
annually. There will continue to be a need to restore quarries and
therefore a need for new aggregate recycling sites to be permitted as
temporary sites close;
Non-inert waste recovery – There is no new ‘operational’ capacity
since the WLP was adopted, meaning operationally, there is still a
shortfall of 270,000 tonnes. However, there is 320,000 tonnes of
permitted capacity that is ‘not operational’ yet, which, if implemented,
would lead to a surplus of 100,000 tonnes.
26West Sussex Minerals and Waste Local Plans Monitoring Report 2018/19
5.22 It is important to note that there is a need for a mix of facilities to deal
with the various waste streams and types and that sites such as transfer
stations do not provide a final treatment/disposal for waste, as they
largely store, sort, bulk and move waste on for treatment/disposal at
other facilities. This often results in waste being recorded at multiple
facilities, resulting in double counting in the Environment Agency data.
5.23 Policy W10 of the WLP allocates five sites for meeting the identified
shortfalls (for C&I and CD&E built waste facilities) – Table 11. Two sites
remain unpermitted for permanent built waste facilities at the allocations,
with a total potential capacity of 250,000tpa which when combined with
the current capacity (if permitted), would provide a total of 3.4mt, over
1 million tonnes higher than the expected arisings in 2031.
Figure 7: Capacity and Arisings 2018/19
Note: The capacities include all transfer capacity and the contribution transfer
sites make to recycling therefore there is an element of double counting.
Non-Inert Landfill
5.24 There are currently no active non-inert landfill sites in the county.
Brookhurst Wood landfill stopped accepting non-hazardous waste in 2018
and Lidsey landfill stopped accepting non-inert waste in December 2015.
Both sites are now being restored.
5.25 The WLP identified a 0.61mt shortfall in non-inert landfill capacity and
Policy W10 (Strategic Waste Allocations) allocates an extension to the
Brookhurst Wood landfill site which could provide 0.86mt of additional
capacity if required. Planning permission was granted in January 2020 for
a soil heat treatment facility (WSCC/050/19/NH) and a soil washing
facility (WSCC/051/19/NH) on the proposed allocation for non-inert landfill
27You can also read