Regional Investment Plan Continental Central East - January 2021 Version for ACER opinion - NET
←
→
Page content transcription
If your browser does not render page correctly, please read the page content below

Ten-Year
Network
              Regional Investment Plan
              Continental Central East
Development
Plan 2020

              January 2021 · Version for ACER opinion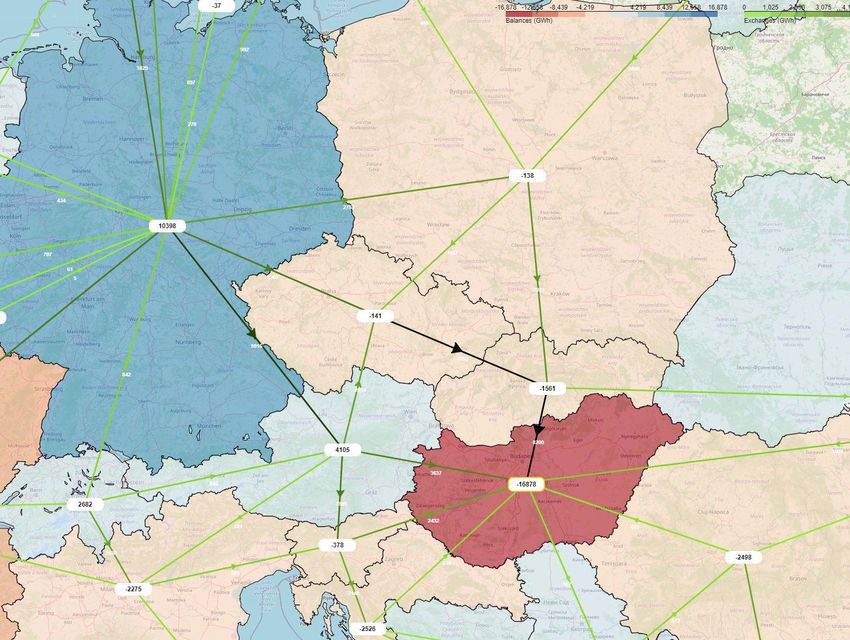
REGIONAL INVESTMENT PLAN 2020 - CONTINENTAL CENTRAL EAST

                                                          TABLE OF CONTENTS

1.         EXECUTIVE SUMMARY ............................................................................................ 4

     1.1 Key messages of the Continental Central East (CCE) region ............................................................................................ 4
         1.1.1 Generation mix change ...................................................................................................................................................... 4
         1.1.2 The extension of a synchronously connected Europe................................................................................................. 6
         1.1.3 Identified system needs ...................................................................................................................................................... 7
     1.2 Future capacity increases ............................................................................................................................................................. 8

2.         INTRODUCTION ....................................................................................................... 10

     2.1 Regional Investment Plans as foundation for the TYNDP 2020 .................................................................................... 10
     2.2 Legal requirements..................................................................................................................................................................... 11
     2.3 Scope and structure of the Regional Investment Plans ..................................................................................................... 12
     2.4 General methodology ................................................................................................................................................................ 13
     2.5 Introduction to the region ......................................................................................................................................................... 13

3.         REGIONAL CONTEXT ............................................................................................. 15

     3.1 Present situation ............................................................................................................... Error! Bookmark not defined.
     3.2 Description of the scenarios ..................................................................................................................................................... 24
     3.3 Future challenges in the region ............................................................................................................................................... 32
         3.3.1 Generation mix change ................................................................................................................................................... 32
         3.3.2 System needs identified in the Pan-European IoSN process ................................................................................. 36
         3.3.3 Extension of a synchronously connected Europe ..................................................................................................... 37

4.         REGIONAL RESULTS ............................................................................................... 41

     4.1 Future capacity needs ................................................................................................................................................................ 41
     4.2 IoSN results ................................................................................................................................................................................. 45
         4.2.1 IoSN 2030 results ............................................................................................................................................................. 45
         4.2.2 IoSN 2040 results ............................................................................................................................................................. 49

5.         Additional Regional Studies......................................................................................... 54

     5.1 Detailed analysis of the data in the TYNDP 2018 and TYNDP 2020........................................................................... 54
     5.2 CO2 price changes ..................................................................................................................................................................... 55
     5.3 Gas power plants capacity decrease in combination with reduced nuclear capacity ................................................. 58
     5.4 Lignite and coal fired power plants installed capacity ...................................................................................................... 61
     5.5 Coal phase-out in Germany ..................................................................................................................................................... 63
     5.6 Conclusion ................................................................................................................................................................................... 64

Appendices ........................................................................................................................... 65

ENTSO-E | Rue de Spa, 8 | 1000 Brussels | info@entsoe.eu | www.entsoe.eu | @entso_e                                                                                                     Page 2 of 92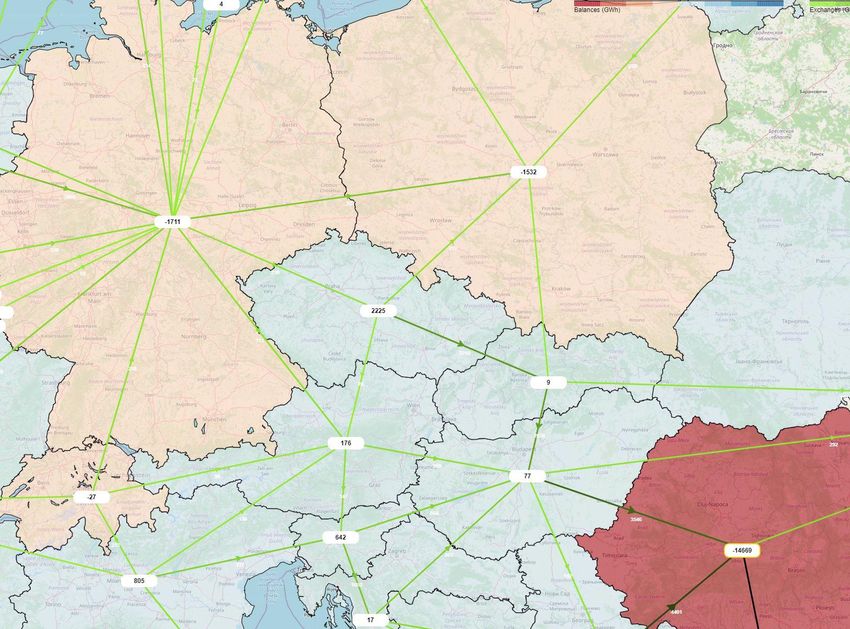
REGIONAL INVESTMENT PLAN 2020 - CONTINENTAL CENTRAL EAST

    Appendix 1. Links to National Development Plans .................................................................................................................. 65
    Appendix 2. Projects ........................................................................................................................................................................ 66
      Pan-European projects ............................................................................................................................................................... 66
      Regional projects ........................................................................................................................................................................ 67
    Appendix 3. Glossary ....................................................................................................................................................................... 89

ENTSO-E | Rue de Spa, 8 | 1000 Brussels | info@entsoe.eu | www.entsoe.eu | @entso_e                                                                                                Page 3 of 92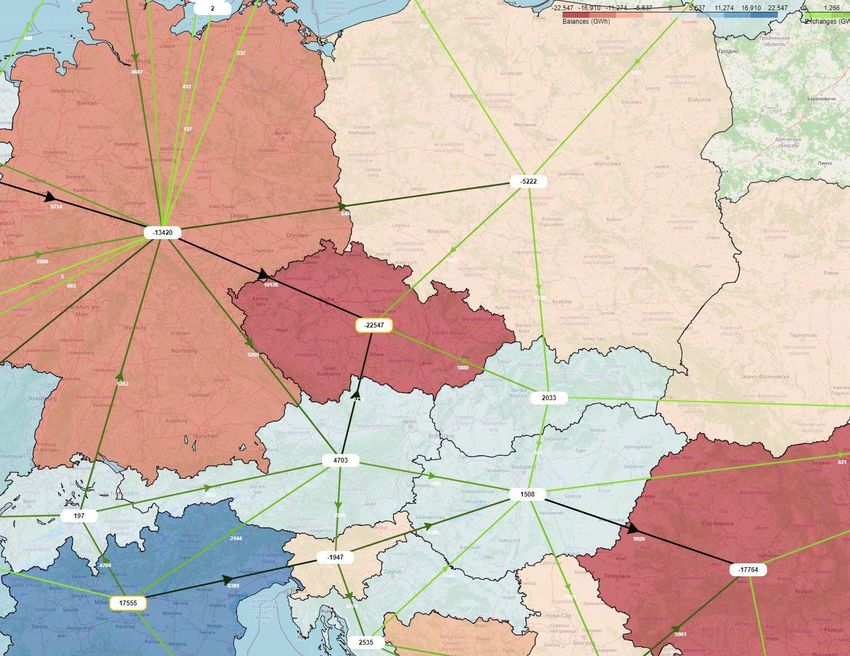
REGIONAL INVESTMENT PLAN 2020 - CONTINENTAL CENTRAL EAST

     1. EXECUTIVE SUMMARY

1.1 Key messages of the Continental Central East (CCE)
region
The main drivers and challenges that the Continental Central East (CCE) region will have to cope with in the
future development scenarios are primarily changes in the power generation mix and the possible extension
of the synchronous area of Continental Europe. These challenges necessitate the development of the
transmission grid, in order to maintain the security and reliability of the current and future European
interconnected transmission systems operations at large.

1.1.1 Generation mix change

As seen in other pan-European regions, the current CCE region generation portfolio reveals a continuation
in renewable generation capacity expansion, compared to previous years. This fundamental and significant
change in evolution of the power generation mix in the CCE region is seen as one of the key drivers for grid
development, both currently and in future generation scenarios. This ongoing significant increase in
Renewable Energy Sources (RES) is taking place in tandem with the sequential decommissioning of old
nuclear and coal/lignite power plants in some countries in the region. In contrast, some countries in the CCE
region are planning to construct new nuclear power plants as replacements for older, phased-out units.
RES installed capacities in the future development scenarios are increasing in each CCE member from 70%
to 135% between 2018 by 2030. These increases are fulfilling binding targets set by each EU Member State
for 2020 and 2030, in order to reduce greenhouse gas emissions, diversify energy supplies and improve
Europe’s industrial competitiveness.
There is no common policy primarily for the use of coal and lignite power plants in the CCE, as some countries
expect to shut down their thermal power plants, as modernisation is not beneficial. Other countries are
considering them in their future energy portfolios as they will be needed to maintain the secure operation
of their energy systems, as flexible power plants - primarily gas - in the system with high RES penetration.
The stagnation or decrease of fossil power plants is considered in each CCE power system in the future
scenarios, except Romania, Austria, Hungary and Slovenia where stagnation or a slight increase is considered
between 2030 and 2040 scenarios.
Regarding nuclear power plants in the energy policies of CCE countries, there are different long-term
perspectives. Germany, for example, is aiming to shut down all its nuclear plants by 2022 – a decrease of
nuclear installed capacity from 10GW in 2018 to 0GW in 2025, while Austria does not consider having nuclear
power in its energy portfolio at all. However, countries such as the Czech Republic, Hungary, Romania,
Slovakia, Slovenia and Poland are all considering minor and major nuclear power projects in their portfolios
in the future, following a decarbonisation path. When comparing nuclear power development in the CCE
region, slight decreases and slight increases by both 2030 and 2040 are considered, depending on the
scenario.
All these changes indicate that energy will be generated in different locations, which means that the power
exchange patterns in the CCE region will change, and the affected Transmission System Operators (TSOs) will

ENTSO-E | Rue de Spa, 8 | 1000 Brussels | info@entsoe.eu | www.entsoe.eu | @entso_e                  Page 4 of 92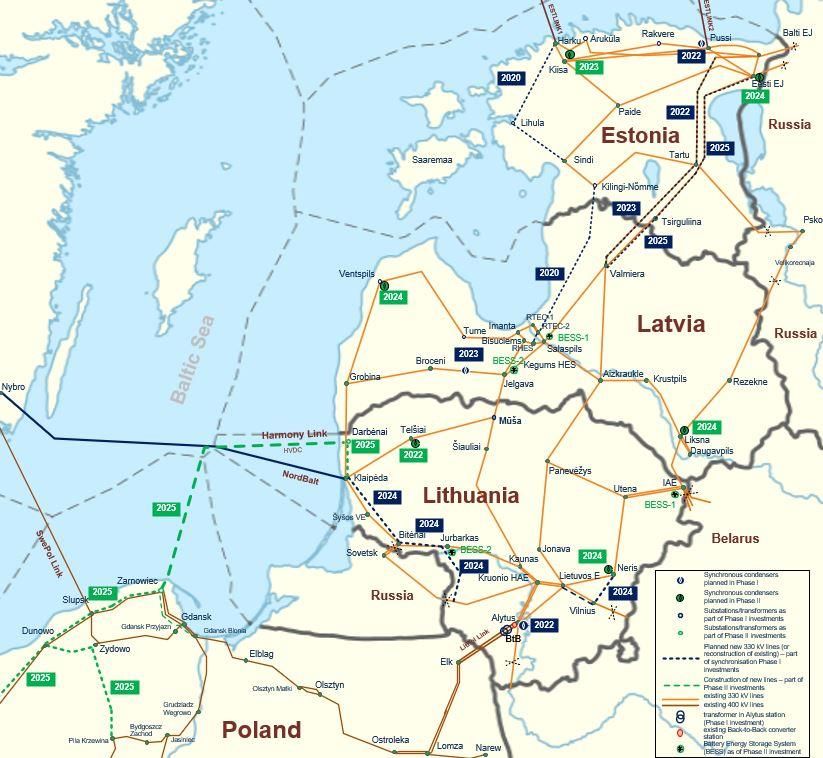
REGIONAL INVESTMENT PLAN 2020 - CONTINENTAL CENTRAL EAST

have to develop their transmission grids to cope with these changes. It is also expected that these changes
will continue and will remain one of the main challenges in the future development planning scenarios.
However, there are substantial differences in the energy policies of countries in the CCE region regarding
nuclear and fossil-fuel power plants; Some will include them in future power generation mixes while others
will not. Taken together, the rapidly increasing integration of renewables, the decommissioning of older
traditional power plants and the unprecedented level of uncertainty regarding long-term energy policies, all
impose a major challenge to grid planners and may cause a fundamental change in transmission system
development plans. In this context, there is a significant risk of locking-in to inefficient investment planning
solutions.
The above-mentioned facts are depicted in Figure 1-1, which shows a comparison in the generation mix in
2018 and future development scenarios up to 2040. These were analysed by the Identification of System
Needs process under the TYNDP 2020 umbrella.
More detailed analysis of the possible evolution of the CCE power generation portfolio is presented in
Chapter 3.3.

          Figure 1-1:Error! No text of specified style in document. Comparison of the changes in the nuclear, thermal
                     and RES installed capacities between 2018, 2025, 2030 and 2040 scenarios

ENTSO-E | Rue de Spa, 8 | 1000 Brussels | info@entsoe.eu | www.entsoe.eu | @entso_e                        Page 5 of 92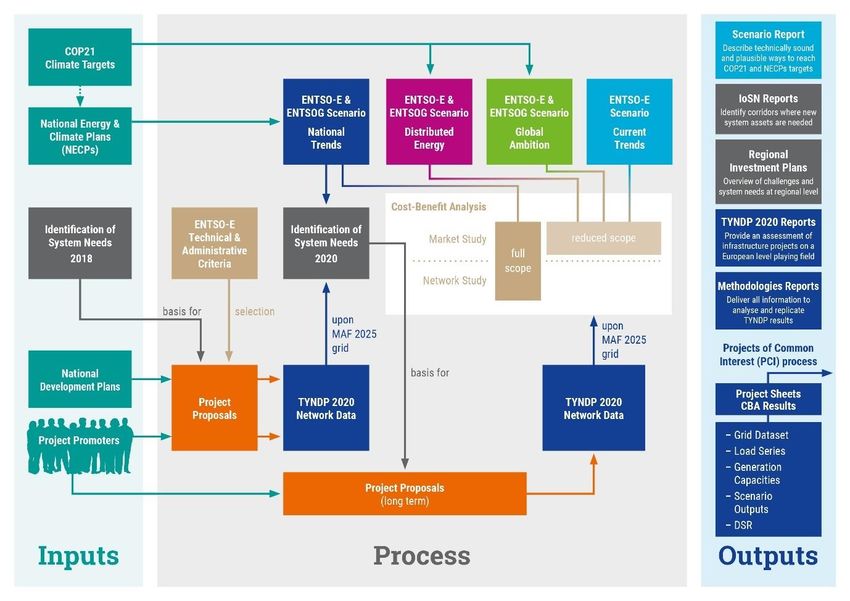
REGIONAL INVESTMENT PLAN 2020 - CONTINENTAL CENTRAL EAST

1.1.2 The extension of a synchronously connected Europe

Some of the main goals for the integration of power systems that are not currently synchronously operated
with Continental Europe are: improving energy security, effectively using energy resources and significantly
increasing power exchange capabilities. These goals have been also been declared by representatives in
Ukraine, Moldova and the Baltic countries, which are also considering future development plans to
synchronously connect with the Continental Europe (CE) power grid. This will be one of the future CCE region
challenges, as Ukraine and Moldova will synchronously connect through Romania, Hungary, Slovakia and
Poland. The LitPol interconnection that connects the 400kV Alytus substations in Lithuania with Elk in Poland
is seen as a good example that will significantly increase the interconnection level of Poland, and the three
Baltic States - Estonia, Latvia and Lithuania - which are considered important players when it comes to the
integration of the EU electricity market.

The synchronous connection of the Ukrainian and Moldovan power system to the CE area
The Ukrainian and Moldovan power systems are currently synchronously connected with the IPS/UPS system
from Russia and Belarus. However, one part of the integrated power system (IPS) in Ukraine, the so-called
‘Burshtynska TPP Island’, is synchronously connected to Slovakia, Hungary and Romania via 220, 400 and
750kV transmission lines.
A technical feasibility study regarding the synchronous connection of the Ukrainian and Moldovan power
systems to the CE, was finalised in January 2016, where the possibility of the synchronous integration of their
power systems into ENTSO-E was analysed. The study confirmed the absence of fundamental obstacles, but
did however reveal several technical problems, that would require detailed analysis before being fixed. All of
these issues highlighted in the study, together with the conditions for synchronous interconnection to the
Continental power grid that need to be fulfilled, are introduced in the ‘Agreements on the conditions of the
future interconnection of the power systems of Ukraine/Moldova with the power system of Continental Europe’,
ratified in June 2017 and entered into force on 7 July 2017. These agreements are considered as the starting
point for the synchronous interconnection process of Ukrainian and Moldovan power systems with the CE
power system. Additional studies began in April 2020 to describe in detail, the technical measures necessary
to be implemented.

The Baltic power system’s synchronous connection to the CE synchronous area
The Baltic countries are currently synchronised with the Russian/Belarus IPS/UPS system. Interconnection
through direct current lines is achieved via the Nordic synchronous area and Poland. The Baltic countries
have expressed their intention to synchronously connect to the CE synchronous area by 2025.
The synchronisation project began on 28 June 2018, when European Commission President Jean-Claude
Juncker, together with leaders of Lithuania, Latvia, Estonia and Poland agreed on the Political Roadmap on
the synchronisation of the Baltic States' electricity networks with the Continental European Network, via
Poland by the target date of 2025. In line with the Political Roadmap on the synchronisation of the Baltic
States' electricity networks with the Continental European Network via Poland, the BEMIP High Level Group
(senior-official level) on the synchronisation project, on 14 September 2018, agreed on the technical and
economic feasibility of the synchronisation option. This consisted of the existing double-circuit AC line
between Poland and Lithuania (LitPol Link), complemented by the construction of an offshore HVDC link
together with other optimisation measures, including synchronous condensers.

ENTSO-E | Rue de Spa, 8 | 1000 Brussels | info@entsoe.eu | www.entsoe.eu | @entso_e                   Page 6 of 92
REGIONAL INVESTMENT PLAN 2020 - CONTINENTAL CENTRAL EAST

Figure 1-2 shows the schematic visualisation of the Ukrainian, Moldovan and Baltic power systems’ future
synchronous integration with CE power system. This is considered crucial for the CCE region as the above-
mentioned power systems will be interconnected with the CCE power systems.

              Figure 1-2:Error! No text of specified style in document. Schematic visualisation of the synchronous
                              European grid future extension (through the CCE region)
1.1.3 Identified system needs

The main goal of the Pan-European Identification of System Needs study is to reveal the substantial gaps
between generation and transmission grid development, in future scenarios and the current situation. Based
on these results, the following substantial future system problems that need to be addressed have been
identified:
     ▪    Insufficient integration solutions of renewables into the power systems, as high amounts of curtailed
          energy occurred in several power systems
     ▪    High system costs, in particular market areas and high price differences between market areas
     ▪    High CO2 emissions
     ▪    Change of the net annual balances and load flow pattern in the region causing possible cross-border
          and internal bottlenecks
In addition to the above-mentioned needs from the Identification of System Needs (IoSN) process, the
following needs - based on the results of the discussion of countries and TSOs constituting the European
priority electricity corridor of north-south electricity interconnections in Central, Eastern and South-Eastern
Europe - were also identified:
     ▪    Infrastructure to mitigate high price differentials (market integration) will be needed in Austria,
          Germany, Poland, Romania, Slovenia and Hungary
     ▪    Infrastructure to address system adequacy deficiencies (adequacy - SoS) is needed in Poland
     ▪    Infrastructure to address generation portfolio (SoS) to accommodate significant changes in
          generation mix will be needed in Croatia, Hungary, Germany, Poland, Romania and Slovakia
     ▪    Infrastructure to improve system flexibility and stability (SoS) primarily due to RES integration will be
          needed in Austria, the Czech Republic, Germany, Hungary, Poland, Romania and Slovakia
     ▪    Infrastructure to reduce RES curtailment (Sustainability) will be needed in Germany and Romania
     ▪    Internal infrastructure will be needed to reduce the internal bottlenecks and manage the loop flows
          in Austria, the Czech Republic, Germany, Poland and Slovakia.

ENTSO-E | Rue de Spa, 8 | 1000 Brussels | info@entsoe.eu | www.entsoe.eu | @entso_e                         Page 7 of 92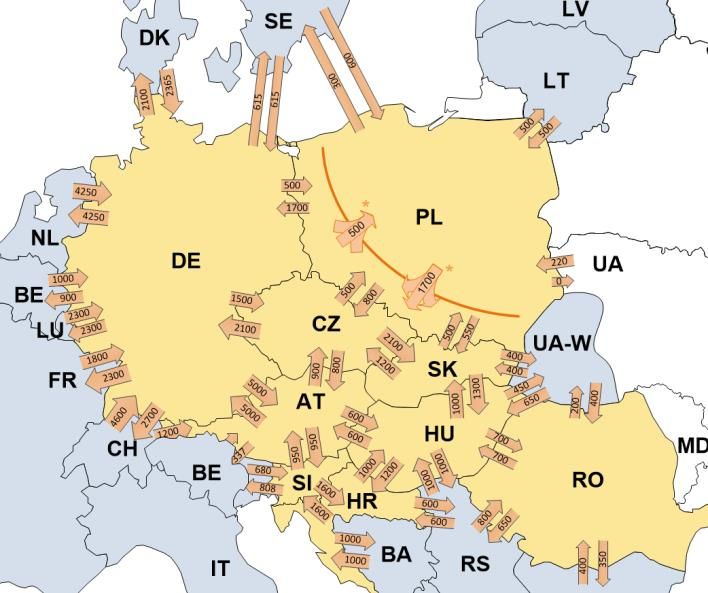
REGIONAL INVESTMENT PLAN 2020 - CONTINENTAL CENTRAL EAST

1.2 Future capacity increases
The challenges and needs of the power systems and grid development for the future 2030 and 2040 scenarios
have all been identified in the Pan-European IoSN report. To fulfil the needs and improve the overall and
regional parameters of delivering a secure and effective power systems operation, the need to increase future
cross-border capacities have been identified as well.
To analyse system needs up to 2030 and 2040, ENTSO-E determined the combination of potential increases
in cross-border network capacity that minimises the total system costs, composed of total network
investment and generation costs. To do that, a panel of possible network increases was proposed to an
optimiser, who chose the most cost-efficient combination. To take into account the mutual influence of
capacity increases, the analysis was performed simultaneously for all borders. The combination of network
increases minimising costs identified through this process is called ‘SEW-based needs’. The overview of
SEW-based needs identified cross-border capacity increases in the CCE region is presented in Figure 1-3,
coloured as blue, green and violet.

           Figure 1-3: Identified capacity increases at the CCE region borders in the 2030 and 2040 time horizons

The SEW-based needs is a depiction of the needed effective cross-border transfer capacity increases
necessary for a cost-optimised operation in the 2030 and 2040 systems. It is important to note that
considerations in terms of system resilience, system security, or other societal benefits are not included in
this analysis. The cost-optimised operation of the 2030 and 2040 systems is a function of the cost estimates
for the cross-border capacity increases and generation costs, with internal reinforcements of the grid either
partially considered or not considered at all.
While the optimisation process behind this analysis aimed for a robust identification of the cost-optimised
system, the inherent complexity of the power system implies that different depictions of the needed cross-
border capacity increases, lead to results with practically similar benefits. Figure 1-3 captures this effect for
those borders where a different SEW-based needs solution would lead to similar benefits and would
therefore suggest that it is a well-identified need without being part of the SEW-based needs base solution
- these capacity increases so called ‘additional capacity increases’ (coloured as orange in Figure 1-3) do
not constitute an alternative grid solution, as they do not all belong to the same grid solution).
In particular, considering the sensitivity of the analysis on the cost-estimates used for the optimisation
process, these possibilities must be considered in order not to misdirect the sound development of the

ENTSO-E | Rue de Spa, 8 | 1000 Brussels | info@entsoe.eu | www.entsoe.eu | @entso_e                     Page 8 of 92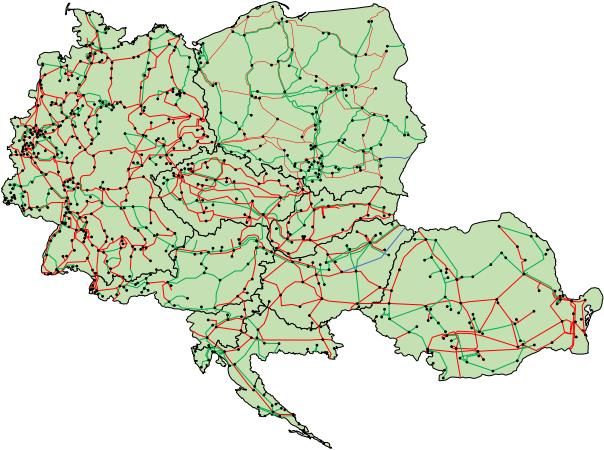
REGIONAL INVESTMENT PLAN 2020 - CONTINENTAL CENTRAL EAST

necessary infrastructure. This is especially important in the subsequent steps where further analyses in terms
of environmental impact, viability, benefits beyond SEW and refined costs are carried out in order to
complement the definition of the best project portfolio.
The future needs of the interconnected European power system to cope with such a long-term generation
mix development, that should be solved by the identified cross-border capacity increases, are:
     •    Insufficient integration of renewables into the power systems, as high amounts of curtailed energy
          occurred in a couple of power systems
     •    Insufficient market integration - high system costs in particular market areas and high price
          differences between the market areas
     •    High CO2 emissions
     •    Insufficient cross-border capacities
     •     ‘Future capacity needs’, which has been identified as being a part of the IoSN process, which is
          primarily due to the change of the overall situation in the power systems in future scenarios (load-
          flow pattern changes, therefore the transmission system elements limiting the cross-border capacity
          in 2020 time horizon changed in 2040, due to the generation mix change - installed capacities and
          location in the power systems) as well as the strengthening of the grid infrastructure.
The identified future capacity needs on the cross-border profiles in the CCE region could potentially be
covered, fully or partly, by the future transmission projects included in the TYNDP 2020 process, or will remain
necessary for future grid development. More detailed analysis of the future capacity increases is included in
Chapter 4.1.
A pan-European overview of all the above mentioned cross-border capacity increases, together with the
methodology of the IoSN process, is presented in the report ‘Completing the map - Power system needs in
2030 and 2040’ developed by ENTSO-E in parallel with RegIPs 2020.

ENTSO-E | Rue de Spa, 8 | 1000 Brussels | info@entsoe.eu | www.entsoe.eu | @entso_e                    Page 9 of 92
REGIONAL INVESTMENT PLAN 2020 - CONTINENTAL CENTRAL EAST

     2. INTRODUCTION

2.1 Regional Investment Plans as a foundation for the
TYNDP 2020
ENTSO-E’s Ten-Year Network Development Plan (TYNDP) is the most comprehensive planning reference for
the pan-European electricity transmission network. Released every even year, it presents and assesses all
relevant pan-European projects at a specific time horizon, as defined by a set of scenarios to describe the
future development and transition of the electricity market. The TYNDP serves as a basis to derive the EU list
of European Projects of Common Interest (PCI).
An essential part of the TYNDP 2020 package, the six Regional Investment Plans, address challenges and
system needs at the regional level, for each of ENTSO-E’s six system development regions (Figure 2-1).

                                        Figure 2.1 ENTSO-E’s six system development regions

The regional investment plans are part of the TYNDP 2020 package, which also includes, among others, the
report ‘Completing the map - Power system needs in 2030 and 2040’ and the Scenarios report, describing
the scenarios that serve as basis for the system needs study and the regional investment plans.

ENTSO-E | Rue de Spa, 8 | 1000 Brussels | info@entsoe.eu | www.entsoe.eu | @entso_e                Page 10 of 92
REGIONAL INVESTMENT PLAN 2020 - CONTINENTAL CENTRAL EAST
Figure 2.2 Overview of the TYNDP 2020 process and outputs
2.2 Legal requirements
Regulation (EU) 2019/943 Article 34 (recast of Regulation (EC) 714/2009) states that TSOs shall establish
regional cooperation within ENTSO-E and shall publish regional investment plans every two years. TSOs may
take investment decisions based on regional investment plans. Article 48 further states that ENTSO-E shall
publish a non-binding and community-wide, Ten-Year Network Development Plan. This will be built on
national investment plans and will take into account regional investment plans and the reasonable needs of
all system users, as well as identifying investment gaps.
In addition, the TYNDP package complies with Regulation (EU) Nº 347/2013, which defines new European
governance and organisational structures to promote transmission grid development.
ENTSO-E | Rue de Spa, 8 | 1000 Brussels | info@entsoe.eu | www.entsoe.eu | @entso_e Page 11 of 92REGIONAL INVESTMENT PLAN 2020 - CONTINENTAL CENTRAL EAST
2.3 Scope and structure of the Regional Investment
Plans
The Regional Investment Plans are based on pan-European market study results, combined with European
and/or regional network studies. They present the current situation of the region as well as expected future
regional challenges, considering a 2040 time-horizon. To illustrate circumstances that are particularly relevant
to each region, available regional sensitivities and other available studies are included in the plans. The
operational functioning of the regional system and associated future challenges may also be addressed.
As one of the solutions to future challenges, the TYNDP project has performed market and network studies -
for the long-term 2040 time horizon National Trend scenario - to identify investment needs such as cross-
border capacity increases and any other related necessary reinforcements of the internal grid, that can help
mitigate these challenges.
In addition, the Regional Investment Plans list the regional projects from the TYNDP 2020 project collection.
In the summer of 2020, each of these projects will be assessed and presented in the final TYNDP 2020 package.
The approach followed by the regional investment plans is summarised in Figure 2-3.
Market
Description of the Future Regional Regional
and
present situation regional capacity Project
Network
and scenarios challenges increases list
results
Figure 2-3: Mitigating future challenges - TYNDP methodology
The current document comprises seven chapters with detailed information at the regional level:
• Chapter 1 presents the key messages about the region
• Chapter 2 sets out, in detail, the general and legal basis of the TYNDP and regional investment plans,
and provides a short summary of the general methodology used by all ENTSO-E regions
• Chapter 3 covers a general description of the present situation in the region. The future challenges
of the region are also presented - while describing the evolution of generation and demand profiles
in the 2040 horizon - but considering a grid as expected by the 2025 horizon. This chapter also
includes links to the respective national development plans (NDPs) of the countries in the region
• Chapter 4 includes an overview of regional needs in terms of capacity increases and the main results
from the market and network perspectives
• Chapter 5 is dedicated to additional analyses conducted inside the regional group or by external
parties outside the core TYNDP process
• Chapter 6 contains the list of projects proposed by promoters in the region at the Pan-European
level, as well as important regional projects that are not part of the European TYNDP process
• The Appendix includes the abbreviations and terminology used in the whole report as well as
additional content and detailed results
ENTSO-E | Rue de Spa, 8 | 1000 Brussels | info@entsoe.eu | www.entsoe.eu | @entso_e Page 12 of 92REGIONAL INVESTMENT PLAN 2020 - CONTINENTAL CENTRAL EAST
The actual Regional Investment Plan does not include the CBA-based assessment of projects. These analyses
will be developed in a second step and presented in the final TYNDP 2020 package.
2.4 General methodology
The Regional Investment Plans build on the results of ‘Identification of System Needs’ studies, conducted by
a European team of market and network experts originating from the six regional groups of ENTSO-E’s System
Development Committee. The results of these studies have been discussed and, in some cases, extended with
additional regional studies by the regional groups to cover all relevant aspects in the regions.
The aim of the Identification of System Needs is to identify investment needs in the long-term time horizon
(2040) - triggered by market integration, RES integration, and security of supply and interconnection targets
- in a coordinated pan-European manner that also builds on the expertise of the grid planners of all TSOs.
A more detailed description of this methodology is available in the report ‘Completing the map - Power
system needs in 2030 and 2040’.
2.5 Introduction to the region
The Continental Central East Regional Group (RG CCE), under the scope of the ENTSO-E System Development
Committee is one of the six regional groups that have been set up for grid planning and system development
tasks.
Figure 2-4: ENTSO-E System Development Continental Central East region
The Regional Continental Central East Group comprises nine countries which are listed in Table 2.1 along with
the representatives of ten TSOs.
Table 2-1: ENTSO-E Regional Group Continental Central East membership
ENTSO-E | Rue de Spa, 8 | 1000 Brussels | info@entsoe.eu | www.entsoe.eu | @entso_e Page 13 of 92REGIONAL INVESTMENT PLAN 2020 - CONTINENTAL CENTRAL EAST
Country Company/TSO
Austria (AT) APG - Austrian Power Grid AG
Croatian Transmission System Operator Ltd
Croatia (HR)
(HOPS)
Czech Republic (CZ) ČEPS, a.s.
Germany (DE) 50Hertz Transmission GmbH
Germany (DE) TenneT TSO GmbH
Hungary (HU) MAVIR Ltd.
Poland (PL) PSE S.A.
Romania (RO) C. N. Transelectrica S. A.
Slovenská elektrizačná prenosová sústava, a.s.
Slovak Republic (SK)
(SEPS)
Slovenia (SI) ELES, d.o.o.
ENTSO-E | Rue de Spa, 8 | 1000 Brussels | info@entsoe.eu | www.entsoe.eu | @entso_e Page 14 of 92REGIONAL INVESTMENT PLAN 2020 - CONTINENTAL CENTRAL EAST
3. REGIONAL CONTEXT
3.1 Present situation
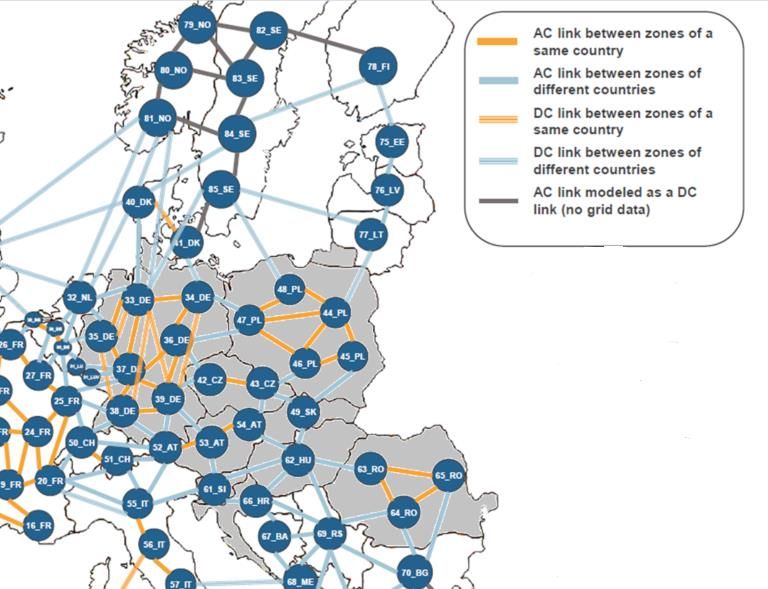
The RG CCE consists of the following countries: Austria, Croatia, Czech Republic, Germany, Hungary, Poland,
Romania, Slovakia and Slovenia and is characterised by an interconnected and highly meshed system where
all countries have at least four connections to adjacent TSOs (including DC connection). Figure 3-1 presents
an interconnected network of the CCE region - where only 50Hertz and Tennet TSOs are German members
in the CCE region. Some CCE region border countries are also members of other ENTSO-E regional groups.
Figure 3-1 Interconnected network of the CCE region1 (time horizon of the depicted grid is Q1/2019)
The majority of the TSOs control areas are inner AC systems, thus their systems and capacities are influenced
by unscheduled physical flows, which differ from planned market flows. These differences were noted recently
as changes in the power generation mix in the CCE region have already begun. RES are primarily being
developed in the northern part of the region - mainly offshore and onshore wind turbines in northern
Germany - and are replacing nuclear and thermal power plants. This is what is causing changes in generation
location, in comparison to previous locations and compared to the main power consumption centres. These
changes in the power generation mix are - in contrast to the relatively slow transmission infrastructure
1
Only 50Hertz and Tennet TSOs are German members in the CCE region
ENTSO-E | Rue de Spa, 8 | 1000 Brussels | info@entsoe.eu | www.entsoe.eu | @entso_e Page 15 of 92REGIONAL INVESTMENT PLAN 2020 - CONTINENTAL CENTRAL EAST
development - relatively rapid. The current grid would not be able to absorb the load-flow pattern changes,
which could lead to some very complicated operational cases in transmission system operation. A comparison
of the physical exchanges on the CCE cross-border profiles between 2010 and 2018 are depicted in Figure 3-
2. The main load-flow pattern in the CCE region is in the north-south direction as the northern part of the
region has an export energy balance while the southern part of the region has an import balance. The CCE
region’s cross-border north-south physical flows have increased significantly and have more than doubled
on the borders of Germany and the Czech Republic, Hungary and Romania, Austria and Hungary, Poland and
Slovakia and Slovakia and Ukraine. In the south-north direction, the cross-border physical flows have
decreased. These changes in cross-border physical flows are a result of the changing power generation mix
in the CCE region. The development of the grid should reflect these changes in order to maintain the security
of the transmission systems operation. Graphical representations of the cross-border exchanges in 2018 are
depicted in Figure 3-3. Cross-border physical energy flows
20.000 15.000 10.000 5.000 0
GWh 5.000 10.000 15.000 20.000 25.000
SK - UA_W
SK - HU
SK - CZ
SI - IT
SI - HR
SI - AT
RO - MD
RO - UA_W
RO - RS
RO - HU
RO - BG
PL - UA_W
PL - SK
PL - SE
PL - LT
PL - CZ
HU - UA_W
HU - RS
HR - RS
HR - HU
DE - SE
DE - PL
DE - NL
DE - LU
DE - FR
DE - DK
DE - CZ
DE - CH
DE - AT
AT - IT
AT - HU
AT - CZ
AT - CH
2010 Flow A ← B 2010 Flow A → B
2018 Flow A ← B 2018 Flow A → B
Figure 3.2: Physical cross-border physical energy flows in the CCE region in 2010 and 2018
ENTSO-E | Rue de Spa, 8 | 1000 Brussels | info@entsoe.eu | www.entsoe.eu | @entso_e Page 16 of 92REGIONAL INVESTMENT PLAN 2020 - CONTINENTAL CENTRAL EAST
Figure 3.3: Physical cross-border flows in the CCE region in 20182
The maximum net transfer capacities in 2018 are depicted in Figure 3-4 in order to observe the
interconnection levels of particular CCE countries. The data is derived from the ENTSO-E Transparency
platform: Forecasted transfer capacities - Day Ahead3. The Net Transfer Capacity (NTC) values marked with
an asterisk (*) present the synchronous profile of PL-(DE+CZ+SK) and (DE+CZ+SK)-PL.
Figure 3-4: Maximum net transfer capacities on the CCE cross-border profiles in 20184
The above-mentioned facts regarding the changes in the power generation mix that are already underway
are shown by Figures 3-5 and 3-6, which show a comparison of the installed net generation capacities [GW]
2
DE-DK-East isn’t shown separately. The respective physical flows are considered at the border DE-DK.
3
https://transparency.entsoe.eu/transmission-domain/ntcDay/show
4
DE-DK-East isn’t shown separately. The respective NTC values are considered at the border DE-DK.
ENTSO-E | Rue de Spa, 8 | 1000 Brussels | info@entsoe.eu | www.entsoe.eu | @entso_e Page 17 of 92REGIONAL INVESTMENT PLAN 2020 - CONTINENTAL CENTRAL EAST
and net generation [TWh] together with consumption [TWh] between 2010 and 2018. This illustrates the
changes in power generation mix in the CCE region over the past seven years.
Figure 3-5: Comparison of installed net generation and load capacities in the CCE region between 2010
and 2018
The total installed net generating capacity in the CCE region rose by approximately 23% between 2010 and
2018, but power generation itself rose by approximately 2.5%. This shows that the evolution of net generating
capacities is not in line with capacity usage, i.e. power generation in the CCE region. Regarding consumption,
the values in 2018 are almost the same as those in 2010, but consumption in GWh is approximately 4.3%
higher in 2018. This could be due to the installation of more efficient technologies in the industrial power
sector, but also in transport and services.
An important fact can be seen in Figure 3-6 - namely, that Germany’s net generating capacities, as well as its
generation and consumption share on the total CCE numbers is dominant and approximately 40% both for
2010 and 2018. Basically, in all CCE countries, there was an increase in net generating capacity from 2010 to
2018.
ENTSO-E | Rue de Spa, 8 | 1000 Brussels | info@entsoe.eu | www.entsoe.eu | @entso_e Page 18 of 92REGIONAL INVESTMENT PLAN 2020 - CONTINENTAL CENTRAL EAST
Figure 3-6: Comparison of the net generation and consumption in the CCE region between 2010 and
2018 [GWh]
The comparison of the evolution of the CCE countries’ annual energy balance from 2010 to 2018, based on
the import and export cross-border flow volumes, is depicted in Figure 3-7. The increase in imports and
exports between 2010 and 2018 can be seen in Germany, where exports increased, and imports decreased by
35%. Regarding the evolution of balances, they increased in Germany - by approximately 200% - and in
Romania - by approximately 72% - and decreased in other countries to a greater or lesser extent. These
figures show that the north-south flows increased from 2010 to 2018.
ENTSO-E | Rue de Spa, 8 | 1000 Brussels | info@entsoe.eu | www.entsoe.eu | @entso_e Page 19 of 92REGIONAL INVESTMENT PLAN 2020 - CONTINENTAL CENTRAL EAST
Figure 3-7: Comparison of the annual energy balances of the CCE countries between 2010 and 2018
Internal exchanges within the CCE region shown on Figure 3-8, increased
from approximately 70TWh to 83TWh between 2010 and 2018, an
increase of approximately 20%. External exchange of the CCE region with
neighbouring countries increased by approximately 20%. Regional
imports and exports increased slightly, both approximately by 20%. The
CCE region is an exporting region and the whole exchange process -
internal and external - increased by about 20% between 2010 and 2018.
These figures support the fact that the CCE is a region that has an overall
export balance that has increased from 2010, as net generating capacity
and net generation rose in comparison to a stagnating or slow increase in
consumption, when considering the import balance of the surrounding
regions. The increase in internal exchanges in the CCE region from 2010
to 2018 supports the fact that generated power is transmitted through
longer distances, as the location of the power generation moves further
from the main consumption locations.
RES generation development has affected grid development in the CCE
over the past five years and will continue to play a key role in the area of
Figure 3-8: Development of the
grid development for the future time horizons. In order to highlight the
RG CCE exchanges
increase in RES production in the CCE member states, the development
of total RES generation for each country over the last two years is depicted in Figure 3-9.
RES installed capacity in the CCE region has increased by approximately 77% from 2010 to 2018, while RES
installed capacity share on total installed capacity has increased from 35% in 2010 to 48% in 2018. Another
ENTSO-E | Rue de Spa, 8 | 1000 Brussels | info@entsoe.eu | www.entsoe.eu | @entso_e Page 20 of 92REGIONAL INVESTMENT PLAN 2020 - CONTINENTAL CENTRAL EAST
important fact is that Germany’s RES installed capacity in 2018 was approximately 115GW, which was more
than double the total RES installed capacity of all the other CCE countries put together - 50GW. However, RES
installed capacities have increased between 2010 and 2018 in all CCE countries, as well as RES installed
capacity share of total installed capacity.
Figure 3-9: Development of RES installed capacity share on total country net generation value between
2010 and 2018 in the CCE region
RES generation in the CCE region increased by approximately 135TWh between 2010 and 2018, of which a
117TWh increase can be seen in Germany alone.
Another important parameter is RES generation share of electricity consumption, as each of the EU member
countries have set binding goals that must be met by 2020 as well as for 2030. Figure 3-10 shows that RES
generation increased from 2010 to 2018 in all the CCE countries.
ENTSO-E | Rue de Spa, 8 | 1000 Brussels | info@entsoe.eu | www.entsoe.eu | @entso_e Page 21 of 92REGIONAL INVESTMENT PLAN 2020 - CONTINENTAL CENTRAL EAST
Figure 3-10: Development of RES production on total country generation and consumption between
2010 and 2018 in the CCE region
As described above, the generation mix had already changed between 2010 and 2018, causing an increase in
north-south flows in the CCE region. During some periods of real-time operation of the transmission system,
these changes caused difficult operational cases, which had to be solved by the particular TSOs. In order to
also maintain the secure operation of Europe’s IPSs in future time horizons, transmission infrastructure will
have to be developed accordingly. Therefore, Table 3-1 lists the important cross-border and internal
transmission projects in the CCE region that were commissioned between 2010 and 2018. These are improving
the operational security of the IPSs in Europe, especially in the CCE region.
ENTSO-E | Rue de Spa, 8 | 1000 Brussels | info@entsoe.eu | www.entsoe.eu | @entso_e Page 22 of 92REGIONAL INVESTMENT PLAN 2020 - CONTINENTAL CENTRAL EAST
Location Transmission system infrastructure project
DE-PL New PST transformers on the double 400kV OHL Mikulowa - Hagenwerder, final
border commissioned in December 2015.
Two x 220kV OHL Krajnik - Vierraden has been temporarily switched off in order to upgrade
it to 400kV and to allow the installation of two PST transformers on the new two x 4002kV
DE-PL OHL Krajnik - Vierraden system. The two PST were commissioned in August 2018. The 400kV
border OHL Krajnik - Vierraden is in operation with one system and two PST in series. A further two
PST will be commissioned after 2022 allowing the operation of both systems of the Krajnik -
Vierraden line.
A new double 400kV OHL Altenfeld - Redwitz system is being installed, with the first circuit
DE
commissioned in 2015 and the second in September 2017.
New PST transformers on the double 400kV OHL Hradec Východ - Röhrsdorf, on the ČEPS
CZ-DE side. The first pair were commissioned in December 2016 and the second pair in July 2017.
border Two PST were commissioned on 50Hertz side in Röhrsdorf substation in January 2018.
A new substation, Vernerov, which is part of PCI was commissioned in October 2017.
A new double 400kV OHL Veľký Ďur - Gabčíkovo system was commissioned at the end of
SK
2016.
In 2020, new SK-HU lines double 400kV OHL Gabčíkovo - Gönyű - Veľký Ďur will be
SK-HU
commissioned.
New Variable shunt reactor (VSR) with installed capacity 100MVAR in substation
HR
220/110/10kVMraclin commissioned in 2020.
New 220kV substation Krš-Pađene for connection of 142MW wind power plant interpolated
HR
in the existing transmission line 220kV Konjsko - Brinje commissioned in 2019.
Interpolation of 220kV TPP Sisak on the existing 220kV interconnection line Mraclin (HR) -
HR-BA
Prijedor (BA) commissioned in 2019.
The HU terminal of the 750kV line to Zakhidnoukrainska (UA) was moved to new substation
HU
Szabolcsbáka in 2019.
Table 3-1: Transmission system infrastructure projects with cross-border impact that were
commissioned until 2020
ENTSO-E | Rue de Spa, 8 | 1000 Brussels | info@entsoe.eu | www.entsoe.eu | @entso_e Page 23 of 92REGIONAL INVESTMENT PLAN 2020 - CONTINENTAL CENTRAL EAST 3.2 Description of the scenarios The way in which the scenario studies in this report were performed are presented in this chapter. First, the expected changes in the generation portfolio of the region are explained, before the pan-European TYNDP scenarios, as well as the regional scenarios used in the regional sensitivity analysis, are presented. The regional scenarios are created and used in the studies to highlight the regional specifics and study sensitivities that have regional significance. The TYNDP 2020 Scenario edition published in June 2020 represents the first step to quantify the long-term challenges of the energy transition on Europe’s electricity and gas infrastructure. The joint work of ENTSO-E and ENTSOG, stakeholders and over 80 TSOs - covering more than 35 countries - provided a basis to allow assessment for the European Commission’s Projects of Common Interest (PCI) list for energy, as ENTSO-E and ENTSOG progress to develop their respective TYNDPs. We strongly recommend the reader familiarises themselves with the content included in the Scenario Report and visualisation platform, as these will provide full transparency on the development and outcomes of the scenarios mentioned in this report. 3.2.1 Scenario Storylines The joint scenario building process presents three storylines for TYNDP 2020 National Trends (NT), the central policy scenario, based on Member States National Energy and Climate Plans (NECPs) and EU climate targets. NT is further compliant with the EU’s 2030 Climate and Energy Framework (32% renewables, 32.5% energy efficiency) and the EC 2050 Long-Term Strategy with an agreed climate target of 80 - 95% CO2-reduction compared to 1990 levels. Global Ambition (GA), a full energy scenario in line with the 1.5°C target of the Paris Agreement, envisions a future characterised by economic development in centralised generation. Hence, significant cost reductions in emerging technologies such as offshore wind and Power-to-X are led by economies of scale. Distributed Energy (DE), a full energy scenario also compliant with the 1.5°C Paris Agreement target, presents a decentralised approach to energy transition. In this case, prosumers actively participate in a society driven by small-scale decentralised solutions and circular approaches. Both Distributed Energy and Global Ambition reach carbon neutrality by 2050. ENTSO-E | Rue de Spa, 8 | 1000 Brussels | info@entsoe.eu | www.entsoe.eu | @entso_e Page 24 of 92
REGIONAL INVESTMENT PLAN 2020 - CONTINENTAL CENTRAL EAST

                         Figure 3-11: TYNDP 2020 scenarios for 2030 and 2040 and the three storylines

Bottom-Up: This approach to the scenario-building process collects supply and demand data from gas and
electricity TSOs.
Top-Down: The Top-Down Carbon Budget scenario-building process is an approach that uses the ‘bottom-
up’ model information gathered from the Gas and Electricity TSOs. The methodologies are developed in line
with a Carbon Budget approach.
Full energy scenario: a full energy scenario employs a holistic view of the European energy system, thus
capturing all fuel and sectors as well as a full picture of primary energy demand.

ENTSO-E | Rue de Spa, 8 | 1000 Brussels | info@entsoe.eu | www.entsoe.eu | @entso_e                     Page 25 of 92
REGIONAL INVESTMENT PLAN 2020 - CONTINENTAL CENTRAL EAST
Figure 3.12: Key drivers of scenario storylines
3.2.2 Selective description of electricity results
To comply with the 1.5°C targets of the Paris Agreement, carbon neutrality in the electricity sector
must be achieved by 2040 and by 2050 in all sectors.
Distributed Energy and Global Ambition, also referred to as ‘COP21 Scenarios’, are meant to assess sensible
pathways to reach the target set by the Paris Agreement for the COP 21: 1.5°C or at least well below 2°C by
the end of the century. For the purpose of the TYNDP scenarios, this target has been translated by ENTSO-E
and ENTSOG into a carbon budget to stay below +1.5° C at the end of the century with a 66.7% probability.
Figure 3-13: GHG Emissions in ENTSOs’ Scenarios
To optimise conversions, the direct use of electricity is an important option resulting in progressive
electrification throughout all scenarios
ENTSO-E | Rue de Spa, 8 | 1000 Brussels | info@entsoe.eu | www.entsoe.eu | @entso_e Page 26 of 92REGIONAL INVESTMENT PLAN 2020 - CONTINENTAL CENTRAL EAST
The scenarios show that higher direct electrification of final-use demand across all sectors results in an
increase in the need for electricity generation.
Distributed Energy is the scenario storyline with the highest annual electricity demand hitting around
4300TWh by 2050. The scenario results show that there is the potential for year on year growth for EU28
direct electricity demand. Figure 3-14 provides annual EU-28 electricity demand volumes and the associated
growth rate for the specified periods.
The growth rates for the storylines show that by 2040 National Trends is centrally positioned in terms of
growth between the two more-ambitious top-down scenarios, Distributed Energy and Global Ambition. The
main reason for the switch in growth rates is due to the fact that Global Ambition has the strongest levels of
energy efficiency, whereas for Distributed Energy, strong electricity demand growth is linked to high
electrification from the strong uptake of electric vehicles and heat pumps, dominating electrical energy
efficiency gains.
Figure 3-14: Direct Electricity Demand per Scenario (EU28)
In the COP21 Scenarios, the electricity mix becomes carbon neutral by 2040.
In the EU-28, electricity from renewable sources meets up to 64% of power demand in 2030 and 83% in 2040.
Variable renewables (wind and solar) play a key role in this transition, as their share in the electricity mix grows
to over 40% by 2030 and over 60% by 2040.
The remaining renewable capacity consists of biofuels and hydro. All figures stated above exclude power
dedicated for P2X use, which is assumed to be entirely from curtailed RE, and newly build renewables that are
not grid-connected, and therefore are not considered in this representation.
To move towards a low carbon energy system, significant investment in gas and electricity renewable
technologies is required.
Distributed Energy is the scenario with the highest investment in generation capacity, driven primarily by the
highest level of electrical demand. Distributed Energy primarily focuses on the development of Solar PV. This
technology has the lowest load factor and as a result, Solar PV installed capacity will be higher compared to
offshore or onshore wind, in meeting the same energy requirement. The scenario shows larger growth in
Onshore Wind after 2030. In 2030, 14% of electricity is produced from Solar and 30% from wind, 44% in total.
In 2040 18% of the electricity is generated from solar and 42% from wind 60% in total. The scenario also sees
ENTSO-E | Rue de Spa, 8 | 1000 Brussels | info@entsoe.eu | www.entsoe.eu | @entso_e Page 27 of 92REGIONAL INVESTMENT PLAN 2020 - CONTINENTAL CENTRAL EAST
the least amount of electricity produced from nuclear out of the three scenarios, providing 16% of electricity
in 2030 and 10% in 2040.
Figure 3-15: Percentage share of electricity demand covered by RES
Global Ambition has lower electricity demand, with a general trend of higher nuclear and reduced prices for
offshore wind. Consequently, the capacity required for this scenario is the lowest, as more energy is produced
per MW of installed capacity in offshore wind, and nuclear is used as base load technology providing 19% of
energy in 2030, reducing to 12% in 2040. In 2030, 10% of electricity is produced from Solar and 32% from
wind, 42% in total. In 2040 13% of the electricity is generated from solar and 45% from wind 58% in total.
National Trends is the policy-based scenario. The variable renewable generation is somewhere between the
two top-down scenarios. In 2030, 12% of electricity is produced from Solar and 30% from wind, 42% in total.
In 2040 14% of the electricity is generated from solar and 42% from wind 56% in total. A lot of electricity is
still produced from nuclear in 2030 17% reducing to 12% in 2040.
The share of coal for electricity generation decreases across all scenarios. This is due to national policies
on coal phase-out, such as those stated by the UK and Italy, or planned by Germany. Coal generation moves
from 10% in 2025, to 4 - 6% in 2030 and negligible amounts in 2040, representing an almost complete phase
out of coal.
Considerations on Other Non-Renewables (primarily smaller scale CHPs) sources are important for
decarbonisation. As it stands, carbon-based fuels are still widely used in CHP plants throughout Europe. This
includes oil, lignite, coal and gas. In order to follow the thermal phaseout storylines, oil, coal and lignite should
be phased out by 2040 and replaced with cleaner energy sources. Gas will contribute to decarbonisation by
increasing shares of renewable and decarbonised gas.
ENTSO-E | Rue de Spa, 8 | 1000 Brussels | info@entsoe.eu | www.entsoe.eu | @entso_e Page 28 of 92REGIONAL INVESTMENT PLAN 2020 - CONTINENTAL CENTRAL EAST
Figure 3-16: Electricity Capacity mix
Sector Coupling - an enabler for (full) decarbonisation.
For ENTSO-E and ENTSOG, sector coupling describes interlinkages between gas and electricity production
and infrastructure. Major processes in this regard are gas-fired power generation, Power-to-Gas (P2G) and
hybrid demand technologies. TYNDP 2020 scenarios are dependent on the further development of sector
coupling, without these interlinkages high, or even full, decarbonisation in the energy sector will not be
reached.
Assuming a switch from carbon-intensive coal to natural gas in 2025, 150MtCO2 could be avoided in power
generation. With increasing shares of renewable and decarbonised gases, gas-fired power plants become the
main ‘back-up’ for variable RES in the long-term. Distributed Energy even shows a further need for Carbon
Capture and Storage (CCS) for gas power plants, to reach its ambitious target of full decarbonisation in power
generation by 2040.
On the other hand, P2G becomes an enabler for the integration of variable RES and an option to decarbonise
the gas supply. Hydrogen and synthetic methane allow for carbon-neutral energy use in the final sectors.
Distributed Energy is the scenario with the highest need for P2G, requiring about 1500TWh of power
generation per year, with 493GW of capacities for wind and solar in 2040 to produce renewable gas. Sector
coupling in National Trends, with the assumption that P2G generation is limited to ‘curtailed electricity’,
considers 12TWh of power generation with 22GW of P2G to produce renewable gas.
ENTSO-E | Rue de Spa, 8 | 1000 Brussels | info@entsoe.eu | www.entsoe.eu | @entso_e Page 29 of 92REGIONAL INVESTMENT PLAN 2020 - CONTINENTAL CENTRAL EAST
Figure 3-17: Capacities for hydrogen production
Figure 3-18: Power to Gas generation mix
3.2.2 Key findings of the scenarios for the CCE region.
The main changes and drivers in the regional generation mix are explained in this chapter as a basis for the
regional scenarios. The challenges expected due to these changes are then elaborated on in Chapter 3.3.
The main drivers of changes in the CCE region relate to climate policy, which stimulates the development of
more RES (wind, PV and others) and a common European framework for the operation and planning of the
electricity market. The main structural changes in the CCE region power system in the future relate to the
following points:
• Strong increase in RES generation:
o The increased share of wind power - on- and offshore - and solar PV in the power system is
shown in all scenarios
o Additional wind power generation, is located farther away from the load centres with large
amounts is planned for construction primarily in the northern part of the region
o PV capacity will be primarily increased in the middle and southern part of the region
• Reduction of thermal power capacity:
ENTSO-E | Rue de Spa, 8 | 1000 Brussels | info@entsoe.eu | www.entsoe.eu | @entso_e Page 30 of 92REGIONAL INVESTMENT PLAN 2020 - CONTINENTAL CENTRAL EAST
o Decommissioning of old lignite, hard coal and oil -fired power plants
o Full decommissioning of all nuclear power plants in Germany by 2023 by law
o New large wind power generating units are planned near by the Nordic part of the CCE region
(Nordic and Baltic Sea)
o Slight increase of storage technologies (hydro-pump storages, battery) in all scenarios to
integrate the flexible RES power generation
o Remarkable increase of capacities for hydrogen production, primarily in the scenarios DE
2030/2040 and GA 2040
o Visible increase of capacities for Power to gas generation, also primarily in the scenarios DE
2030/2040 and GA 2040
ENTSO-E | Rue de Spa, 8 | 1000 Brussels | info@entsoe.eu | www.entsoe.eu | @entso_e Page 31 of 92You can also read