IFRS CONSOLIDATED INTERIM CONDENSED FINANCIAL INFORMATION (UNAUDITED) - PJSC GAZPROM
←
→
Page content transcription
If your browser does not render page correctly, please read the page content below
PJSC GAZPROM

IFRS CONSOLIDATED INTERIM
CONDENSED FINANCIAL
INFORMATION (UNAUDITED)

30 June 2021
Moscow | 2021
Contents
Report on Review of Consolidated Interim Condensed Financial Information ....................................................... 3
Consolidated Interim Condensed Balance Sheet ...................................................................................................... 5
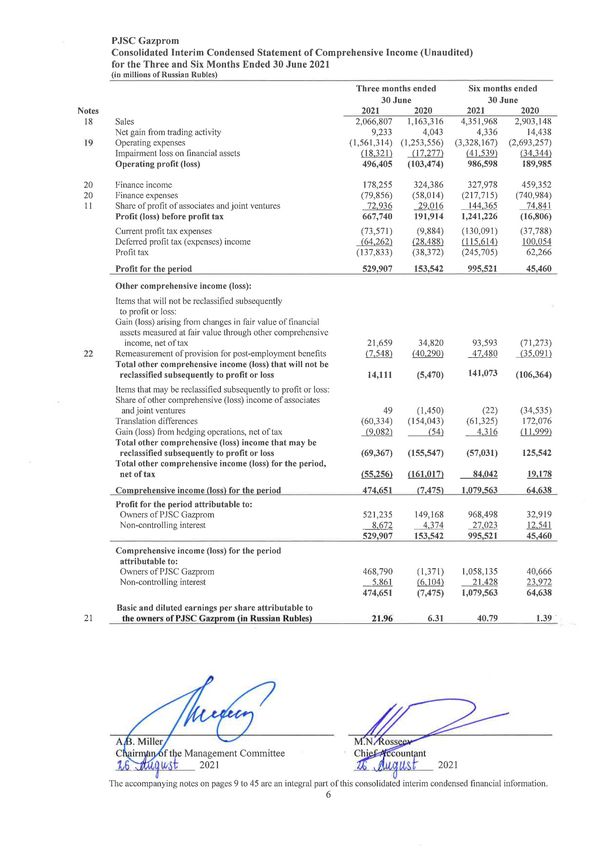
Consolidated Interim Condensed Statement of Comprehensive Income ................................................................. 6
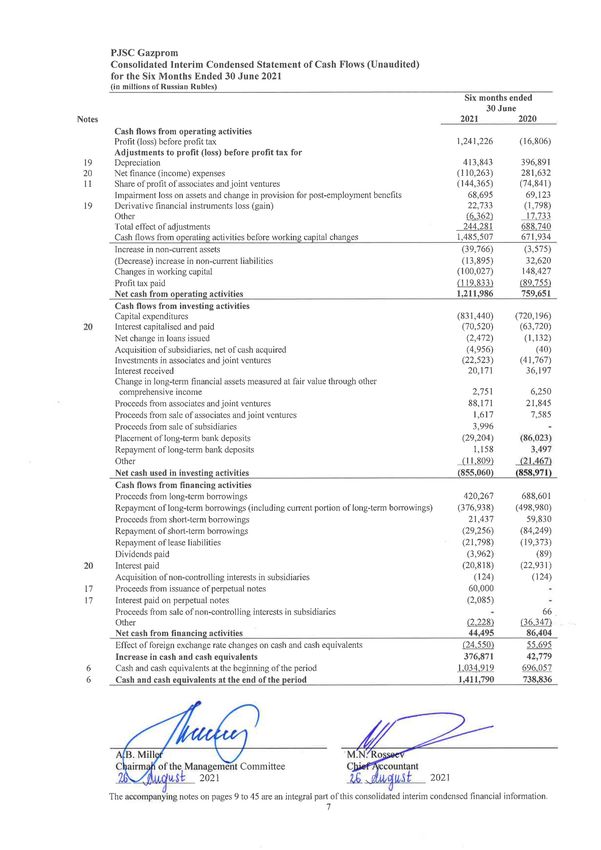
Consolidated Interim Condensed Statement of Cash Flows ..................................................................................... 7
Consolidated Interim Condensed Statement of Changes in Equity .......................................................................... 8
Notes to the consolidated interim condensed financial information:
1 General Information.................................................................................................................................. 9
2 Economic Environment in the Russian Federation.................................................................................. 9
3 Basis of Presentation............................................................................................................................... 10
4 Summary of Significant Accounting Policies and Critical Judgements and Estimates in Their
Application ............................................................................................................................................ 10
5 Segment Information .............................................................................................................................. 12
6 Cash and Cash Equivalents .................................................................................................................... 16
7 Accounts Receivable and Prepayments ................................................................................................. 16
8 Inventories............................................................................................................................................... 17
9 Property, Plant and Equipment ............................................................................................................... 17
10 Right-of-Use Assets ................................................................................................................................ 19
11 Investments in Associates and Joint Ventures ....................................................................................... 20
12 Long-Term Accounts Receivable and Prepayments .............................................................................. 22
13 Other Current and Non-Current Assets .................................................................................................. 22
14 Long-Term Borrowings, Promissory Notes ........................................................................................... 23
15 Profit Tax ................................................................................................................................................ 26
16 Equity ...................................................................................................................................................... 27
17 Perpetual Notes ....................................................................................................................................... 27
18 Sales ........................................................................................................................................................ 29
19 Operating Expenses ................................................................................................................................ 30
20 Finance Income and Expenses ............................................................................................................... 30
21 Basic and Diluted Earnings per Share Attributable to the Owners of PJSC Gazprom ......................... 31
22 Provisions ................................................................................................................................................ 31
23 Fair Value of Financial Instruments ....................................................................................................... 32
24 Related Parties ........................................................................................................................................ 34
25 Сommitments and Contingencies........................................................................................................... 40
26 Events After the Reporting Period ......................................................................................................... 45
2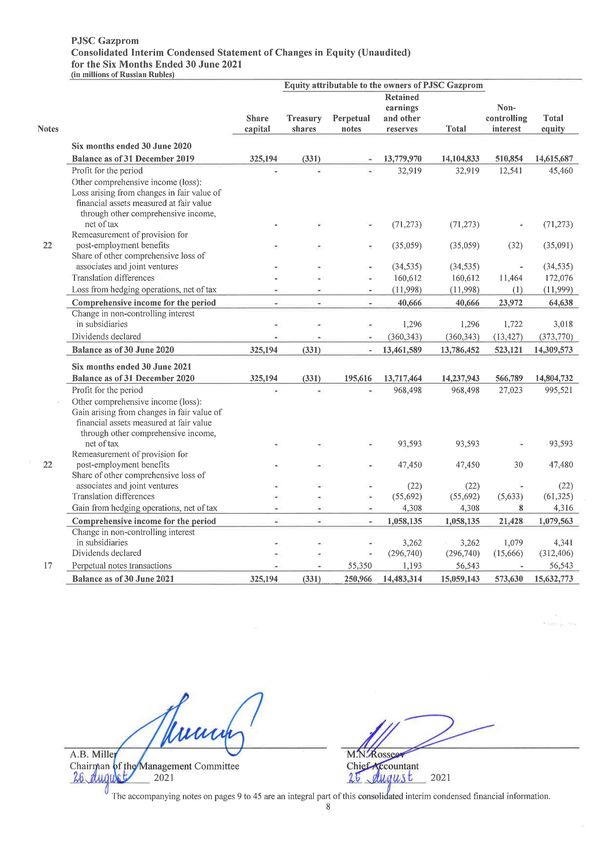
Report on Review of Consolidated
Interim Condensed Financial
Information
                                                                          To the Shareholders
                                                      of Public Joint Stock Company Gazprom

Introduction
We have reviewed the accompanying consolidated interim condensed balance sheet
of Public Joint Stock Company Gazprom (“PJSC Gazprom”) and its subsidiaries as of
30 June 2021 and the related consolidated interim condensed statement of comprehensive
income for the three and six months ended 30 June 2021, consolidated interim condensed
statements of cash flows and changes in equity for the six months ended 30 June 2021, and
notes to the consolidated interim condensed financial information.

Management is responsible for the preparation and presentation of this consolidated interim
condensed financial information in accordance with International Accounting Standard 34,
Interim Financial Reporting. Our responsibility is to express a conclusion on this consolidated
interim condensed financial information based on our review.

Scope of Review
We conducted our review in accordance with International Standard on Review
Engagements 2410, Review of Interim Financial Information Performed by the Independent
Auditor of the Entity. A review of interim financial information consists of making inquiries,
primarily of persons responsible for financial and accounting matters, and applying analytical
and other review procedures. A review is substantially less in scope than an audit conducted in
accordance with International Standards on Auditing and consequently does not enable us to
obtain assurance that we would become aware of all significant matters that might be identified
in an audit. Accordingly, we do not express an audit opinion.

                                              3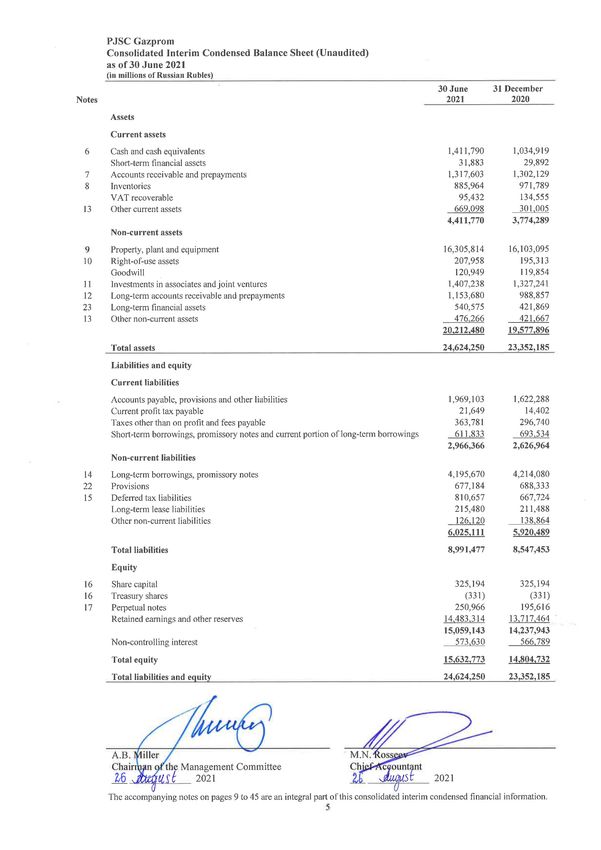

PJSC Gazprom
Notes to the Consolidated Interim Condensed Financial Information
(Unaudited)
30 June 2021
(in millions of Russian Rubles)
Notes to the consolidated interim co nde nsed fina ncial infor matio n:
1 General Information
Public Joint Stock Company Gazprom (PJSC Gazprom) and its subsidiaries (the “Group” or “Gazprom
Group”) operate one of the largest gas pipeline systems in the world, and provide for the major part of natural
gas production and its transportation by high-pressure pipelines in the Russian Federation. The Group is also a
major natural gas supplier to European countries. The Group is engaged in oil production, oil refining, electric
and heat energy generation. The Russian Federation is the ultimate controlling party and has a controlling
interest (including both direct and indirect ownership) of over 50 % in PJSC Gazprom.
The Group is involved in the following activities:
exploration and production of gas;
transportation of gas;
sales of gas within the Russian Federation and abroad;
gas storage;
production of crude oil and gas condensate;
processing of oil, gas condensate and other hydrocarbons and sales of refined products;
electric and heat energy generation and sales.
Other activities include production of other goods, execution of other works and provision of other services.
The Group’s activity is subject to seasonal fluctuations with peak demand for gas in the first and fourth quarters
of each year. Typically approximately 30 % of total annual gas volumes are shipped in the first calendar quarter
and approximately 20 % in the second calendar quarter.
2 Economic Environment in the Russian Federation
The economy of the Russian Federation displays certain characteristics of an emerging market. Tax, currency
and customs legislation of the Russian Federation is subject to varying interpretations and causes additional
challenges for companies operating in the Russian Federation.
The political and economic instability, the current situation with sanctions, uncertainty and volatility of
financial and trade markets and other risks have had and may continue to have effects on the Russian economy.
The spread of COVID-19, which occurred in 2020, has had a material adverse effect on the world economy.
Measures taken to combat the spread of the virus have caused material economic downturn. Global oil and gas
markets are experiencing high volatility of demand and prices.
The duration and consequences of the COVID-19 pandemic, as well as the efficiency of the measures taken
are currently unclear. It is now impossible to assess reliably the duration and effect of the consequences of the
pandemic on the Group's financial position and results of operations in future reporting periods.
The official Russian Ruble (“RUB”) to US Dollar (“USD”) exchange rate as determined by the Central Bank
of the Russian Federation was as follows:
as of 30 June 2021 – 72.3723 (as of 30 June 2020 – 69.9513);
as of 31 December 2020 – 73.8757 (as of 31 December 2019 – 61.9057).
The official RUB to Euro (“EUR”) exchange rate as determined by the Central Bank of the Russian Federation
was as follows:
as of 30 June 2021 – 86.2026 (as of 30 June 2020 – 78.6812);
as of 31 December 2020 – 90.6824 (as of 31 December 2019 – 69.3406).
The future economic development of the Russian Federation is dependent upon external factors and internal
measures undertaken by the Government of the Russian Federation to sustain growth and to change the tax,
legal and regulatory frameworks. The management believes it is taking all necessary measures to support the
sustainability and development of the Group’s business in the current business and economic environment. The
future economic situation and the regulatory environment and their impact on the Group’s operations may
differ from management’s current expectations.
9PJSC Gazprom
Notes to the Consolidated Interim Condensed Financial Information
(Unaudited)
30 June 2021
(in millions of Russian Rubles)
3 Basis of Presentation
This consolidated interim condensed financial information is prepared in accordance with the requirements of
IAS 34 Interim Financial Reporting. The consolidated interim condensed financial information should be read
in conjunction with the consolidated financial statements for the year ended 31 December 2020 prepared in
accordance with International Financial Reporting Standards (“IFRS”).
4 Summary of Significant Accounting Policies and Critical Judgements and Estimates in Their
Application
The significant accounting policies followed by the Group and the critical judgements and estimates in their
application are consistent with those disclosed in the consolidated financial statements for the year ended
31 December 2020 except for the Perpetual notes update as below.
Perpetual Notes
Russian Ruble perpetual callable notes and foreign currency perpetual callable loan participation notes issued
by the Group are reported as an equity instrument within equity provided that the notes have no stated maturity
and the Group, acting in its sole discretion, may, at any time and on any number of occasions, decide to
postpone interest payments or decide to refuse to pay interest. The par value of foreign currency perpetual notes
is recognised in the consolidated statement of changes in equity at the official exchange rate as at the date of
initial recognition.
The issuer may decide to postpone interest payments on the foreign currency perpetual callable loan
participation notes. To reflect the best estimate of the rights of perpetual notes holders and a potential cash
outflow, the Group accrues interest in the consolidated statement of changes in equity by decreasing the
retained earnings item and increasing the perpetual notes item at the interest rate effective for the current
interest period until an interest payment liability arises. Interest on foreign currency perpetual callable loan
participation notes is accrued in the consolidated statement of changes in equity at the official exchange rate
as at the date of initial recognition. A liability to pay interest on foreign currency perpetual callable loan
participation notes is recognised in the consolidated balance sheet at the official exchange rate as at the date
when an interest payment obligation arises.
To reflect the best estimate of the rights of foreign currency perpetual callable loan participation notes holders
and a potential cash outflow, the par value of foreign currency perpetual notes and interest recognised in equity
are translated into Russian Rubles as at the reporting date and as at the date of their transfer to liabilities at the
official exchange rate. Gain or loss from translating the par value of foreign currency perpetual notes and
interest into Russian Rubles is reported within perpetual notes and retained earnings in the consolidated
statement of changes in equity.
The issuer may decide to refuse to pay interest on the Russian Ruble perpetual callable notes. The Group
accrues interest in the consolidated statement of changes in equity by decreasing the retained earnings item as
at the date when an interest payment obligation arises.
Costs associated with the issuance of perpetual notes and the tax effect of transactions related to perpetual notes
and recognised in equity (except for the tax effect of transactions related to interest) are reported within retained
earnings in the consolidated statement of changes in equity. The tax effect of interest accrual is reported within
profit or loss in the consolidated statement of comprehensive income, as defined by IAS 12 Income Taxes.
Profit Tax
Profit tax for the interim periods is accrued using a tax rate that would be applicable to expected profit for the
year.
Application of Amendments to Standards
The amendments to IFRS 9 Financial Instruments, IAS 39 Financial Instruments: Recognition and
Measurement, IFRS 7 Financial Instruments: Disclosures and IFRS 16 Leases – Interest Rate Benchmark
Reform – Phase 2 (issued in August 2020 and effective for annual reporting periods beginning on or
after 1 January 2021). The amendments provide temporary reliefs, which address the financial reporting
effects when an interbank offered rate (IBOR) is replaced with an alternative nearly risk-free interest
rate. The amendments include the following:
a practical expedient to require contractual changes, or changes to cash flows that are directly
required by the reform, to be treated as changes to a floating interest rate, equivalent to a
movement in a market rate of interest;
10PJSC Gazprom
Notes to the Consolidated Interim Condensed Financial Information
(Unaudited)
30 June 2021
(in millions of Russian Rubles)
4 Summary of Significant Accounting Policies and Critical Judgements and Estimates in Their
Application (continued)
permit changes required by IBOR reform to be made to hedge designations and hedge
documentation without the hedging relationship being discontinued;
provide temporary relief to entities from having to meet the separately identifiable requirement
when a risk-free interest rate instrument is designated at the discretion of the entity as a risk
component within the hedging relationship.
The amendments to IFRS 16 Leases (issued in March 2021 and effective for annual reporting periods
beginning on or after 1 April 2021). The amendments extend the previously effective COVID-19 related
rent concessions, which were issued in May 2020 and were effective for annual reporting periods
beginning on or after 1 June 2020, and permit lessees, as a practical expedient, not to assess whether
particular rent concessions occurring as a direct consequence of the COVID-19 pandemic are lease
modifications and instead to account for those rent concessions as if they are not lease modifications.
The amendments do not affect lessors.
The Group reviewed these amendments to standards while preparing the consolidated interim condensed
financial information. The amendments to standards have no significant impact on the Group’s consolidated
interim condensed financial information.
Amendments to Existing Standards That Are Not Yet Effective and Have Not Been Early Adopted by the Group
Certain amendments to standards are mandatory for the annual periods beginning on or after 1 January 2022.
In particular, the Group has not early adopted the following amendments to standards:
The amendments to IAS 1 Presentation of Financial Statements (issued in January 2020 and effective
for annual reporting periods beginning on or after 1 January 2023). The amendments clarify the criteria
for classifying obligations as short-term or long-term.
The amendments to IFRS 9 Financial Instruments (issued in May 2020 and effective for annual reporting
periods beginning on or after 1 January 2022). The amendments clarify which fees should be included
when assessing whether the terms of a new or modified financial liability are substantially different from
the terms of the original financial liability.
The amendments to IAS 37 Provisions, Contingent Liabilities and Contingent Assets (issued in
May 2020 and effective for annual reporting periods beginning on or after 1 January 2022).
The amendments specify which costs are included in determining the cost of fulfilling a contract for
assessing whether the contract is onerous.
The amendments to IAS 16 Property, Plant and Equipment (issued in May 2020 and effective for annual
reporting periods beginning on or after 1 January 2022). The amendments prohibit deducting from the
cost of property, plant and equipment amounts received from selling items produced while the asset is
preparing for its intended use. Instead, such sales proceeds and related cost are recognised in profit or
loss.
The amendments to IAS 1 Presentation of Financial Statements (issued in February 2021 and effective
for annual reporting periods beginning on or after 1 January 2023). The amendments clarify how the
concept of materiality could be applied in making decisions about the disclosure of accounting policies.
The amendments to IAS 8 Accounting Policies, Changes in Accounting Estimates and Errors (issued in
February 2021 and effective for annual reporting periods beginning on or after 1 January 2023). The
amendments clarify how distinguish changes in accounting estimates from changes in accounting
policies.
The amendments to IAS 12 Income Taxes (issued in May 2021 and effective for annual reporting periods
beginning on or after 1 January 2023). The amendments clarify that the recognition exemption does not
apply to transactions in which equal deductible and taxable temporary differences arise on initial
recognition.
The Group is currently assessing the impact of these amendments on its financial position and performance.
11PJSC Gazprom
Notes to the Consolidated Interim Condensed Financial Information
(Unaudited)
30 June 2021
(in millions of Russian Rubles)
5 Segment Information
The Group operates as a vertically integrated business with substantially all external gas sales generated by the
Distribution of gas segment.
The Board of Directors, the Chairman of the Management Committee and the Management Committee of
PJSC Gazprom (the “Governing bodies”) make key decisions managing the Group’s activity, assess operating
results and allocate resources using different internal financial information.
Based on that information the following reportable segments were determined:
Production of gas – exploration and production of gas;
Transportation of gas – transportation of gas within the Russian Federation and abroad;
Distribution of gas – sales of gas within the Russian Federation and abroad;
Gas storage – storage of extracted and purchased gas in underground gas storages;
Production of crude oil and gas condensate – exploration and production of crude oil and gas
condensate, sales of crude oil and gas condensate;
Refining – processing of crude oil, gas condensate and other hydrocarbons, and sales of refined
products;
Electric and heat energy generation and sales.
Other activities’ results have been included within All other segments.
The inter-segment sales mainly consist of the following operations:
Production of gas – sales of gas to the Distribution of gas and Refining segments;
Transportation of gas – rendering gas transportation services to the Distribution of gas segment;
Distribution of gas – sales of gas to the Transportation of gas segment for operating needs and to the
Electric and heat energy generation and sales segment;
Gas storage – provision of gas storage services to the Distribution of gas segment;
Production of crude oil and gas condensate – sales of crude oil and gas condensate to the Refining
segment for further processing;
Refining – sales of refined hydrocarbon products to other segments.
Internal transfer prices, mostly for Production of gas, Transportation of gas and Gas storage segments, are
established by the management of the Group with the objective to meet funding requirements of particular
subsidiaries within a segment.
The Governing bodies of the Group assess the performance, assets and liabilities of the reportable segments on
the basis of the internal financial information. The effects of certain significant transactions and events, such
as business acquisitions, and the effects of some adjustments that may be considered necessary to reconcile the
internal financial information of the Group to the corresponding data presented in the consolidated interim
condensed financial information are reviewed by the Governing bodies on a central basis and not allocated to
the reportable segments. Finance income and expenses are not allocated to the reportable segments.
12PJSC Gazprom
Notes to the Consolidated Interim Condensed Financial Information
(Unaudited)
30 June 2021
(in millions of Russian Rubles)
5 Segment Information (continued)
Production Electric and
Transpor- of crude oil heat energy
Production tation of Distribution Gas and gas generation All other
of gas gas of gas storage condensate Refining and sales segments Total
Three months ended
30 June 2021
Sales of segments 259,748 326,848 1,029,883 15,609 442,582 648,088 111,680 69,154 2,903,592
Inter-segment sales 251,731 271,849 57,929 14,295 231,528 5,002 - - 832,334
External sales 8,017 54,999 971,954 1,314 211,054 643,086 111,680 69,154 2,071,258
Financial result of
segments 1,789 60,792 211,896 1,606 131,199 50,954 7,387 10,195 475,818
Depreciation 51,650 116,669 5,657 7,093 40,560 21,365 16,950 12,456 272,400
Share of profit
of associates
and joint ventures 2,288 9,197 625 - 42,278 2,824 55 15,669 72,936
Three months ended
30 June 2020
Sales of segments 180,468 319,484 558,604 15,268 194,517 353,301 94,157 63,686 1,779,485
Inter-segment sales 174,625 266,281 43,464 13,984 103,328 5,407 - - 607,089
External sales 5,843 53,203 515,140 1,284 91,189 347,894 94,157 63,686 1,172,396
Financial result of
segments (23,989) 68,720 (40,138) 2,166 27,928 (71,949) 5,769 (7,434) (38,927)
Depreciation 44,069 123,790 4,500 7,642 40,152 16,425 15,827 13,140 265,545
Share of profit
of associates
and joint ventures 443 7,989 1,448 - 7,522 513 87 11,014 29,016
Production Electric and
Transpor- of crude oil heat energy
Production tation of Distribution Gas and gas generation All other
of gas gas of gas storage condensate Refining and sales segments Total
Six months ended
30 June 2021
Sales of segments 480,895 620,977 2,376,298 29,600 847,182 1,202,894 299,185 140,402 5,997,433
Inter-segment sales 466,250 508,804 170,386 26,821 454,124 10,129 - - 1,636,514
External sales 14,645 112,173 2,205,912 2,779 393,058 1,192,765 299,185 140,402 4,360,919
Financial result of
segments (17,380) 87,033 433,880 2,612 255,528 57,290 44,553 46,729 910,245
Depreciation 103,730 234,656 11,033 14,206 84,083 39,448 33,764 24,074 544,994
Share of profit
of associates
and joint ventures 4,355 19,880 1,773 - 79,182 4,318 80 34,777 144,365
Six months ended
30 June 2020
Sales of segments 409,368 600,939 1,506,946 28,542 474,332 831,248 252,240 132,406 4,236,021
Inter-segment sales 397,943 491,649 131,782 26,124 262,282 10,395 - - 1,320,175
External sales 11,425 109,290 1,375,164 2,418 212,050 820,853 252,240 132,406 2,915,846
Financial result of
segments (19,088) 88,187 (149,767) 3,783 96,730 (83,516) 38,380 (50,777) (76,068)
Depreciation 88,367 250,111 9,057 15,299 85,047 29,653 31,556 24,517 533,607
Share of profit
of associates
and joint ventures 1,517 15,737 649 - 35,409 330 101 21,098 74,841
Sales of Production of gas and Distribution of gas segments compose gas sales, sales of Gas storage segment
are included in other sales.
13PJSC Gazprom
Notes to the Consolidated Interim Condensed Financial Information
(Unaudited)
30 June 2021
(in millions of Russian Rubles)
5 Segment Information (continued)
The reconciliation of reportable segments’ financial results to profit (loss) before profit tax in the consolidated
interim condensed statement of comprehensive income is provided below.
Three months Six months
ended 30 June ended 30 June
Notes 2021 2020 2021 2020
Financial result of reportable segments 465,623 (31,493) 863,516 (25,291)
Financial result of other segments 10,195 (7,434) 46,729 (50,777)
Total financial result of segments 475,818 (38,927) 910,245 (76,068)
Difference in depreciation1 66,227 68,218 131,151 136,716
Expenses for provision for post-
employment benefits (5,279) (5,464) (13,028) (5,453)
20 Net finance income (expense) 98,399 266,372 110,263 (281,632)
11 Share of profit of associates and joint ventures 72,936 29,016 144,365 74,841
19 Derivatives (loss) gain (23,444) 1,344 (22,733) 1,798
Other (16,917) (128,645) (19,037) 132,992
Total profit (loss) before profit tax in the
consolidated interim condensed statement of
comprehensive income 667,740 191,914 1,241,226 (16,806)
1
The difference in depreciation mainly relates to adjustments of property, plant and equipment under Russian statutory accounting to
comply with IFRS, such as reversal of revaluation of property, plant and equipment recorded under Russian statutory accounting or
adjustments related to operating of the Group in hyperinflation, which are not recorded in accounting reports under Russian statutory
accounting.
The reconciliation of reportable segments’ external sales to sales in the consolidated interim condensed
statement of comprehensive income is provided below.
Three months Six months
ended 30 June ended 30 June
2021 2020 2021 2020
External sales of reportable segments 2,002,104 1,108,710 4,220,517 2,783,440
External sales of other segments 69,154 63,686 140,402 132,406
Total external sales of segments 2,071,258 1,172,396 4,360,919 2,915,846
Differences in external sales1 (4,451) (9,080) (8,951) (12,698)
Total sales in the consolidated interim condensed
statement of comprehensive income 2,066,807 1,163,316 4,351,968 2,903,148
1
The differences in external sales relate to adjustments of external sales under Russian statutory accounting to comply with IFRS, such as
elimination of sales of materials to contractors and other adjustments.
Segment assets consist primarily of property, plant and equipment, accounts receivable and prepayments,
investments in associates and joint ventures and inventories. Cash and cash equivalents, VAT recoverable,
goodwill, financial assets and other current and non-current assets are not allocated to the segments and
managed on a central basis.
The Group's assets are primarily located in the Russian Federation. Information on non-current assets by
geographic regions is not disclosed due to the fact that the carrying value of non-current assets located outside
the Russian Federation is insignificant.
Production Electric and
Transpor- of crude oil heat energy
Production tation of Distribution Gas and gas generation All other
of gas gas of gas storage condensate Refining and sales segments Total
As of 30 June 2021
Assets of segments 2,929,462 7,305,244 1,691,747 351,420 3,471,869 3,107,687 1,105,756 1,807,040 21,770,225
Investments in associates
and joint ventures 19,210 232,581 41,894 2 605,657 27,473 1,457 478,964 1,407,238
Capital expenditures1 114,217 167,166 13,446 4,274 140,813 141,915 38,182 39,592 659,605
As of 31 December 2020
Assets of segments 2,992,642 7,233,415 1,848,312 355,297 3,267,110 2,823,335 892,261 1,960,300 21,372,672
Investments in associates
and joint ventures 15,628 230,553 42,274 2 602,659 32,008 1,328 402,789 1,327,241
Capital expenditures2 352,986 251,591 17,873 26,391 309,793 396,637 82,229 56,685 1,494,185
1
Capital expenditures for the six months ended 30 June 2021.
2
Capital expenditures for the year ended 31 December 2020.
14PJSC Gazprom
Notes to the Consolidated Interim Condensed Financial Information
(Unaudited)
30 June 2021
(in millions of Russian Rubles)
5 Segment Information (continued)
The reconciliation of reportable segments’ assets to total assets in the consolidated interim condensed balance
sheet is provided below.
30 June 31 December
Notes 2021 2020
Assets of reportable segments 19,963,185 19,412,372
Assets of other segments 1,807,040 1,960,300
Total assets of segments 21,770,225 21,372,672
Difference in property, plant and equipment, net1 (829,956) (996,982)
Borrowing costs capitalised 1,072,533 1,021,764
6 Cash and cash equivalents 1,411,790 1,034,919
Short-term financial assets 31,883 29,892
VAT recoverable 95,432 134,555
13 Other current assets 669,098 301,005
Right-of-use assets 64,479 63,311
Goodwill 120,949 119,854
23 Long-term financial assets 540,575 421,869
13 Other non-current assets 476,266 421,667
Inter-segment assets (1,060,098) (948,190)
Other 261,074 375,849
Total assets in the consolidated interim condensed balance sheet 24,624,250 23,352,185
1
The difference in property, plant and equipment relates to adjustments of property, plant and equipment under Russian statutory accounting
to comply with IFRS, such as reversal of revaluation of property, plant and equipment recorded under Russian statutory accounting or
adjustments related to operating of the Group in hyperinflation, which are not recorded in accounting reports under Russian statutory
accounting.
Liabilities of segments mainly comprise accounts payable arising in the course of operating activities. Current
profit tax payable, deferred tax liabilities, long-term provisions (except for provision for decommissioning and
site restoration), long-term and short-term borrowings, including current portion of long-term borrowings, long-
term and short-term promissory notes payable and other non-current liabilities are not allocated to the reportable
segments and managed on a central basis.
30 June 31 December
2021 2020
Refining 879,177 754,088
Distribution of gas 855,757 791,817
Production of crude oil and gas condensate 490,848 441,058
Production of gas 318,840 334,499
Transportation of gas 169,380 256,853
Electric and heat energy generation and sales 119,731 124,102
Gas storage 31,442 34,093
All other segments 318,431 353,228
Total liabilities of segments 3,183,606 3,089,738
15PJSC Gazprom
Notes to the Consolidated Interim Condensed Financial Information
(Unaudited)
30 June 2021
(in millions of Russian Rubles)
5 Segment Information (continued)
The reconciliation of reportable segments’ liabilities to total liabilities in the consolidated interim condensed
balance sheet is provided below.
30 June 31 December
Notes 2021 2020
Liabilities of reportable segments 2,865,175 2,736,510
Liabilities of other segments 318,431 353,228
Total liabilities of segments 3,183,606 3,089,738
Short-term lease liabilities 21,203 17,567
Current profit tax payable 21,649 14,402
Short-term borrowings, promissory notes and current portion of long-term borrowings 611,833 693,534
14 Long-term borrowings, promissory notes 4,195,670 4,214,080
22 Long-term provisions (except for provision for decommissioning and site restoration) 333,229 348,140
15 Deferred tax liabilities 810,657 667,724
Long-term lease liabilities 48,179 48,647
Other non-current liabilities 126,120 138,864
Dividends 314,487 5,625
Inter-segment liabilities (1,060,098) (948,190)
Other 384,942 257,322
Total liabilities in the consolidated interim condensed balance sheet 8,991,477 8,547,453
6 Cash and Cash Equivalents
Cash and cash equivalents include cash on hand, balances with banks, term deposits with the original maturity
of three months or less and other cash equivalents.
30 June 31 December
2021 2020
Cash on hand and bank balances payable on demand 1,148,195 735,334
Term deposits with original maturity of three months or less and other cash
equivalents 263,595 299,585
Total cash and cash equivalents 1,411,790 1,034,919
7 Accounts Receivable and Prepayments
30 June 31 December
2021 2020
Financial assets
Trade accounts receivable 844,354 871,814
Other accounts receivable 164,636 192,159
Loans receivable 174,389 158,543
1,183,379 1,222,516
Non-financial assets
Advances paid and prepayments 134,224 79,613
Total accounts receivable and prepayments 1,317,603 1,302,129
Accounts receivable are presented net of allowance for expected credit losses in the amount of
RUB 1,060,199 million and RUB 1,032,705 million, advances paid and prepayments are presented net of
impairment allowance in the amount of RUB 5,681 million and RUB 6,029 million as of 30 June 2021 and
31 December 2020, respectively.
Other accounts receivable include rights of claim arising from promissory notes of Gazprombank (Joint
Stock Company) in the amount of RUB 30,076 million and RUB 31,639 million as of 30 June 2021 and
31 December 2020, respectively. These rights of claim and promissory notes were pledged to secure the
repayment of loan funds provided to JSC Gazstroyprom.
16PJSC Gazprom
Notes to the Consolidated Interim Condensed Financial Information
(Unaudited)
30 June 2021
(in millions of Russian Rubles)
8 Inventories
For inventories with the cost exceeding the net realisable value, the amount of write-down to net realisable
value was RUB 12,010 million and RUB 12,697 million as of 30 June 2021 and 31 December 2020,
respectively.
9 Property, Plant and Equipment
Operating assets
(including
production Social Assets under
Notes licenses) assets construction Total
As of 31 December 2019
Cost 17,825,647 90,046 4,524,775 22,440,468
Accumulated depreciation (7,135,819) (46,845) - (7,182,664)
Impairment allowance (240,847) - (160,509) (401,356)
Net book value as of 31 December 2019 10,448,981 43,201 4,364,266 14,856,448
Six months ended 30 June 2020
Cost
Additions 32,145 168 618,397 650,710
Transfers 717,377 2,126 (719,503) -
Disposals (61,814) (406) (7,857) (70,077)
Translation differences 158,605 276 101,498 260,379
Accumulated depreciation and impairment
allowance
Depreciation (377,584) (1,331) - (378,915)
Disposals 11,776 204 1,935 13,915
Translation differences (55,409) (78) (3,005) (58,492)
Change in impairment allowance: (14,067) - (156) (14,223)
allowance accrual (14,067) - (313) (14,380)
allowance release - - 157 157
As of 30 June 2020
Cost 18,671,960 92,210 4,517,310 23,281,480
Accumulated depreciation (7,551,591) (48,050) - (7,599,641)
Impairment allowance (260,359) - (161,735) (422,094)
Net book value as of 30 June 2020 10,860,010 44,160 4,355,575 15,259,745
Six months ended 31 December 2020
Cost
Additions 68,567 78 1,082,220 1,150,865
Transfers 905,300 1,756 (907,056) -
Disposals (51,610) - (122,775) (174,385)
Translation differences 178,741 400 101,022 280,163
Accumulated depreciation and impairment
allowance
Depreciation (381,515) (1,397) - (382,912)
Disposals 26,722 - 23,074 49,796
Translation differences (47,116) (138) (1,755) (49,009)
Change in impairment allowance: (11,722) - (19,446) (31,168)
allowance accrual (13,397) - (19,744) (33,141)
allowance release 1,675 - 298 1,973
As of 31 December 2020
Cost 19,779,166 94,444 4,664,513 24,538,123
Accumulated depreciation (7,950,157) (49,585) - (7,999,742)
Impairment allowance (281,632) - (153,654) (435,286)
Net book value as of 31 December 2020 11,547,377 44,859 4,510,859 16,103,095
17PJSC Gazprom
Notes to the Consolidated Interim Condensed Financial Information
(Unaudited)
30 June 2021
(in millions of Russian Rubles)
9 Property, Plant and Equipment (continued)
Operating assets
(including
production Social Assets under
Notes licenses) assets construction Total
Six months ended 30 June 2021
Cost
Additions 19,363 63 729,710 749,136
Transfers 244,639 - (244,639) -
Disposals (44,701) (346) (43,372) (88,419)
Translation differences (72,108) (156) (39,400) (111,664)
Accumulated depreciation and impairment
allowance
Depreciation (392,582) (1,374) - (393,956)
Disposals 17,143 85 13,022 30,250
Translation differences 20,104 62 121 20,287
Change in impairment allowance: - - (2,915) (2,915)
allowance accrual - - (3,028) (3,028)
allowance release - - 113 113
As of 30 June 2021
Cost 19,928,006 94,005 5,065,165 25,087,176
Accumulated depreciation (8,306,765) (50,812) - (8,357,577)
Impairment allowance (282,006) - (141,779) (423,785)
Net book value as of 30 June 2021 11,339,235 43,193 4,923,386 16,305,814
The Group recognised an impairment loss in the amount of RUB 3,028 million for assets for the six months
ended 30 June 2021 and RUB 14,380 million for the six months ended 30 June 2020.
Property, plant and equipment include social assets (rest houses, housing, schools and medical facilities), which
the Group received at privatisation, with a net book value of RUB 18 million and RUB 27 million as of
30 June 2021 and 31 December 2020, respectively.
18PJSC Gazprom
Notes to the Consolidated Interim Condensed Financial Information
(Unaudited)
30 June 2021
(in millions of Russian Rubles)
10 Right-of-Use Assets
Notes
Operating assets Social assets Total
Six months ended 30 June 2020
Net book value as of 31 December 2019 206,738 7,506 214,244
Initial recognition 250,471 8,930 259,401
Accumulated depreciation and impairment allowance (43,733) (1,424) (45,157)
Net book value as of 1 January 2020 206,738 7,506 214,244
Depreciation (19,867) (585) (20,452)
Additions as a result of new leases 3,143 290 3,433
Effect of modification and changes of estimates in lease contracts 706 (118) 588
Disposals (2,418) (221) (2,639)
Translation differences 5,015 - 5,015
Net book value as of 30 June 2020 193,317 6,872 200,189
As of 30 June 2020
Cost 257,482 8,764 266,246
Accumulated depreciation and impairment allowance (64,165) (1,892) (66,057)
Net book value as of 30 June 2020 193,317 6,872 200,189
Six months ended 31 December 2020
Depreciation (20,353) (683) (21,036)
Impairment allowance accrual (15) - (15)
Additions as a result of new leases 6,491 891 7,382
Effect of modification and changes of estimates in lease contracts 6,260 330 6,590
Disposals (229) (1,610) (1,839)
Translation differences 4,042 - 4,042
Net book value as of 31 December 2020 189,513 5,800 195,313
As of 31 December 2020
Cost 272,537 7,706 280,243
Accumulated depreciation and impairment allowance (83,024) (1,906) (84,930)
Net book value as of 31 December 2020 189,513 5,800 195,313
Six months ended 30 June 2021
Depreciation (22,258) (705) (22,963)
Additions as a result of new leases 34,516 443 34,959
Effect of modification and changes of estimates in lease contracts 2,564 19 2,583
Disposals (1,079) (83) (1,162)
Translation differences (772) - (772)
Net book value as of 30 June 2021 202,484 5,474 207,958
As of 30 June 2021
Cost 305,097 8,056 313,153
Accumulated depreciation and impairment allowance (102,613) (2,582) (105,195)
Net book value as of 30 June 2021 202,484 5,474 207,958
Right-of-use assets are mainly represented by leases of ships, used for transportation of liquefied natural gas
and refined products, and leases of properties and land occupied by operating assets.
The total cash outflow under lease agreements amounted to RUB 29,633 million and RUB 27,706 million for
the six months ended 30 June 2021 and 30 June 2020, respectively.
19PJSC Gazprom
Notes to the Consolidated Interim Condensed Financial Information
(Unaudited)
30 June 2021
(in millions of Russian Rubles)
11 Investments in Associates and Joint Ventures
Share of profit (loss)
of associates and
joint ventures for
Carrying value as of the six months ended
30 June 31 December 30 June
Notes 2021 2020 2021 2020
Gazprombank (Joint Stock Company) and
22, 24, 25 its subsidiaries1 Associate 263,123 227,649 28,111 14,169
24, 25 Sakhalin Energy Investment Company Ltd. Associate 239,553 216,853 32,176 23,894
24 PJSC NGK Slavneft and its subsidiaries Joint venture 162,296 156,725 5,571 (5,234)
24, 25 Nord Stream AG Joint venture 127,458 119,666 12,509 10,384
24 JSC Arcticgas Joint venture 121,707 160,312 28,519 11,682
24, 25 JSC Gazstroyprom Associate 83,234 42,567 1,894 (1,486)
WIGA Transport Beteiligungs-
24 GmbH & Co. KG and its subsidiaries Joint venture 63,544 68,824 6,101 4,945
24 JSC Messoyakhaneftegas Joint venture 42,165 44,387 7,279 3,728
24 JSC EUROPOL GAZ Associate 37,038 37,522 1,270 408
22, 24 JSC NPF GAZFOND2 Associate 36,454 34,863 1,591 5,431
24 JSC Achimgaz Joint venture 32,623 33,313 11,373 5,742
Wintershall AG Associate 18,854 19,172 692 (381)
24 KazRosGas LLP Joint venture 14,725 13,460 1,595 275
24 CJSC Northgas Joint venture 13,596 12,226 1,370 720
Wintershall Noordzee B.V. Joint venture 4,756 4,043 369 (716)
24 JSC Latvijas Gaze and its subsidiaries Associate 3,941 4,310 166 419
Other (net of allowance for investments
impairment in the amount of
RUB 20,732 million and
RUB 21,435 million as of
30 June 2021 and
31 December 2020, respectively) 142,171 131,349 3,779 861
1,407,238 1,327, 241 144, 365 74,841
1
In March 2020 the Group purchased Gazprombank (Joint Stock Company) ordinary shares from one of its shareholders, as the result
of which the Group’s share in voting shares increased from 47.87 % to 49.88 %.
2
In January 2020 the remaining 25 % of ordinary registered uncertificated shares not allocated at the date of JSC NPF GAZFOND
state registration were distributed among its shareholders in proportion to the number of the shares they owned. The Group’s voting
share in JSC NPF GAZFOND did not change. As of 31 December 2020 the Group’s share in voting shares is equal to ownership
interest.
Summarised financial information of the Group’s significant associates and joint ventures is presented below.
The disclosed values of assets, liabilities, revenues, profit (loss) of the Group’s significant associates and joint
ventures represent total values and not the Group’s share of them.
20PJSC Gazprom
Notes to the Consolidated Interim Condensed Financial Information
(Unaudited)
30 June 2021
(in millions of Russian Rubles)
11 Investments in Associates and Joint Ventures (continued)
This financial information may differ from the financial statements of an associate or a joint venture prepared
and presented in accordance with IFRS due to adjustments required in application of the equity method, such
as fair value adjustments to identifiable assets and liabilities at the date of acquisition and adjustments for
differences in accounting policies.
Ownership
interest (%)1
as of Country Six months ended
30 June of primary As of 30 June 2021 30 June 2021
2021 operations Assets Liabilities Revenues Profit
Gazprombank (Joint Stock Company) and
its subsidiaries2, 7 49.88 Russia 7,830,943 7,120,766 142,900 76,169
Sakhalin Energy Investment Company Ltd.3 50 Russia 958,749 479,642 197,473 64,352
JSC Gazstroyprom 49 Russia 890,011 760,505 166,908 3,865
PJSC NGK Slavneft and its subsidiaries 49.88 Russia 638,840 307,284 132,234 11,281
Russia,
Nord Stream AG4, 5 51 Germany 464,745 214,824 48,037 24,528
JSC NPF GAZFOND 42 Russia 460,366 372,564 - 3,832
JSC Arcticgas 50 Russia 457,427 238,340 134,737 57,042
WIGA Transport Beteiligungs-GmbH & Co. KG
and its subsidiaries 49.98 Germany 374,457 230,360 35,042 11,462
JSC Messoyakhaneftegas 50 Russia 252,073 168,165 80,724 14,562
JSC Achimgaz 50 Russia 99,018 33,771 45,669 22,746
JSC EUROPOL GAZ 48 Poland 79,641 2,480 13,577 2,645
Wintershall AG6 49 Libya 66,731 41,709 5,142 1,413
CJSC Northgas 50 Russia 44,418 16,287 9,136 2,741
Wintershall Noordzee B.V. 50 Netherlands 43,759 34,910 8,056 739
JSC Latvijas Gaze and its subsidiaries 34 Latvia 33,802 13,612 13,808 489
KazRosGaz LLP 50 Kazakhstan 32,211 2,761 18,815 3,190
Ownership
interest (%)1 Six months ended
as of Country As of 31 December 2020 30 June 2020
31 December of primary Profit
2020 operations Assets Liabilities Revenues (loss)
Gazprombank (Joint Stock Company) and
its subsidiaries2, 7 49.88 Russia 7,430,261 6,791,388 112,379 28,408
Sakhalin Energy Investment Company Ltd.3 50 Russia 982,250 548,545 173,071 47,788
JSC Gazstroyprom 49 Russia 879,528 753,886 40,984 (3,032)
PJSC NGK Slavneft and its subsidiaries 49.88 Russia 599,896 280,159 93,515 (10,778)
Russia,
Nord Stream AG4, 5 51 Germany 486,764 252,122 41,404 20,360
JSC NPF GAZFOND 42 Russia 462,278 378,308 - 13,081
JSC Arcticgas 50 Russia 436,689 140,391 72,247 23,363
WIGA Transport Beteiligungs-GmbH & Co. KG
and its subsidiaries 49.98 Germany 398,438 240,026 30,798 10,094
JSC Messoyakhaneftegas 50 Russia 228,539 140,187 41,772 7,461
JSC Achimgaz 50 Russia 94,507 27,880 40,411 11,484
JSC EUROPOL GAZ 48 Poland 80,163 1,994 8,308 851
Wintershall AG6 49 Libya 69,861 45,455 - (777)
Wintershall Noordzee B.V. 50 Netherlands 45,480 36,901 2,298 (1,433)
CJSC Northgas 50 Russia 44,337 18,945 7,314 1,439
JSC Latvijas Gaze and its subsidiaries 34 Latvia 29,562 7,228 7,486 1,232
KazRosGaz LLP 50 Kazakhstan 28,572 1,653 16,226 549
1
Cumulative share of the Group in share capital of investees.
2
The amount of revenue of Gazprombank (Joint Stock Company) and its subsidiaries includes revenue of media business, machinery
business and other non-banking entities.
3
Country of incorporation is Bermuda Islands.
4
Country of incorporation is Switzerland.
5
Investment in the company is accounted under the equity method of accounting, as the Group did not obtain control due to its corporate
governance structure.
6
Country of incorporation is Germany.
7
Share in voting shares.
21PJSC Gazprom
Notes to the Consolidated Interim Condensed Financial Information
(Unaudited)
30 June 2021
(in millions of Russian Rubles)
12 Long-Term Accounts Receivable and Prepayments
30 June 31 December
2021 2020
Financial assets
Long-term trade accounts receivable 83,521 47,661
Long-term loans receivable 190,051 194,215
Long-term other accounts receivable 85,517 83,460
359,089 325,336
Non-financial assets
Long-term prepayments 26,243 23,082
Advances for assets under construction 768,348 640,439
794,591 663,521
Total long-term accounts receivable and prepayments 1,153,680 988,857
Long-term accounts receivable are presented net of allowance for expected credit losses in the amount of
RUB 15,775 million and RUB 16,083 million as of 30 June 2021 and 31 December 2020, respectively.
Prepayments and advances paid for assets under construction are presented net of impairment allowance in the
amount of RUB 8,740 million and RUB 8,794 million as of 30 June 2021 and 31 December 2020, respectively.
13 Other Current and Non-Current Assets
Other current assets are provided in the table below.
30 June 31 December
Notes 2021 2020
Financial assets
Short-term deposits 234,969 15,101
23 Derivative financial instruments 177,309 107,162
412,278 122,263
Non-financial assets
Prepaid VAT 168,489 118,797
Prepaid profit tax 15,505 19,212
Other 72,826 40,733
256,820 178,742
Total other current assets 669,098 301,005
Other non-current assets are provided in the table below.
30 June 31 December
Notes 2021 2020
Financial assets
23 Derivative financial instruments 36,613 19,286
Long-term deposits 28,037 1,562
64,650 20,848
Non-financial assets
Intangible assets 80,353 80,040
VAT recoverable related to assets under construction 19,324 22,575
22 Net pension plan assets 18,799 -
Other 293,140 298,204
411,616 400,819
Total other non-current assets 476,266 421,667
22PJSC Gazprom
Notes to the Consolidated Interim Condensed Financial Information
(Unaudited)
30 June 2021
(in millions of Russian Rubles)
14 Long-Term Borrowings, Promissory Notes
Final 30 June 31 December
Currency maturity 2021 2020
Long-term borrowings, promissory notes
payable to:
China Construction Bank Corporation,
Beijing branch1, 2 Euro 2034 244,577 248,384
Loan participation notes issued in February 20203 US Dollar 2030 145,362 148,344
Loan participation notes issued in January 20213 US Dollar 2029 145,244 -
Loan participation notes issued in September 20124 US Dollar 2022 109,891 112,174
Loan participation notes issued in November 20134 US Dollar 2023 109,155 111,423
Gazprombank (Joint Stock Company) Russian Ruble 2027 108,775 106,342
Loan participation notes issued in March 20075 US Dollar 2022 96,024 98,018
Loan participation notes issued in August 20075 US Dollar 2037 92,938 94,868
Loan participation notes issued in February 20195 US Dollar 2026 91,759 93,620
Loan participation notes issued in April 20045 US Dollar 2034 88,157 89,988
Loan participation notes issued in November 20165 Euro 2023 87,627 90,737
Loan participation notes issued in November 20185 Euro 2024 86,942 92,759
Loan participation notes issued in April 20203 Euro 2025 86,193 91,978
Loan participation notes issued in February 20213 Euro 2027 85,922 -
British Pound
Loan participation notes issued in April 20175, 6 Sterling 2024 84,911 89,293
PJSC Sberbank1, 2 Russian Ruble 2034 81,365 71,312
Gazprombank (Joint Stock Company) 1, 2 Russian Ruble 2034 79,328 35,072
Loan participation notes issued in July 20125 US Dollar 2022 73,984 75,521
Intesa Sanpaolo Bank Luxembourg S.A. 1 Euro 2023 73,756 93,130
Loan participation notes issued in June 20203 US Dollar 2027 71,832 73,291
J.P. Morgan AG1 Euro 2023 67,654 85,421
Loan participation notes issued in February 20135 US Dollar 2028 66,434 67,814
Loan participation notes issued in November 20175 Euro 2024 65,246 67,851
Loan participation notes issued in March 20185 Euro 2026 64,761 68,965
UniCredit S.p.A. Euro 2025 60,354 63,473
Loan participation notes issued in March 20185 Swiss Franc 2023 59,053 63,169
Loan participation notes issued in March 20175 US Dollar 2027 54,687 55,801
Wintershall Nederland Transport and
Trading B.V.7 Euro 2034 43,850 46,738
OMV Gas Marketing Trading & Finance B.V.7 Euro 2034 43,849 46,738
Shell Exploration and Production (LXXI) B.V.7 Euro 2034 43,848 46,738
Uniper Gas Transportation and Finance B.V.7 Euro 2034 43,848 46,738
Engie Energy Management Holding
Switzerland AG7 Euro 2034 43,847 46,737
Loan participation notes issued in March 20135 Euro 2025 43,627 46,892
Sumitomo Mitsui Banking Corporation Euro 2025 42,888 45,096
Mizuho Bank Ltd. Euro 2025 42,841 45,047
Loan issued in December 20188 Japanese yen 2028 42,080 46,045
Loan participation notes issued in
November 20165, 6 Swiss Franc 2021 40,796 42,324
Wintershall Nederland Transport and
Trading B.V.7 Euro 2035 40,371 39,843
Uniper Gas Transportation and Finance B.V.7 Euro 2035 40,371 39,842
OMV Gas Marketing Trading & Finance B.V.7 Euro 2035 40,368 39,839
Shell Exploration and Production (LXXI) B.V.7 Euro 2035 40,368 39,839
Engie Energy Management Holding
Switzerland AG7 Euro 2035 40,368 39,839
Loan participation notes issued in July 20175, 6 Swiss Franc 2022 39,907 41,504
23PJSC Gazprom
Notes to the Consolidated Interim Condensed Financial Information
(Unaudited)
30 June 2021
(in millions of Russian Rubles)
14 Long-Term Borrowings, Promissory Notes (continued)
Final 30 June 31 December
Currency maturity 2021 2020
Loan participation notes issued in June 20213 Swiss Franc 2027 38,849 -
Intesa Sanpaolo S.p.A. 1, 2 Euro 2034 38,515 31,893
Natixis1 Euro 2024 36,968 45,391
J.P. Morgan AG1 Euro 2022 36,821 51,657
Credit Agricole CIB, London branch Euro 2023 34,433 36,182
ING Bank, a branch of ING-DiBa AG Euro 2023 34,429 36,202
MUFG Bank Ltd. Euro 2023 30,633 38,679
Credit Agricole CIB Euro 2023 29,488 38,780
UniCredit S.p.A. Euro 2022 27,751 38,930
Russian bonds issued in December 20209 Russian Ruble 2023 27,047 27,049
JSC ALFA-BANK US Dollar 2023 26,426 26,971
Russian bonds issued in March 20184 Russian Ruble 2024 25,547 25,552
Russian bonds issued in October 20174 Russian Ruble 2022 25,387 25,392
Russian bonds issued in November 20194 Russian Ruble 2024 25,189 25,209
ING Bank N.V. 1,2 Euro 2036 24,575 13,331
PJSC Sberbank Euro 2023 23,927 31,462
PJSC VTB Bank Russian Ruble 2028 23,260 14,698
UniCredit S.p.A. Euro 2025 23,048 21,800
PJSC Sberbank Euro 2025 21,072 22,168
Russian bonds issued in December 20204 Russian Ruble 2024 20,151 20,016
Russian bonds issued in December 20194 Russian Ruble 2029 20,021 20,023
Credit Agricole CIB Euro 2022 17,302 27,295
PJSC Sberbank1, 2 Euro 2034 16,586 17,458
Russian bonds issued in July 201910 Russian Ruble 2024 15,539 15,542
VTB Bank (Europe) SE Euro 2027 15,527 17,695
Russian bonds issued in July 201811 Russian Ruble 2048 15,516 15,519
Russian bonds issued in July 201811 Russian Ruble 2048 15,516 15,519
Russian bonds issued in February 201710 Russian Ruble 2027 15,512 15,516
Russian bonds issued in February 201710 Russian Ruble 2027 15,512 15,516
Russian bonds issued in August 20174 Russian Ruble 2024 15,495 15,496
Russian bonds issued in April 20174 Russian Ruble 2022 15,297 15,300
Russian bonds issued in November 201311 Russian Ruble 2043 15,117 15,088
Russian bonds issued in November 201311 Russian Ruble 2043 15,117 15,088
Gazprombank (Joint Stock Company) Russian Ruble 2022 15,111 15,111
Russian bonds issued in June 201910 Russian Ruble 2022 15,092 15,095
Russian bonds issued in June 202010 Russian Ruble 2027 15,073 15,075
Russian bonds issued in June 202010 Russian Ruble 2025 15,070 15,073
JSC BANK “ROSSIYA” Russian Ruble 2022 15,000 15,000
PJSC CREDIT BANK OF MOSCOW Russian Ruble 2024 14,948 14,940
PJSC CREDIT BANK OF MOSCOW Russian Ruble 2025 14,942 14,935
Intesa Sanpaolo S.p.A., London branch 1, 2 Euro 2036 14,238 1,305
PJSC Sberbank1, 2 Euro 2034 11,428 6,235
Gazprombank (Joint Stock Company) Russian Ruble 2025 11,250 12,750
Russian bonds issued in July 201811 Russian Ruble 2033 10,344 10,346
Russian bonds issued in August 20164 Russian Ruble 2046 10,327 10,330
Russian bonds issued in February 201810 Russian Ruble 2028 10,249 10,251
Russian bonds issued in February 201810 Russian Ruble 2028 10,249 10,251
Russian bonds issued in February 20204 Russian Ruble 2025 10,047 10,047
Russian bonds issued in December 20174 Russian Ruble 2024 10,027 10,030
PJSC Sberbank Russian Ruble 2025 57 32,854
Loan participation notes issued in February 20145 Euro 2021 - 70,086
Loan participation notes issued in November 20115 US Dollar 2021 - 45,493
Citibank Europe plc1 Euro 2021 - 32,906
Bank of China Limited, London branch Euro 2021 - 26,115
24PJSC Gazprom
Notes to the Consolidated Interim Condensed Financial Information
(Unaudited)
30 June 2021
(in millions of Russian Rubles)
14 Long-Term Borrowings, Promissory Notes (continued)
Final 30 June 31 December
Currency maturity 2021 2020
PJSC VTB Bank Euro 2021 - 18,130
Russian bonds issued in February 20114 Russian Ruble 2021 - 10,325
Other long-term borrowings, promissory notes Various Various 554,240 584,381
Total long-term borrowings, promissory notes 4,694,423 4,788,028
Less current portion of long-term borrowings (498,753) (573,948)
4,195,670 4,214,080
1
The loans received from consortiums of banks, the named lender is the bank-agent.
2
The loan received to finance the Amur gas processing plant construction.
3
The issuer of these bonds is Gaz Finance Plc. The bonds were issued under EUR 30,000 million Programme for the Issuance of Loan
Participation Notes.
4
The issuer of these bonds is PJSC Gazprom Neft.
5
The issuer of these bonds is Gaz Capital S.A. The bonds were issued under USD 40,000 million Programme for the Issuance of Loan
Participation Notes.
6
According to the signed agreements between the bond issuer Gas Capital S.A. and the banks, settlements for the bonds are made in Euro
(up to the achievement of a coefficient based on the ratio of currency exchange rates set in the agreements).
7
Borrowings were obtained for financing of the Nord Stream 2 project.
8
The issuer of these bonds is GazAsia Capital S.A.
9
The issuer of these bonds is PJSC WGC-2.
10
The issuer of these bonds is Gazprom сapital LLC.
11
The issuer of these bonds is PJSC Gazprom.
The maturity analysis of long-term borrowings and promissory notes is presented in the table below.
30 June 31 December
Maturity of long-term borrowings, promissory notes 2021 2020
between one and two years 622,501 788,176
between two and five years 1,679,611 1,586,715
after five years 1,893,558 1,839,189
4,195,670 4,214,080
Long-term liabilities include fixed interest rate borrowings with a carrying value of RUB 2,703,392 million
and RUB 2,626,491 million and fair value of RUB 3,008,228 million and RUB 3,021,359 million as
of 30 June 2021 and 31 December 2020, respectively.
All other long-term borrowings have variable interest rates generally linked to LIBOR and EURIBOR. Their
carrying value is RUB 1,991,031 million and RUB 2,161,537 million and fair value is RUB 2,196,559 million
and RUB 2,409,733 million as of 30 June 2021 and 31 December 2020, respectively.
As of 30 June 2021 and 31 December 2020 according to the agreements signed within the framework of
financing the Nord Stream 2 project with Wintershall Nederland Transport and Trading B.V., OMV Gas
Marketing Trading & Finance B.V., Shell Exploration and Production (LXXI) B.V., Engie Energy
Management Holding Switzerland AG, Uniper Gas Transportation and Finance B.V., 100 % of shares of
Nord Stream 2 AG were pledged until a full settlement of the secured obligations.
As of 30 June 2021 and 31 December 2020 according to the agreements signed in December 2019 within the
framework of financing the construction of the Amur gas processing plant, 99.99 % of interest in the charter
capital of LLC Gazprom pererabotka Blagoveshchensk (a subsidiary) was pledged until a full settlement of the
secured obligations. As of 30 June 2021 and 31 December 2020 the secured obligations to agent banks
China Construction Bank Corporation, Beijing branch, ING Bank N.V., Intesa Sanpaolo S.p.A.,
London branch, Intesa Sanpaolo S.p.A., PJSC Sberbank and Gazprombank (Joint Stock Company) amounted
to RUB 555,668 million and RUB 471,558 million, respectively.
Under the terms of the Russian bonds with the nominal value of RUB 25,000 million issued by
PJSC Gazprom Neft in November 2019 and due in 2024 the issuer can execute the right of early redemption
in November 2021.
Under the terms of the Russian bonds with the nominal value of RUB 15,000 million issued by PJSC Gazprom
in July 2018 and due in 2048 the issuer can execute the right of early redemption in July 2025.
Under the terms of the Russian bonds with the nominal value of RUB 15,000 million issued by PJSC Gazprom
in July 2018 and due in 2048 the issuer can execute the right of early redemption in July 2025.
25You can also read