IGO Limited
3Q22 Results Presentation
29 April 2022
←
→
Page content transcription
If your browser does not render page correctly, please read the page content below
IGO Limited 3Q22 Results Presentation 29 April 2022
Cautionary Statements & Disclaimer
• This presentation has been prepared by IGO Limited (“IGO”) (ABN 46 092 786 304). It should not be considered as an offer or invitation to subscribe for or purchase any securities in IGO
  or as an inducement to make an offer or invitation with respect to those securities in any jurisdiction.
• This presentation contains general summary information about IGO. The information, opinions or conclusions expressed in the course of this presentation should be read in conjunction
  with IGO’s other periodic and continuous disclosure announcements lodged with the ASX, which are available on the IGO website. No representation or warranty, express or implied, is
  made in relation to the fairness, accuracy or completeness of the information, opinions and conclusions expressed in this presentation.
• This presentation includes forward looking information regarding future events, conditions, circumstances and the future financial performance of IGO. Often, but not always, forward
  looking statements can be identified by the use of forward-looking words such as "may", "will", "expect", "intend", "plan", "estimate", "anticipate", "continue" and "guidance", or other similar
  words and may include statements regarding plans, strategies and objectives of management, anticipated production or construction commencement dates and expected costs or
  production outputs. Such forecasts, projections and information are not a guarantee of future performance and involve unknown risks and uncertainties, many of which are beyond IGO’s
  control, which may cause actual results and developments to differ materially from those expressed or implied. Further details of these risks are set out below. All references to future
  production and production guidance made in relation to IGO are subject to the completion of all necessary feasibility studies, permit applications and approvals, construction, financing
  arrangements and access to the necessary infrastructure. Where such a reference is made, it should be read subject to this paragraph and in conjunction with further information about the
  Mineral Resources and Ore Reserves, as well as any Competent Persons' Statements included in periodic and continuous disclosure announcements lodged with the ASX. Forward
  looking statements in this presentation only apply at the date of issue. Subject to any continuing obligations under applicable law or any relevant stock exchange listing rules, in providing
  this information IGO does not undertake any obligation to publicly update or revise any of the forward-looking statements or to advise of any change in events, conditions or circumstances
  on which any such statement is based.
• There are a number of risks specific to IGO and of a general nature which may affect the future operating and financial performance of IGO and the value of an investment in IGO including
  and not limited to economic conditions, stock market fluctuations, commodity demand and price movements, access to infrastructure, timing of environmental approvals, regulatory risks,
  operational risks, reliance on key personnel, reserve and resource estimations, native title and title risks, foreign currency fluctuations and mining development, construction and
  commissioning risk. The production guidance in this presentation is subject to risks specific to IGO and of a general nature which may affect the future operating and financial performance
  of IGO.
• Quarterly Financial Results are unaudited. All currency amounts are in Australian Dollars unless otherwise noted. Net Cash is cash balance less outstanding debt, Net Debt is outstanding
  debt less cash balances.
• Nickel cash costs are reported inclusive of royalties and after by-product credits on a per unit of payable metal basis, unless otherwise stated. Lithium cash costs are reported as COGS
  (cash costs of goods sold) per tonne sold and is inclusive of ore mining costs, processing, general and administrative, selling & marketing, inventory movements and royalty expense.
• Underlying EBITDA is a non-IFRS measure and comprises net profit or loss after tax, adjusted to exclude income tax expense, finance costs, interest income, asset impairments, gain/loss
  on sale of investments, depreciation and amortisation and once-off transaction costs. Underlying EBITA includes IGO’s share of TLEA net profit after tax.
• Free Cash Flow comprises Net Cash Flow from Operating Activities and Net Cash Flow from Investing Activities. Underlying adjustments exclude acquisition costs, proceeds from
  investment sales including Tropicana, and payments for investments and mineral interests.
• IGO has a 49% interest in Tianqi Lithium Energy Australia Pty Ltd (TLEA) and therefore, as a non-controlling shareholder, recognises its share of Net Profit After Tax of TLEA in its
  consolidated financials. As such, IGO has provided additional information on the operating, financial and expansion activities at both Greenbushes and the Kwinana Refinery which reflects
  IGO’s understanding of those operating, financial and expansion activities based on information provided to IGO by TLEA.

                                                                                                                                                                                                      2
Competent Persons Statement

• The information in this presentation that relates to IGO’s Mineral Resources or Ore Reserves is extracted from IGO’s ASX release dated 31 January 2022 titled “Annual Mineral Resource and
  Ore Reserve Estimates Update – CY21” and is available at https://www.igo.com.au/site/investor-center/ASX-Announcements or www.asx.com.au. IGO confirms that it is not aware of any new
  information or data that materially affects the information included in that original market announcement and that all material assumptions and technical parameters underpinning the estimates
  in that announcement continue to apply and have not materially changed. IGO confirms that the form and context in which the Competent Person’s findings are presented have not been
  materially modified from the original market announcement.

                                                                                                                                                                                                    2
Safety
 No material safety incidents nor major disruption to operations due to COVID-19

                     Lag Safety Indicators (TRepIFR1 & SPIFR2)                                                                                                   Lead Safety Indicators
20                                                                                                                 7       500

19                                                                                                                         450
                                                                                                                   6
18
                                                                                                                           400
17
                                                                                                                   5       350
16
                                                                                                                           300
15                                                                                                                 4

14                                                                                                                         250

13                                                                                                                 3
                                                                                                                           200

12
                                                                                                                           150
                                                                                                                   2
11
                                                                                                                           100
10
                                                                                                                   1
                                                                                                                             50
 9

 8                                                                                                                 0          0

                                         TRepIFR (lhs)             SPIFR (rhs)                                                         Visual Safety Leadership Interactions (VSLI)      Hazard    Near Miss   Workplace Inspection

1.   12 month moving average TRepIFR – Total Reportable Injury Frequency Rate: calculated as the number of reportable injuries x 1,000,000 divided by the total number of hours worked.
2.   12 month moving average SPIFR - Serious Potential Incident Frequency Rate: calculated as the number of serious potential incidents x 1,000,000 divided by the total number of hours worked.
                                                                                                                                                                                                                                      4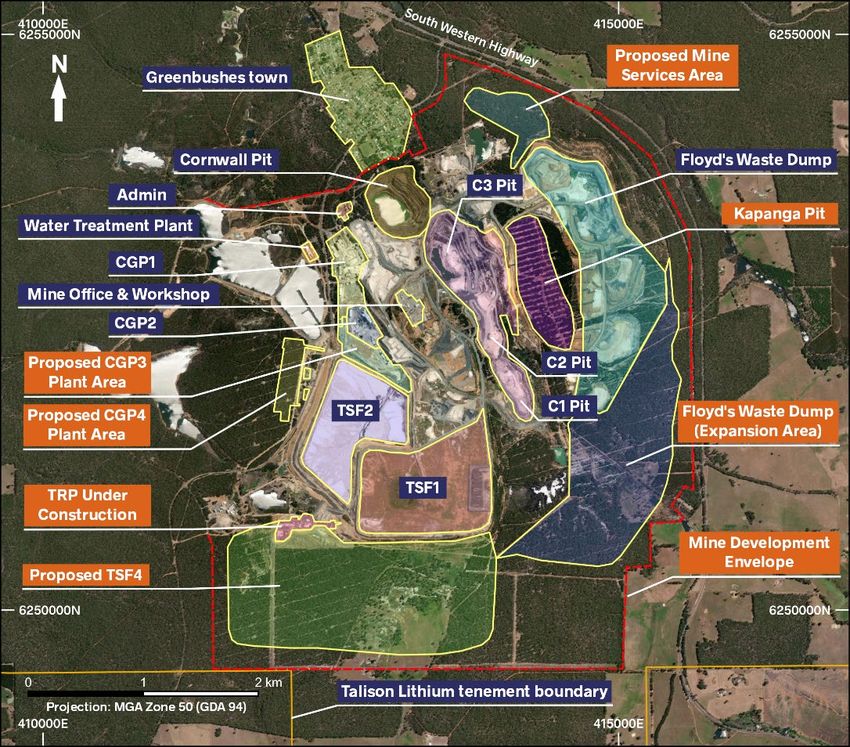
Sustainability
Continued focus on industry leading performance and reporting

                                                     Recognises the top 15% of high performing
                                                     sustainable companies globally

                                                     IGO admitted for the second year running

                                                     IGO was the only Australian company
                                                     included in the Metals and Mining category

                                                                                                  5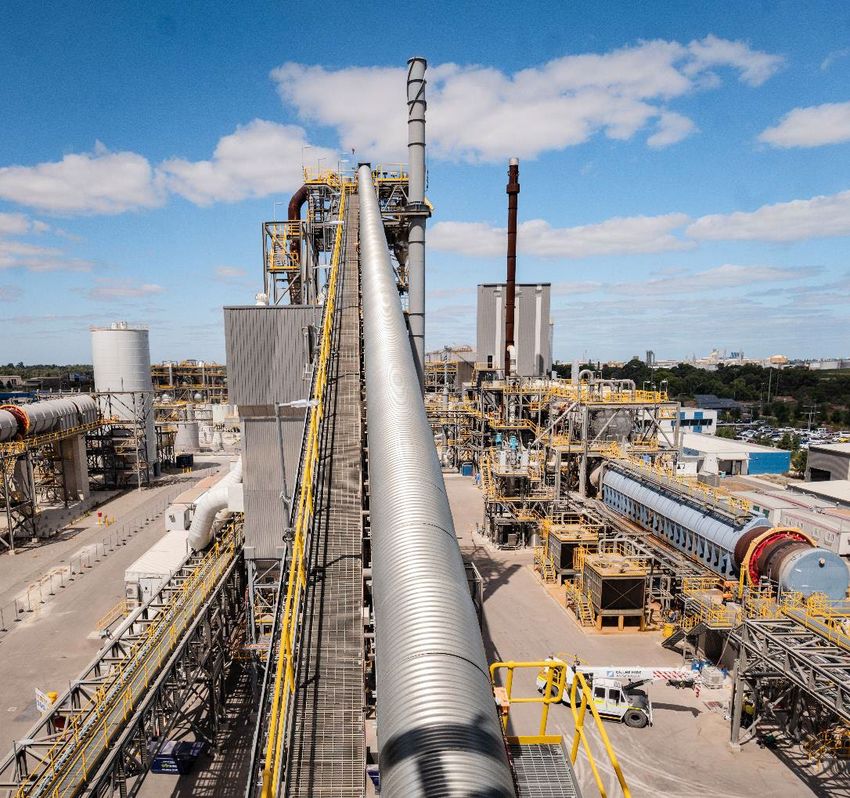
3Q22
FY19Highlights
     and 4Q19 Highlights
Strong nickel and lithium prices deliver improved margins and quarterly profit result

 People             Continued high level of engagement with our people while keeping them safe

 Nova               Strong nickel price drove improved financial results despite expected lower QoQ metal production

                    Solid quarter of spodumene production as TRP commenced commissioning and CGP3 construction
 Greenbushes        approved

 Kwinana Refinery   Commissioning process progressing toward first battery grade product

 Growth             Negotiated a revised Scheme of Arrangement to acquire Western Areas

 Financials         Higher commodity prices underpin Strong EBITDA and NPAT results

                                                                                                                       6
3Q22 Financial Results
Consistent operational performance and strong metals prices delivered strong financial results

                                                                                        Units                         2Q221                            3Q221                            QoQ1     YTD221
Sales Revenue                                                                             A$M                          188.0                             245.5                          ▲ 31%     622.7

Underlying EBITDA2                                                                        A$M                          122.9                             232.6                          ▲ 89%     458.5
Net Profit After Tax                                                                      A$M                            52.3                            133.0                          ▲ 154%    233.7
Net Cash from Operating Activities                                                        A$M                            72.5                            (78.0)                         ▼ 208%    125.5
Underlying Free Cash Flow3                                                                A$M                            72.2                            (83.5)                         ▼ 216%    99.9
Cash & Net Cash                                                                           A$M                          569.8                             440.2                          ▼ 23%     440.2

•        Strong growth in revenue driven by higher nickel sales volume and materially higher realised prices
•        Underlying EBITDA and NPAT benefited from higher earnings from Nova, stronger profit from TLEA JV and increase in
         MTM value of listed investments
•        Payment of A$171M income tax (substantially relating to sale of Tropicana) impacted Net Cash from Operating Activities
         and Underlying Free Cash Flow
•        A$37.9M of fully franked dividends paid during the Quarter

    1.   2Q22 is the three months ending 31 December 2021, 3Q22 is the three months ending 31 March 2022, YTD22 is the nine months ending 31 March 2022 and QoQ is Quarter on Quarter
    2.   Underlying EBITDA is a non-IFRS measure (refer to Disclaimer page) and includes IGO’s share of net profit from TLEA.
    3.   Free Cash Flow comprises Net Cash Flow from Operating Activities and Net Cash Flow from Investing Activities. Refer to Disclaimer page for “Underlying” adjustments.
                                                                                                                                                                                                          7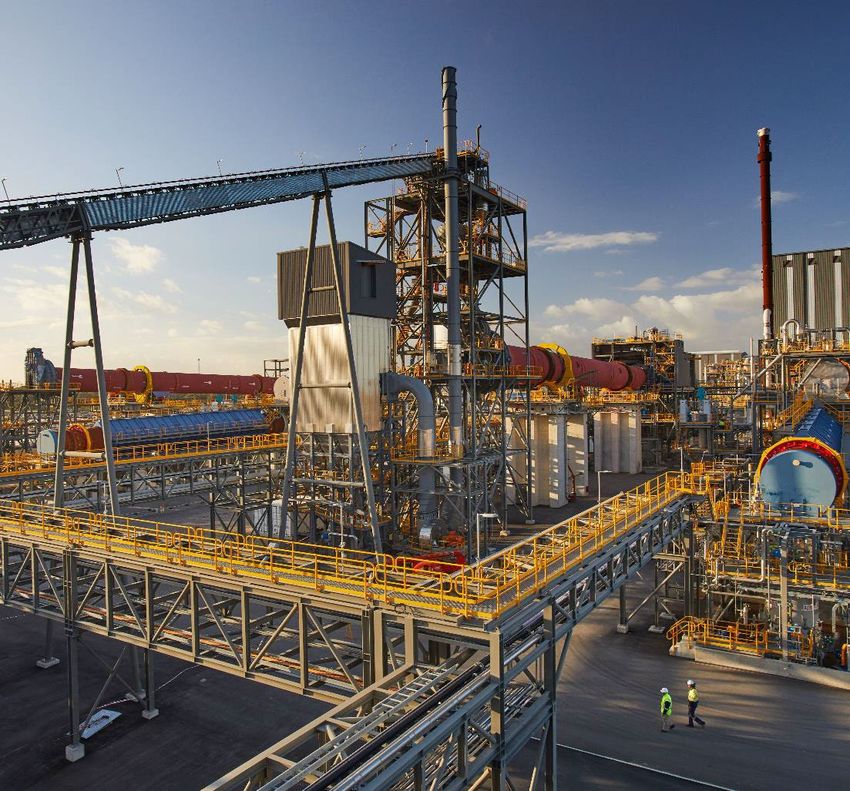
3Q22 NPAT Reconciliation
Contribution from Nova and TLEA JV lifts NPAT by 154% QoQ

 A$M
  180

                                                                                                 2.9        2.7
  160                                                                             0.9

                                                                                                                  33.6
  140
                                                                 51.7

  120

                                                 10.6
  100                             3.9

   80
                     43.3
                                                                                                                           133.0
   60

   40

           52.3
   20

   -
        2Q22 NPAT    Nova    Exploration &     Mark-to-    Share of Profits   Net Finance   Impairment of   D&A   Tax    3Q22 NPAT
                    EBITDA    Evaluation        market        of TLEA           Costs           E&E
                               EBITDA        investments

                                                                                                                                     8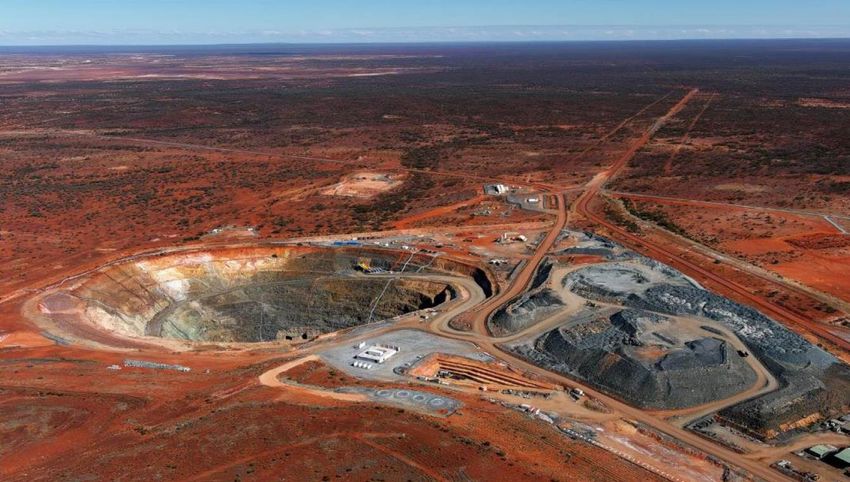
3Q22 Cash Flow Reconciliation
Stronger Nova FCF generation offset payment of interim dividend and income tax liability

  A$M
 800

 700
                                                    12.8            4.9            6.0            0.7          1.1
                                       105.5                                                                              37.9
 600

                                                                                                                                     170.8
 500

                                                                                                                                                   0.9
 400

 300
                    569.8

                                                                                                                                                               440.2
 200

 100

      -
                  Cash at           Nova FCF    Exploration & Corporate and    Payments      Finance Costs     Lease    Dividend   Income Tax    Effect of     Cash at
                31 Dec 2021                      Evaluation       Other     relating to sale                 Payments   Payments                 Foreign     31 Mar 2022
                                                                             of Tropicana                                                       Exchange
                                                                                                                                                Movements
 1.       Figures may not sum due to rounding
                                                                                                                                                                           9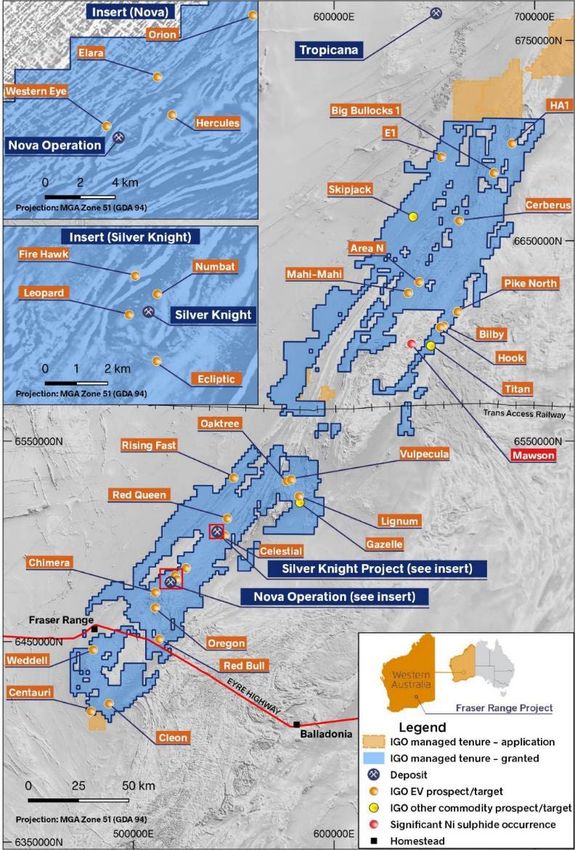
Nova (Nickel-Copper-Cobalt)
         IGO:100%

                              10
Nova
QoQ production softer, as expected, due to lower grades
Metric Units 2Q221 3Q221 YTD221 YTD22 Guidance1
Nickel in concentrate t 6,987 6,290 20,166 18,750 to 20,250
Copper in concentrate t 2,884 2,762 8,669 8,625 to 9,375
Cobalt in concentrate t 259 237 749 675 to 750
Cash cost (payable) 2 A$/Ib Ni 1.73 1.86 1.86 2.00 to 2.40
Sustaining/ improvement Capex A$M 1.9 4.1 7.4 14.2 to 16.5
Development Capex A$M - 1.1 1.1 3.8 to 5.3
• QoQ metal production lower due to lower milled grades
• Cash costs higher QoQ as a result of lower production volume, offset by stronger by-product credit pricing
• 3Q22 average nickel price of A$37,637/t was 38% higher vs 2Q22 (A$27,217/t)
• Production of all metals remains in line with FY22 Guidance
1. 2Q22 is the three months ending 31 December 2021, 3Q22 is the three months ending 31 March 2022, YTD22 is the nine months ending 31 March 2022 and YTD22 Guidance is the pro-rata YTD Guidance for the nine months to
31 March 2022
2. Cash costs reported per pound of payable metal produced inclusive of royalties and net of by-product credits. 11Nova
On track to beat FY22 cash cost guidance of A$2.00/lb – A$2.40/lb
Nova Production & Cash Costs Nova Cash Flow Reconciliation
Tonnes A$/lb A$M
9,000 $2.50 200
8,000 FY22 Cash Cost Guidance Range (A$2.00 – A$2.40/lb) 180
6.3
7,000 $2.00 160
$1.73
$1.99 $1.86
140 83.4
6,000 $1.28
$1.50 120
5,000
100 16.1
4,000 7,887 171.6
$1.00 80
3,000 3,538 6,290
6,987
6,889 3,023 60
2,884 110.7
2,000 2,762
$0.50 40
1,000 20
0 $- -
4Q21 1Q22 2Q22 3Q22 Underlying Inventories Net Trade Other Working Operating
EBITDA Receivables Capital adj Cash Flow
Nickel in concentrate Copper in concentrate Cash Cost A$/lb (payable)
12Silver Knight
Resource Development and Exploration
Initial Mineral Resource Estimate for Silver Knight
Deposit calculated:
• 0.39Mt @ 2.81% Ni, 1.46% Cu, 0.14% Co1
• Containing 11kt Ni, 5.7kt Cu, 0.54kt Co1
Infill and extension RC drilling program planned to
commence in 4Q22 to support the Feasibility Study
High-priority exploration targets to be tested
during 4Q22: Leopard, Numbat, Red Queen
1. Refer to CY21 Mineral Resource and Ore Reserve Update, released to ASX on 31 January 2022
13Lithium Joint Venture (TLEA)
IGO:49% | Tianqi Lithium Corporation: 51%
Kwinana Lithium Hydroxide Refinery 14TLEA Lithium Joint Venture1
Higher spodumene prices generating strong financials
IGO share of NPAT from TLEA
A$60.5M (2Q22: A$8.8M)
2H22 Spodumene Revenue Price of US$1,770/t
FOB2, with next price reset from 1 July 2022
IGO expects first dividend from TLEA mid-2022
1. IGO 49% non-controlling interest
2. FOB is a shipping term for free on board designated by Incoterms® 2020 rules
15TLEA NPAT Reconciliation
Higher spodumene margins drives A$61M TLEA NPAT result
A$M
Greenbushes (100% basis) Kwinana (100% basis)
450
400
A$75M NPAT to IGO
(Greenbushes)
350
300
(A$7M) NPAT loss to IGO
(Kwinana)
250
200
427
(224)
150 299
100 (17) 7 (7)
50
(14) 61
-
(50)
1. OEI: Outside Equity Interest and represents non-IGO interests 16Greenbushes1
Strong quarterly result with first contribution from Tailings Retreatment Project
YTD22
Metric Units 2Q222 3Q222 YTD222
Guidance2
Spodumene Concentrate 3 kt 259 270 797 825 to 938
Cost of Goods Sold (COGS) excl. royalties4 A$/t 242 235 230 225 to 275
Cost of Goods Sold (COGS)4 A$/t 388 476 386 350 to 400
EBITDA A$M 123 427 699 Not Provided
Sustaining & Growth Capex A$M 36 43 116 250 to 300
Mine Development (Capitalised Waste) A$M 3 8 16 25 to 30
• 5% higher QoQ spodumene concentrate production despite 3-4 day power interruption due to bushfires during February
• Materially higher spodumene revenue price delivered significantly higher QoQ sales revenue of A$546M (▲146% vs
2Q22)
• Increase in COGS attributed predominantly to higher unit state government royalty costs (A$241/t) arising from higher
benchmark spodumene prices
1. IGO: 24.99% indirect interest. Production and financial numbers quoted on a 100% basis.
2. 2Q22 is the three months ending 31 December 2021, 3Q22 is the three months ending 31 March 2022, YTD22 is the nine months ending 31 March 2022 and YTD22 Guidance is the pro-rata YTD guidance for the nine months
ending 31 March 2022.
3. 100% attributable Greenbushes production, including both technical grade and chemical grade spodumene concentrate.
4. COGS is IGO’s estimate of cost of goods sold and is inclusive of ore mining costs, processing, general and administrative, selling & marketing, inventory movements and royalty expense.
17Greenbushes1
1.55Mt installed capacity across four processing facilities
Technical Grade Plant (TGP) Chemical Grade Plant (CGP1) Chemical Grade Plant (CGP2) Tailings Retreatment Project (TRP)
Status
Producing Producing Producing Ramp Up
Production
150,000 tpa 600,000 tpa 520,000 tpa 280,000 tpa
Technical Grade Concentrate Chemical-grade lithium concentrate Chemical-grade lithium concentrate Chemical-grade lithium concentrate
(SC6.0) (SC6.0) (SC6.0)
Project life of 5-6 years
Comments
Higher feed grade and improved Construction complete, with
Performing in line with expectations recovery offset production losses due to Considerable improvement in recoveries commissioning and ramp up progressing.
power outage in February Initial production delivered in February
1. IGO:24.99% indirect interest
18Greenbushes1
Additional 1.04Mtpa of installed capacity expected to be built by 2027
Construction of CGP3 proceeding and
expected to be completed in early 2025 at a
remaining capital cost of A$500 - 550M
Significant ongoing investment in
infrastructure to support expansion of
mining and processing operations
CGP4 construction to follow CGP3 with all
key external approvals in place and funding
to be generated internally
1. IGO:24.99% indirect interest
19Kwinana Refinery1
Progressing toward battery grade production
Good progress made towards delivery of battery
grade lithium hydroxide
IGO expects decision to recommence construction
of Train 2 during 1H23 with A$18M early works
budget already committed
3Q22 Financial Results
EBITDA: (A$16.6M)
Commissioning Capex: A$6.9M
1. IGO: 49% non-controlling interest
20Exploration
21Near Nova and Fraser Range
Increased activity with multiple targets to be tested
Chimera remains prospective for large-scale massive
Ni-Cu-Co sulphide accumulations with most of
interpreted extent remaining untested
Expanded program at Chimera to focus on testing EM
conductor and broader intrusive complex
4Q22 Targets:
• Near Nova: Chimera, Elara and Orion
• Fraser Range North: Lignum, Vulpecula & Oaktree
• Fraser Range South: Pike North, Skipjack & E1
22Western Areas Transaction Update Western Areas Cosmos Nickel Project 23
Transaction Update
Agreement to increase Scheme Consideration to A$3.87/share1

 Increased IGO Offer Price recognises additional value
 generated by WSA as a result of higher nickel prices
 since initial transaction was announced                                                                                                                                 Kimberley

 Amended Scheme has been unanimously                                                                                                                 Paterson                            Raptor

 recommended by WSA’s Board of Directors2, and is
                                                                                                                                                                                                   Irindina

                                                                                                                                                                                         Lake Mackay JV
 subject to WSA shareholder and court approval
                                                                                                                                                                      Cosmos (Ni)
                                                                                                                                          Mt Alexander JV

                                                                                                                                                                          Fraser Range             Western Gawler JV
 Transaction rationale and funding structure remains                                                                                                                                                          Copper Coast
                                                                                                                                                                            Nova (Ni-Cu-Co)
 unchanged                                                                                                                      Kwinana (LiOH)
                                                                                                                                                                      Forrestania (Ni)
                                                                                                                                                                                                                   Broken Hill

                                                                                                                              Greenbushes (Li)

 Scheme is expected to complete in June 2022

1.   Refer to IGO ASX Announcement titled, “IGO and Western Areas agree to amend Scheme of Arrangement”, released 11 April 2022.
2.   in the absence of a superior proposal and subject to the independent expert (KPMG) concluding, and continuing to conclude, that the Amended Scheme is in the best interests of WSA shareholders.                            24
Summary
25Summary
FY19 and 4Q19 Highlights
Consistently operational performance enhanced by higher commodity prices
• Managing COVID-19 impact on operations effectively while supporting our people
People & Safety
• Strong employee engagement survey results indicate strength of our unique culture
• Consistent operational performance with metal production tracking to guidance
Nova Operation
• Materially higher nickel price enhancing financial returns and unit costs
• Materially higher spodumene prices delivering stronger TLEA financial results
Lithium Joint Venture • Greenbushes expansion program progressing well, while Kwinana commissioning
makes solid progress
• Scheme consideration increased to reflect additional value generated since transaction
Western Areas Acquisition was announced
• WSA Board remains supportive of revised Scheme; expected to complete in June 2022
• Robust margins generating strong Free Cash Flow
Financial Performance
• A$440M cash on the balance sheet following tax and dividend payment
26You can also read