IHS Markit Securities Finance and Credit Benchmark Research
←
→
Page content transcription
If your browser does not render page correctly, please read the page content below
January 2021

IHS Markit Securities Finance and Credit
Benchmark Research

Confidential | Copyright © 2020 IHS Markit Ltd
Key findings
Introduction
IHS Markit Securities Finance has collaborated with Credit Benchmark to create the industry’s first
solution for integrating counterparty credit risk into securities lending inventory and loan activity. The
combined datasets between IHS Markit Securities Finance and Credit Benchmark provide unique
insights into market sentiment from both securities lending market and consensus credit risk
assessments from a macro to individual stock level.
In this research note, we present factor model performance results by joining the two proprietary
datasets.

                 We find short factor from Securities Finance and Probability of Default based on
                   credit consensus sourced from Credit Benchmark are complementary to each
                   other in portfolio constructions whereby enhanced signals can be achieved in
                    both US and European equity markets. The new combined dataset provides
                 stronger alpha for cheap-to-borrow (CTB) instruments than only using securities
                  finance data fields. We are excited about the new combined offering where the
                Information Ratio (IR) in US instruments for CTB instruments improved from 0.13
                    to 0.51 (304% improvement) and in European instruments from 0.47 to 0.58
                                                  (23% improvement)

Research Premise
Numerous studies including IHS Markit’s own in-house white papers have identified unique insights
that can be gleaned from the securities lending market to create equity short interest signals. In general,
research has demonstrated that strategies that follow informed short sellers by shorting stocks with a
high level of shorting activity and buying stocks with a low level of shorting activity, have historically
outperformed. These long-short strategies offer returns with low correlation to the overall market and
to more traditional value/growth/momentum strategies. Credit data, such as CDS and crowding in
corporate bond borrowing, have been shown to improve equity short interest signals1.
It is also well known that there is a strong positive correlation between short portfolio alpha and the cost
of borrow among common stock selection factors. The higher the alpha from the short basket, the more
costly it is to realize the return. Removing expensive to borrow names from the short basket is likely to
reduce factor performance. On a recent paper done by the Wolfe Research 2, they suggest removing

1
    Equity Short Signals from the Corporate Bond & CDS Market, IHS Markit Securities Finance, May 2017
2New Insights in Short Interest – A Global Perspective: Introducing the Markit Securities Finance Database, Wolfe Research, Luo’s QES
Research, August 2017

IHSMARKIT .COM /SECURITIESFINANCE
the hard to borrow stocks from both the long and short portfolios. On the short side, this leads to a
decline in alpha, whereas on the long side, since these stocks tend to underperform due to over pricing,
they observed a material improvement for most common factors after this adjustment. This way the
losses incurred by excluding the expensive names from short portfolio can be recouped.
In this paper, we adopt a similar strategy by excluding expensive to borrow stocks from both long and
short portfolios constructed based on short interest factors. We then expand to incorporate the
Probability of Default metric sourced from Credit benchmark’s consensus credit risk assessments, to
examine whether this unique set of credit data can enhance alpha in combination with short factors.
Key Factors
• Securities Finance Utilization (Utilization): The value of security borrowed from the lenders relative to the
lendable inventory held in the security. We rank this factor in ascending order as stocks with low Utilization
are expected to have a positive sentiment and stocks with high utilization are expected to have a negative
sentiment. We use Utilization as the short factor in the US.
• Securities Finance Demand Supply Ratio (DSR): The value of securities borrowed relative to the lendable
inventory in the security. We use our proprietary Short Loan Value which strips out non-sentiment related
securities lending transactions, to provide a cleaner proxy for short interest in Europe. We rank this factor
in ascending order as stocks with low DSR are expected to have a positive sentiment and stocks with
high DSR are expected to have positive sentiment.
• Credit Benchmark Credit Consensus Rating Probability of Default 100 Notch score (Prob Def):
Consensus rating as a 100-point scale mapped to its equivalent midpoint probability of default. We rank
this factor in ascending order as issuers with a lower Prob Def are expected to have a positive sentiment
and issuers with a high Prob Def are expected to have a negative sentiment.
Universe and Time Period
We perform back-tests on USA Total Cap and Developed Europe Standard Cap universes, which
contain 3300 and 1350 stocks on average respectively. We source the universes from IHS Markit
Research Signals. The back-test timeframe is from July 2015 to December 2020, which covers
monthly timestamps.
Methodology
To construct the trading strategies, we first create two equally weighted portfolios by selecting the top
and bottom 10% of securities from our US Total Cap universe and top and bottom 20% from our
European universe ranked by our factors in ascending order. We then build multi factor portfolios using
the combination of Securities Finance short factor and Prob Def based on Credit Benchmark
consensus credit ratings.
Effectively we group securities into fractiles, with the highest fractile comprising of securities with
positive sentiment, and the lowest fractile comprising of securities with negative sentiment. We then
examine the return spread between the two fractile groups to judge the individual factor combinations.
IHSMARKIT .COM /SECURITIESFINANCEWe calculate 1 month forward total returns in USD to judge factor performance3. We follow a monthly
rebalance schedule and total returns are equally weighted. Return outliers are removed from the
sample.
A two-business day lag is taken when using Utilization/DSR and a 1-month lag is taken when using
Prob Def to avoid the look-ahead bias in the two datasets. For instance, for end of month portfolio
construction on 30th June 2015, we take a two-business day lagged value for Utilization/DSR and the
Prob Def from 31st May 2015 to account for the reporting lag in the two datasets.
US Total Caps
We test the factors individually and on different combinations with other factors4. The highlights are:
• Both Utilization and Prob Def are negatively related to 1-month forward total returns i.e., stocks
with high Utilization or high Prob Def are associated with negative sentiment and tend to
underperform the following month.
• Utilization is found to be a stronger predictor of future negative returns with an average IC of -
0.039 in comparison to an average IC of -0.023 for Prob Def during the time period Jul 2015 –
Dec 2020.
• It is worth highlighting the decline in the average IC for both the factors after the market rally
that started from April 2020 onwards as the signal reversed for both the factors. Prior to that,
average IC for Utilization was close to -0.05 and for Prob Def, the average IC was -0.045.
• Filtering the universe to Cheap-to-Borrow (CTB) stocks reduces the average IC for Utilization
from -0.039 to -0.019. However, filtering for high Prob Def on CTB stocks allows the Utilization
signal to offset some of the signal degradation from excluding high fee stocks as the average
IC improves from -0.019 to -0.025.
• A strategy that buys stocks with low Utilization and sells stocks with high Utilization offers an
annualized return of 13.9% with an IR of 0.97 and a strategy that buys stocks with low Prob
Def and sells stocks with high Prob Def offers an annualized return of 2.8% with an IR of 0.14
during the time period Jul 2015 – Dec 2020.
• Prior to April 2020, using Utilization offered an IR of 1.94 and Prob Def offered an IR of 0.87.
Strategy returns declined during the market rally as stocks with high Prob Def and high
Utilization significantly outperformed stocks with low Utilization/Prob Def.
• Utilization and Prob Def factors offer diverse returns across years with Utilization performing
better than Prob Def in some years and the latter performing better in other years highlighting
benefits of using the two factors in conjunction with each other.
3 Stock return data is sourced from Factset
4 The full set of results are available on request.
IHSMARKIT .COM /SECURITIESFINANCE• Long-Short portfolios created using Utilization and Prob Def perform positively in Down Market
periods and underperform in Up Market periods. However, Utilization performs better in Up
Markets in comparison to Prob Def whereas Prob Def performs better than Utilization in Down
Markets.
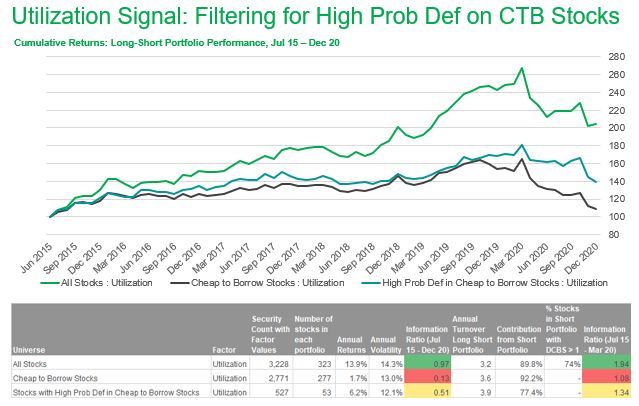
The following chart and table focus on the three trading strategies below:
• All Stocks: Utilization: All the stocks in the universe where Utilization is available.
• Cheap to Borrow Stocks: Utilization: The universe is filtered to cheap-to-borrow stocks i.e.
DCBS = 1 where DCBS is Securities Finance cost of borrowing score, where a score of 1
means cheap to borrow (CTB) stocks. Then we use Utilization as the ranking factor.
• Stocks with High Prob Def in Cheap to Borrow Stocks: Utilization: The universe is filtered
to cheap-to-borrow stocks first and then stocks with Prob Def greater than median Prob Def
are selected. Then we use Utilization as the ranking factor.
Filtering the universe to Cheap-to-Borrow (CTB) stocks reduces the information
content of the Utilization factor as the strategy benefits in terms of the Information
Ratio drops from 0.97 to 0.13. However, further filtering for high Prob Def on CTB
stocks allows for an improvement in IR from 0.13 to 0.51 for the Utilization factor.
Prior to April 2020, filtering for high Prob Def on CTB stocks allowed the
Utilization signal to improve from 1.08 to 1.34 in terms of IR
IHSMARKIT .COM /SECURITIESFINANCEDeveloped Europe Standard Caps
We perform a similar back-test for European equities. As mentioned before, we use DSR instead of
Utilization to remove non-sentiment related securities lending transactions which are more prevalent in
Europe. The key findings are:
• Both DSR and Prob Def are negatively related to 1-month forward total returns i.e., stocks with
high DSR or high Prob Def tend to underperform the following month in comparison to stocks
with low DSR or low Prob Def.
• Combining the two factors in portfolio construction provides a better signal than using DSR or
Prob Def independently. The combined signal has a higher Avg IC/Stdev IC ratio (0.32) as
compared to Prob Def (0.18) and DSR (0.28) during the time period Jul 2015 – Dec 2020.
• It is worth highlighting the decline in the average IC for both the factors and for the combined
factor after the market rally that started from April 2020 onwards as the signal reversed for both
the factors.
• A strategy that buys stocks with low DSR and sells stocks with high DSR offers an annualized
return of 4.6% with an IR of 0.83 and a strategy that buys stocks with low Prob Def and sells
stocks with high Prob Def offers an annualized return of 5.1% with an IR of 0.55 during the
time period Jul 2015 – Dec 2020.
• Prior to April 2020, using DSR offered an IR of 1.16 and Prob Def offered an IR of 0.98. The
combined signal offered an IR of 1.36 as combining the two factors allowed for better stock
selection in portfolio construction in comparison to using them on their own.
• Using a combination of the two factors on CTB stocks gives a more consistent performance
over the years as compared to the individual factor performance.
• Long-Short portfolios created using DSR and Prob Def perform positively in Down Market
periods and underperform in Up Market periods in general. However, DSR performs better in
Up Markets in comparison to Prob Def whereas Prob Def performs better than DSR in Down
Markets.
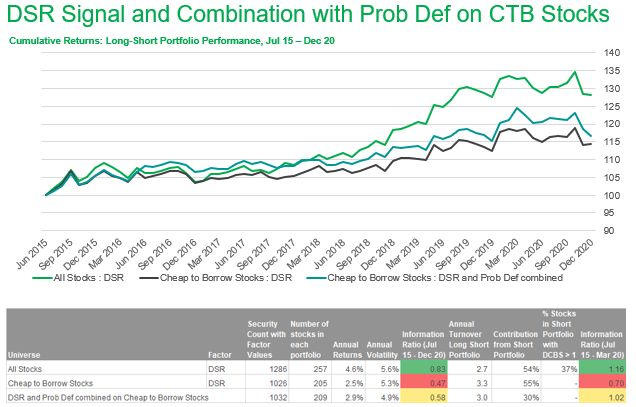
Again, we draw your attention to three trading strategies below:
• All Stocks: DSR: All the stocks in the universe where DSR is available.
• Cheap to Borrow Stocks: DSR: The universe is filtered to cheap-to-borrow stocks i.e. DCBS
= 1 where a score of 1 means cheap to borrow stocks. Then we use DSR as the ranking factor.
• DSR and Prob Def combined on Cheap to Borrow Stocks: Percentile ranks are first
calculated on CTB stocks using DSR and Prob Def separately. Then an equally weighted
combined factor rank is created. When only one factor is available, that factor is given a 100%
weighting.
Using a combination of DSR and Prob Def in Cheap to Borrow (CTB) stocks
improves the Long-Short portfolio performance with an IR of 0.58 in comparison
to using DSR (IR 0.47) and Prob Def (IR 0.30) on their own on CTB stocks. The
combined signal on CTB stocks prior to April 2020 offered an IR of 1.02 in
comparison to an IR of 0.7 offered by the factors independently
IHSMARKIT .COM /SECURITIESFINANCEConclusions It is well known that equities with crowded short positions underperform those with relatively little crowding. However, equities with heavy borrowing are likely to have high borrow fee, which degrades real-world returns, i.e. filtering to equities which are cheap to borrow lowers portfolio return based on short factors. Credit data, such as CDS and crowding in corporate bond borrowing, have been shown to improve equity short interest signals. In this research note we incorporated forward-looking consensus credit risk assessments from Credit Benchmark (CB), who produces independent rankings based on surveys of credit managers. As expected, for both US and Europe, we find stocks with relatively high CB Probability of Default metric underperform those with relatively low Probability of Default. In US, filtering for high Probability of Default on cheap to borrow stocks allows the Utilization signal to substantially offset the degradation from excluding expensive equities. In Europe, a combined factor using DSR and Probability of Default on cheap to borrow equities gives a better signal than using DSR or Probability of Default on Low Fee equities independently. We also find short factors perform better in up markets in comparison whereas Probability of Default performs better than Utilization in down markets. Probability of Default offers a lower turnover strategy, but short factor has a higher coverage on stocks. IHSMARKIT .COM /SECURITIESFINANCE
IHS Markit Securities Finance delivers comprehensive data on global equity and fixed income
lending flow to support investment, asset allocation and risk management decisions. With more than
$30 trillion of global securities in the lending programmes of over 20,000 institutional funds, our
securities finance dataset provides insight into stock supply and demand as well as availability. Along
with 3 million intraday transactions dating back more than 15 years, we deliver access to crucial
market signals to help refine investment decisions and manage trading risks. Data is sourced directly
from leading industry participants, such as prime brokers, custodians, asset managers and hedge
funds.
Credit Benchmark is the world’s only source of forward-looking consensus credit risk assessments
on a global range of corporations, financial institutions, sovereigns and other funds. Credit
Benchmark collect over 750,000 internal credit views from more than 40 financial institutions/30,000
credit analysts, providing a new unique measure of risk. Monthly entity-level consensus credit ratings
(CBRs) are provided on over 46,000 corporates, financials, funds and sovereigns and over 700
aggregates. Over 75% of the entities with CBRs are unrated by the large credit rating agencies.
CBRs are less volatile than market-derived signals and reflect real-world creditworthiness. Range,
skew, dispersion, trend and opinion change metrics are provided for additional insight.

IHS Markit Customer Care
CustomerCare@ihsmarkit.com

AMERICAS : 1 800 IHS CARE (+1 800 447 2273)

EUROPE , M IDDLE EAST , AND A FRICA : +44 (0) 1344 328 300

ASIA AND THE P ACIFIC RIM: +604 291 360

Disclaimer
The content in this report is strictly private and confidential. Any unauthorized use, disclosure,
reproduction or dissemination, whether in full or in part, by any means, without the prior written
permission of IHS Markit is strictly prohibited

IHSMARKIT .COM /SECURITIESFINANCE
You can also read