Imaging atelectrauma in Ventilator Induced Lung Injury using 4D X ray microscopy - Nature
←
→
Page content transcription
If your browser does not render page correctly, please read the page content below
www.nature.com/scientificreports
OPEN Imaging atelectrauma
in Ventilator‑Induced Lung Injury
using 4D X‑ray microscopy
Luca Fardin1,2,7, Ludovic Broche1, Goran Lovric3,4, Alberto Mittone5, Olivier Stephanov6,
Anders Larsson2, Alberto Bravin1,7 & Sam Bayat7,8*
Mechanical ventilation can damage the lungs, a condition called Ventilator-Induced Lung Injury (VILI).
However, the mechanisms leading to VILI at the microscopic scale remain poorly understood. Here we
investigated the within-tidal dynamics of cyclic recruitment/derecruitment (R/D) using synchrotron
radiation phase-contrast imaging (PCI), and the relation between R/D and cell infiltration, in a model
of Acute Respiratory Distress Syndrome in 6 anaesthetized and mechanically ventilated New-Zealand
White rabbits. Dynamic PCI was performed at 22.6 µm voxel size, under protective mechanical
ventilation [tidal volume: 6 ml/kg; positive end-expiratory pressure (PEEP): 5 cmH2O]. Videos and
quantitative maps of within-tidal R/D showed that injury propagated outwards from non-aerated
regions towards adjacent regions where cyclic R/D was present. R/D of peripheral airspaces was both
pressure and time-dependent, occurring throughout the respiratory cycle with significant scatter of
opening/closing pressures. There was a significant association between R/D and regional lung cellular
infiltration (p = 0.04) suggesting that tidal R/D of the lung parenchyma may contribute to regional
lung inflammation or capillary-alveolar barrier dysfunction and to the progression of lung injury. PEEP
may not fully mitigate this phenomenon even at high levels. Ventilation strategies utilizing the time-
dependence of R/D may be helpful in reducing R/D and associated injury.
Mechanical ventilation is an essential means of life support for patients with acute respiratory failure. It is nec-
essary in the treatment of patients with acute respiratory distress syndrome (ARDS)1, a pathologic condition
characterized by severe lung inflammation, diffuse alveolar damage and infiltration, increased microvascular
permeability edema, surfactant dysfunction and widespread patchy a telectasis2. The overall mortality of ARDS
remains high: between 35 and 45%3, in part because despite its vital role in improving oxygenation, mechanical
ventilation can damage the lungs, a condition referred to as Ventilator-Induced Lung Injury (VILI). Identify-
ing ventilation strategies that provide adequate gas exchange while minimizing the progression of lung injury
remains an urgent and open question. However, the mechanisms leading to VILI at the microscopic scale remain
poorly understood, and better knowledge of these mechanisms is of fundamental importance for addressing
this question.
It is generally agreed that the main mechanism of worsening pre-existing lung injury under assisted ventila-
tion is the mechanical strain imposed on the lung tissue, which can have multiple o rigins4. Overdistension due
to high regional tidal volumes can induce mechanical injury to the lung, through exaggerated stress and strain.
Evidence to support this hypothesis is mainly based on clinical studies showing the improvement in the mortal-
ity of ARDS patients by reducing tidal v olume5. The link between tidal stretch of the lung tissue and regional
inflammatory responses has also been demonstrated in experimental studies6.
Cyclic reopening (recruitment) of lung regions that become re-collapsed (derecruited) upon expiration,
a phenomenon thought to induce “atelectrauma”, can also contribute to the expansion of lung injury, due to
high mechanical stresses normal to the epithelial surface of the airways as they r eopen7. High stress or strain is
also produced at the interface between adjacent collapsed and aerated alveoli, especially within poorly aerated
parenchyma leading to increased local stress or ‘stress concentration’8.
1
European Synchrotron Radiation Facility, Grenoble, France. 2Hedenstierna Laboratory, Department of
Surgical Sciences, Uppsala University, Uppsala, Sweden. 3Center for Biomedical Imaging, EPFL, Lausanne,
Switzerland. 4Swiss Light Source, Paul Scherrer Institute, Villigen, Switzerland. 5CELLS - ALBA Synchrotron Light
Source, Barcelona, Spain. 6Department of Pathology, Grenoble University Hospital, Grenoble, France. 7Synchrotron
Radiation for Biomedicine Laboratory (STROBE, INSERM UA7), Grenoble, France. 8Department of Pulmonology
and Physiology, Grenoble University Hospital, Bd. Du Maquis du Grésivaudan, 38700 La Tronche, France. *email:
sbayat@chu‑grenoble.fr
Scientific Reports | (2021) 11:4236 | https://doi.org/10.1038/s41598-020-77300-x 1
Vol.:(0123456789)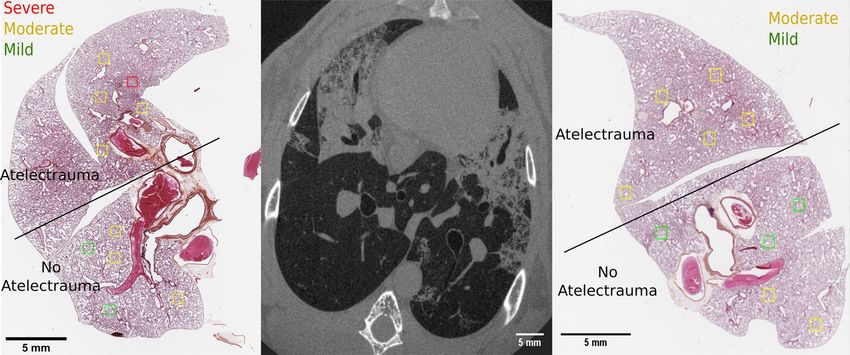
www.nature.com/scientificreports/
Positive end-expiratory pressure (PEEP) is usually applied in ARDS to improve oxygenation by prevent-
ing end-expiratory lung collapse. It should theoretically prevent atelectrauma and reduce the inhomogeneities
responsible for stress concentration. Three large trials, investigating the effects of PEEP on mortality of ARDS
patients in the intensive care setting have failed however in showing an improvement in overall s urvival9–11,
and a decrease in mortality was observed only in a sub-category of severe ARDS p atients12. The importance of
atelectrauma in the development of VILI is therefore still unclear.
Here, we investigated the pressure–time dependency of atelectrauma during protective ventilation and the
regional relation between atelectrauma and cell infiltration in an early-stage rabbit model of VILI. We used
4D (3D + time) in vivo phase-contrast microscopy with a 22.6 × 22.6 × 22.6 μm3 voxel size and monochromatic
X-rays produced with a synchrotron radiation (SR) source. Synchrotron sources deliver radiation that is orders
of magnitude more intense than conventional X-ray sources, which is essential for high temporal and spatial
resolution imaging. 4D X-ray phase-contrast microscopy combined with phase retrieval algorithms13, allows
improving the contrast-to-noise ratio of poor X-ray attenuating media, such as the lung tissue14. A novel image
acquisition method was developed in order to resolve the lung parenchymal motion induced by both respiration
and cardiac activity, a major challenge at this high spatial resolution.
Results
Lung injury. The PaO2/FIO2 ratio was 461 ± 52; 78 ± 27 (p < 0.001) and 107 ± 119 (p < 0.001) at baseline, after
injury induction and at the end of the experiment, respectively (Supplementary Table S1). An increase in the
average PaO2/FIO2 at the end of the experiment was due to one animal, which met the conditions for VILI after
injury induction but recovered during the following imaging session.
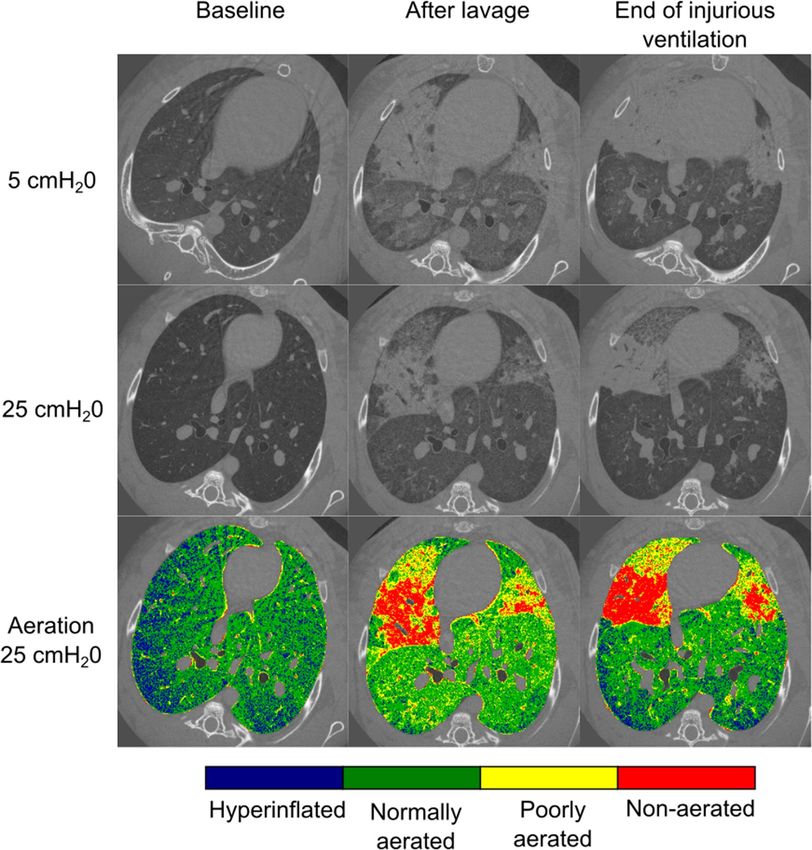
In Fig. 1, static CT images acquired upon expiration (5 cmH2O) and inspiration (25 cmH2O) are shown
in a representative animal. These images were acquired at baseline and the end of the two phases of our lung
injury model: lavage-induced surfactant depletion followed by injurious ventilation. A map of lung aeration was
computed based on X-ray attenuation at each pressure (5, 25 cmH2O) and experimental condition: baseline;
lavage; injurious ventilation. Immediately after lavage-induced surfactant depletion, patchy areas of high X-ray
attenuation due to poorly-aerated and non-aerated lung regions appeared. At the end of the injurious ventilation,
repeated static images showed distinct changes compared to post-lavage.
The lung tissue was divided into non-aerated, poorly-aerated, normally-aerated and hyperinflated regions.
The average fractions of each lung aeration category are shown in Fig. 2 as a function of experimental condition
and pressure. At baseline, increasing airway pressure reduced poor aeration, and as expected, increased hyper-
inflation, in line with our previous observations in this m odel15. After lavage, there was a significant increase in
poorly-aerated and non-aerated regions, which were recruited at 25 c mH2O. Following injurious ventilation,
the area of poorly-aerated regions decreased, while the area of normally aerated zones increased in proportion,
suggesting that this may have been due to active epithelial fluid resorption. On the other hand, closed regions
persisted or worsened and tended to be less recruited, suggesting remaining fluid-filled or “sticky” atelectatic
regions. The latter are apparent in particular upon inspiration. Finally, hyper-inflated regions at 25 cmH2O
significantly increased in the injured condition, which may have been due to a reduced compliance and less
recruitment of poorly- and non-aerated regions, or the so-called “baby lung” effect.
A spatial analysis of the pattern of injury progression during injurious ventilation is shown in Fig. 3. This
figure represents a map of the non-aerated regions after injurious ventilation, for all the rabbits and at the two
pressures. The airspaces, which were non-aerated already after saline lavage, are highlighted in red. The co-
localization of atelectatic regions between saline lavage and injury at low pressure, suggests that injury developed
peripheral to lung regions which were atelectatic immediately after the saline lavage. The recruitability of these
regions, visible at high pressure, suggests atelectrauma as a mechanism of injury progression.
Dynamics of atelectrauma. A 3D animation (4D reconstruction) of the whole respiratory cycle was
obtained in all animals after injurious ventilation. The animation of a 2D slice in one representative animal
is included in the Supplemental Digital Content (Supplementary Video S1). A dynamic map of within-tidal
recruitment (green) and derecruitment (red) of airspaces was obtained for each 4D image reconstruction, by
cross-correlation of corresponding voxels at consecutive time frames. As an example, an animation showing a
dynamic recruitment/derecruitment (R/D) map is provided in the Supplemental Digital Content (Supplemen-
tary Video S2), superimposed to the corresponding animation of the respiratory cycle. Single 2D frames from
the reconstructed 4D images, respectively at end-expiration (5 cmH2O) and end-inspiration (25 c mH2O), are
shown in Fig. 4a,b in one representative animal (Rabbit-1). These images represent a dynamically derecruited
and a recruited state, respectively. A snapshot of a R/D dynamic map at end-inspiration is shown in Fig. 4c. It
represents a 2D projection of the R/D events identified by the algorithm, at this time point. Either one or both
lungs were analyzed for each animal: the right lung had to be discarded in Rabbit-1 and Rabbit-5 due to the pres-
ence of the diaphragm and of the stomach in the field of view, and in Rabbit-4 due to motion artefacts caused by
a mechanical instability of the tomographic setup.
In Fig. 5, the R/D fractions are shown as a function of time for each 4D reconstruction, superimposed to the
corresponding tracheal pressure–time curves. There was a notable disparity in airway opening and closing times
and pressures within and in between rabbits. Recruitment occurred both at low pressures at the beginning of
inspiration (Rabbit-2,-4,-5) and at high pressures at the end of inspiration (Rabbit-1,-3,-5). Similarly derecruit-
ment is identified both at high pressures at the beginning of inspiration (Rabbit-1,-3,-4,-5) and at low pressures
at the end of expiration (Rabbit-1,-2,-5). In general, a coexistence of recruitment and derecruitment is identified
all along the respiratory curve, in these dynamic images. The control rabbit showed only small fluctuations in
both the recruitment and derecruitment curves with values close to the baseline of the injured animals.
Scientific Reports | (2021) 11:4236 | https://doi.org/10.1038/s41598-020-77300-x 2
Vol:.(1234567890)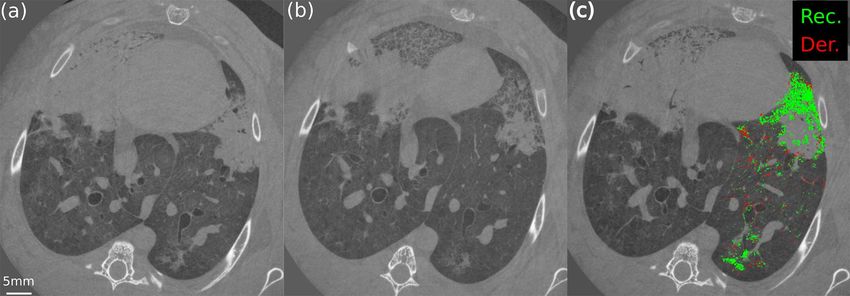
www.nature.com/scientificreports/
Figure 1. CT section of Rabbit-1 acquired in apnea at baseline, immediately after the lavage, and at the end of
injurious ventilation, at two different tracheal pressures (5 cmH2O and 25 cmH2O). Note that the experiments
were performed with the animals in upright position. Aeration levels are shown for each time step at 25
cmH2O. Non-aerated tissue (red) corresponds to the interval (HU ≥ − 100); poorly aerated tissue (yellow) to
(− 500 ≤ HU < − 100); normally aerated tissue (green) to (− 900 ≤ HU < − 500 HU) and hyperinflated tissue
(blue) to (HU < − 900 HU). Atelectatic regions develop around lung units which became atelectatic immediately
after the lavage.
Comparison of atelectrauma and histological analysis. There was a significant relation between the
R/D visible in the in vivo CT images and the tissue damage identified by pathology (p = 0.007). Moreover, we
observed a significant difference in the linear cell densities within versus outside of lung regions with atelec-
trauma (p = 0.04). A higher mean value was observed in regions where atelectrauma occurred, showing neutro-
phil and macrophage infiltrations (Fig. 6).
Discussion
The goal of this study was to characterize both the spatial distribution and the dynamic behaviour of atelectrauma
using in vivo 4D phase-contrast microscopy at subacinar spatial resolution, in order to better understand whether
and how this phenomenon contributes to the development of lung tissue damage and the extension of lung
parenchymal injury. Our main findings were that: (1) in the presence of a mechanically inhomogeneous lung due
to surfactant depletion, injury propagated outwards from non-aerated lung regions to adjacent lung submitted
to atelectrauma; (2) recruitment and derecruitment of peripheral airspaces is not only a pressure-dependent,
Scientific Reports | (2021) 11:4236 | https://doi.org/10.1038/s41598-020-77300-x 3
Vol.:(0123456789)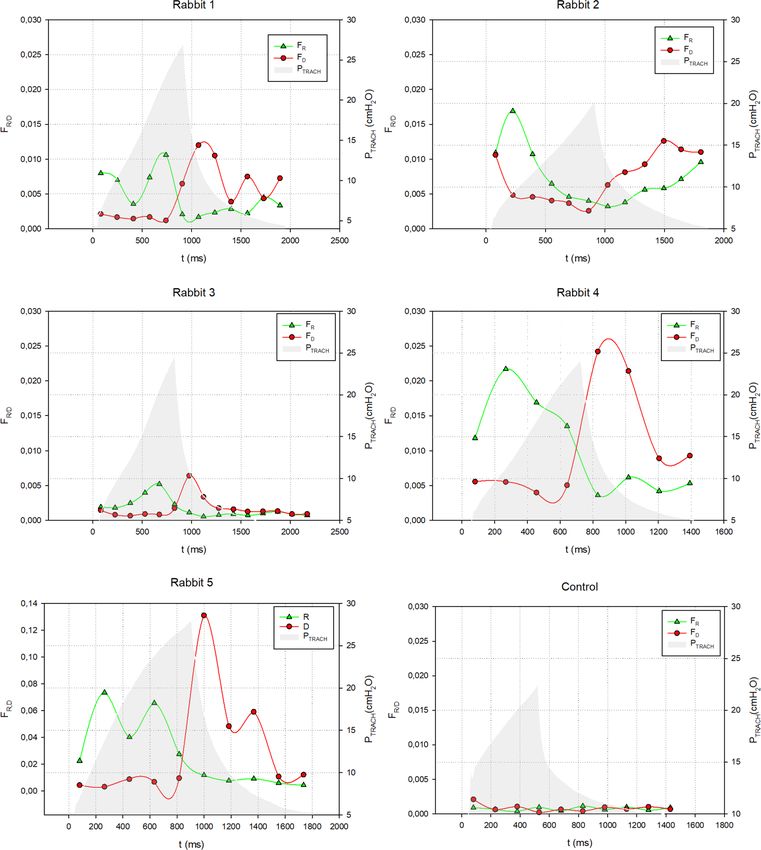
www.nature.com/scientificreports/
Figure 2. Average fraction of closed, poorly aerated, normally aerated and hyperinflated lung regions as a
function of time and pressure at baseline, after whole lung lavage, and at the end of the injurious ventilation
(n = 4). *p < 0.05 versus PEEP5 within experimental condition; †p < 0.05 versus baseline within PEEP (lavage);
#p < 0.05 versus baseline within PEEP (injury); §p < 0.05 vs lavage within PEEP.
Figure 3. Maps of non-aerated lung regions after injurious ventilation. The maps refer to the static CT images
acquired during expiration (5 cmH2O, upper panel) and inspiration (25 cmH2O, lower panel). White: non
aerated regions after injurious ventilation; Red: non aerated regions after injurious ventilation which were
already present after saline lavage. A spatial co-localization between non-aerated regions before and after
injurious ventilation is visible at a pressure of 5 c mH2O. Recruitment of non-aerated regions upon inspiration is
visible after saline lavage (lower panel).
but also a dynamic, time-dependent phenomenon occurring throughout the respiratory cycle; (3) there was a
co-localization of atelectrauma and lung cellular infiltration, a hallmark of inflammation and capillary-alveolar
barrier dysfunction.
The pattern of injury progression in our model of VILI (Figs. 1 and 3) is in agreement with previous obser-
vations of VILI complicating pre-existing lung injury. Cereda et al. found that injury progressed concentrically
in mechanically-ventilated rats with HCl-induced acute lung injury, meaning that secondary VILI originates
adjacent to the primary lesions, due to the local diffuse intermingling of aerated and collapsed tissue16. They sug-
gested that local discontinuities in aeration in poorly-aerated regions concentric to non-aerated zones of “sticky”
atelectasis or edema, may lead to stress concentration in these zones upon inspiration. Using K-edge subtraction
imaging of Xe gas, we previously found faster Xe wash-in in such poorly-aerated regions in a similar model, which
may have been caused by reciprocal dilation of ventilated airspaces near collapsed or fluid-filled alveoli15. The
significance of these findings is that alveolar collapse and edema result in a heterogeneous pattern of inflation
which leads to concentration of stress within the aerated alveoli adjacent to closed ones, a phenomenon referred
to as stress risers17. This is further demonstrated by the induction of atelectasis by bronchial blockage in rats with
otherwise normal lungs, where 3 h of mechanical ventilation induced significant alveolar damage, edema and
neutrophilic infiltration in the peri-atelectatic r egions18. Together, these data suggest a significant role of stress
concentration in regions adjacent to non-recruiting alveolar collapse in the propagation of lung injury and VILI.
Scientific Reports | (2021) 11:4236 | https://doi.org/10.1038/s41598-020-77300-x 4
Vol:.(1234567890)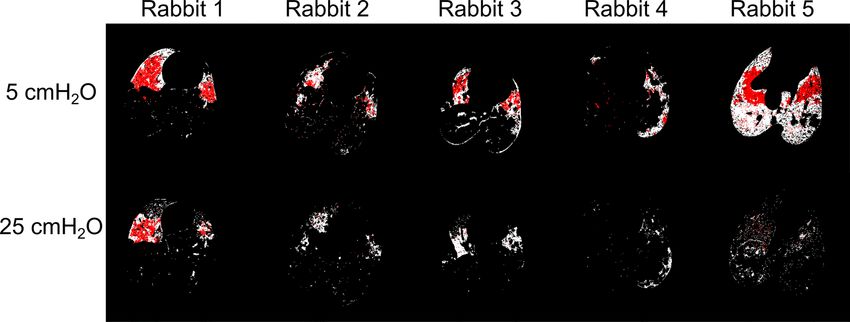
www.nature.com/scientificreports/
Figure 4. In vivo dynamic CT of Rabbit-1 at minimum pressure at the beginning of inspiration (5 c mH2O)
(a) and at maximum pressure at the end of the inspiration (25 c mH2O ) (b). In (c) a 2D projection of the
recruitment (Rec., green) and derecruitment (Der., red) as identified by the algorithm in the left lung,
superimposed to one CT slice as a reference. (c) represents the time instant, during the respiratory cycle, where
maximum recruitment was observed.
Our findings further extend these observations by revealing the pattern and dynamics of atelectrauma at
a sub-acinar spatial resolution. Data on the dynamics of atelectrauma or tidal R/D are scarce, and to our best
knowledge, this is the first study of these phenomena at such spatial and temporal resolution in intact lung.
Spatial analysis of our images demonstrated that regions adjacent to the initial injury are highly subjected to
cyclic R/D (Fig. 3). This phenomenon leads to a large dynamic alveolar strain, which is thought to be a primary
mechanism of VILI19–22. Moreover, we found significant scattering in the pressure and time at which airspaces
open and close, both within and in-between animals (Fig. 5), while the 4D CT images were acquired under
protective ventilation conditions, with low tidal volumes and a PEEP of 5 cmH2O.
Derecruitment of airspaces was observed at almost all pressures, including at values close to the higher end
of the driving pressure, implying that even moderate to high PEEP levels may not completely prevent atelec-
trauma. This finding extends previous studies showing that recruitment in early lung injury occurs along the
entire inspiratory limb of the PV c urve23–31. Using dynamic CT at lower spatial resolution in a whole-lung lavage
model of lung injury in pig25, David et al. showed that the volume of cyclic lung R/D was independent of the
level of PEEP. Also, we previously found that cyclic R/D was reduced but still occurred despite PEEP levels up to
12 cmH2O32. In this study, using a resolution higher than in previous work33, we show that recruitment of col-
lapsed or edematous airspaces does not lead to fully open airspaces, but rather a fine mosaic of micro-unaerated
lung regions (Fig. 1). This suggests that although PEEP may increase the overall lung aeration, new poorly-
aerated inhomogeneous lung regions may be created15, exposing these zones to tidal R/D and consequent stress
concentration33. Beyond the adverse hemodynamic effects of high PEEP, this mechanism may be involved in the
lack of improved survival in randomized clinical trials comparing higher versus lower PEEP levels in patients
with ARDS10,11,34 with the exception of a subgroup of more severe lung injury12.
An important finding of this study is the coexistence of both recruitment and derecruitment during the whole
respiratory cycle. Although counter-intuitive, one explanation of this finding is the strong time-dependence of
cyclic R/D, due to the viscoelastic nature of alveolar opening and c ollapse35. In other words, recruitable alveoli
open once a critical opening pressure is exceeded, however with a time lag, which in turn depends on the tissue
micromechanical properties and airway liquid surface tension35. Moreover, the temporal pattern of recruitment
is not continuous but rather a succession of “avalanches”36. Importantly, mechanical interdependence of neigh-
bouring alveoli dynamically modifies the critical airway opening and closing pressures of the a irspaces32. Because
of the large scattering of the time constants and pressures of opening and closure in injured lung, some airspaces
may recruit while airway pressures are in the descendent phase and vice versa. Evidence for the time-dependence
of lung recruitment has previously been demonstrated in lavage injured pig lungs where the time-constant of
recruitment ranged from 8 to 16.8 s37. This observation is also in line with our previous findings using static
phase-contrast CT as well as in silico modelling of R/D p henomena32,38,39.
There is little data in the literature linking the regional dynamic mechanical behaviour of the lung with local
cellular infiltration, reflecting tissue injury through inflammation or capillary-alveolar barrier d ysfunction40–42.
Indeed, quantification of inflammation is usually performed without data on spatial distribution, in the bron-
choalveolar lavage fluid by counting neutrophils, measuring cytokine levels, or myeloperoxidase activity43. In
our study, the regional histological analysis showed that, atelectrauma at the subacinar length scale is associated
with increased inflammatory cell infiltration (Fig. 6), a hallmark of i nflammation44 and capillary-alveolar barrier
dysfunction, in this model of VILI. Recently, Yen et al. compared regional cytokine expression and specific tidal
volume using 4D-CT in endotoxin-induced lung injury in mice45. Although there was no significant associa-
tion between regional cytokine expression and specific tidal volume, IL-6 expression was increased in regions
with a smaller end-expiratory volume, which could indicate a role of poor regional aeration. However, R/D or
regional parenchymal strain were not assessed in that study. Four-D microscopy, coupled to histological analysis,
Scientific Reports | (2021) 11:4236 | https://doi.org/10.1038/s41598-020-77300-x 5
Vol.:(0123456789)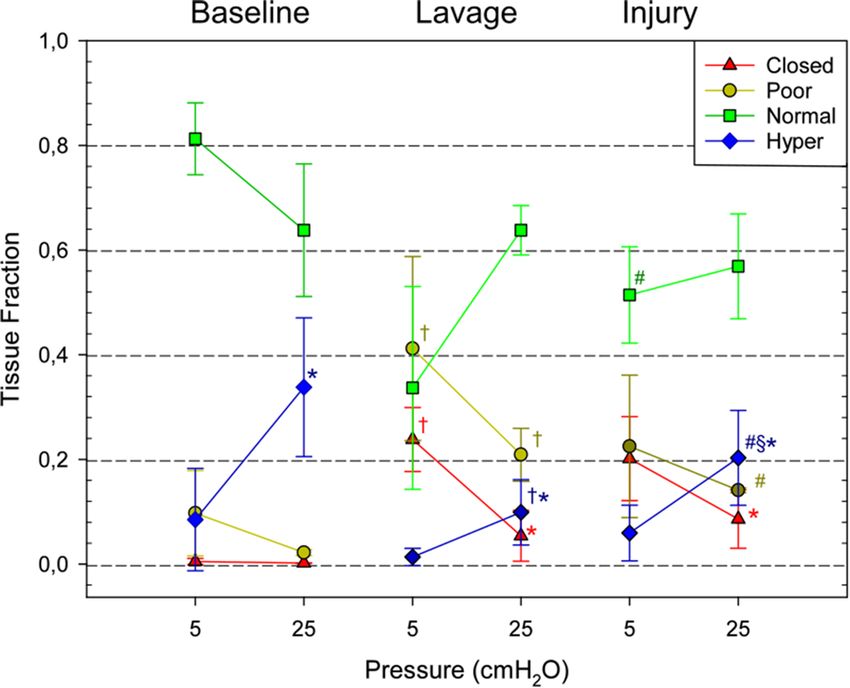
www.nature.com/scientificreports/
Figure 5. Graphs representing the recruitment ( FR) and derecruitment ( FD) fraction as a function of time for
all the rabbits. The pressure–time curve is shown as a reference. Rabbit-5, having a different injury model, is
represented as last graph, with a different scale for the recruitment and derecruitment fraction.
did however allow spatial correlation between lung micromechanics and a biological hallmark of VILI in the
present study.
Study limitations. This study had several limitations. We were able to study only one PEEP level. We can
therefore not make definitive conclusions on how PEEP would modify the progression of injury due to atelec-
trauma. However, the within-tidal dynamics of atelectrauma did allow us to assess opening and closing of air-
spaces as a function of pressure as well as time, therefore our hypothesis is based on data. A second limitation
is that the animal was imaged in upright position, due to the horizontal geometry of the radiation beam, a
Scientific Reports | (2021) 11:4236 | https://doi.org/10.1038/s41598-020-77300-x 6
Vol:.(1234567890)www.nature.com/scientificreports/
Figure 6. Cell counts per unit tissue length, comparing ROIs with (yes) and without (no) atelectrauma. Cell
counts were greater in atelectatic regions with p = 0.04 following the Wilcoxon rank-sum test.
constraint intrinsic to our imaging setup. This means that there is no gravitational gradient within our images,
and that there is no superimposed pressure on the dorsal lung regions. We know from previous studies that this
position slightly but significantly improves the respiratory mechanics in rabbit46. Image analysis was based on
structural correlation through image registration. As any image registration-based approach is prone to artefact,
particularly at the interface of larger vessels and airways, as well as at the outer boundaries of the lung. Succes-
sive filtering and morphological operations were performed to remove artefacts originating from the registration
procedure. A one-to-one pixel correspondence between opening and closing airspaces within the images and
histologic slides is not feasible. However, care was taken to identify anatomical landmarks such as airway or
vascular bifurcations in order to ensure the best possible match between ROI’s.
Conclusions
Using in vivo 4D phase-contrast microscopy at sub-acinar spatial resolution, we found that in the presence of a
mechanically inhomogeneous lung due to surfactant depletion, injury propagates outwards from non-aerated
lung regions to adjacent lung submitted to atelectrauma. Recruitment and derecruitment of peripheral airspaces
is not only a pressure-dependent, but also a time-dependent phenomenon occurring throughout the respira-
tory cycle. Moreover, there was an association between R/D and regional lung cellular infiltration, a hallmark
of inflammation and capillary-alveolar membrane dysfunction. Our data suggest that even higher PEEP levels
may not fully mitigate R/D phenomena in the inured lung. These data also suggest that ventilation strategies
aiming at reducing the time during which respiratory pressure is lowered during expiration may help reducing
R/D phenomena.
Methods
Experimental setup. The experiments were performed at the biomedical beamline (ID17) of the Euro-
pean Synchrotron Radiation Facility (ESRF), Grenoble, France. A description of the beamline can be found in
Elleaume et al.47. Briefly, the X ray produced by one of the two multipole wigglers were monochromatized by a
double bent Laue Si(111) m onochromator47,48, placed ~ 140 m from the source, selecting an energy of 52 keV.
A sample to detector distance of approximately 1.5 m was set to take advantage of propagation-based phase
contrast imaging13. X-rays were converted to visible light with a 50 µm thick Gadox scintillator and detected by
a PCO Edge 5.5 camera (PCO AG, Kelheim, Germany)49 coupled to optics giving a measured effective pixel size
of approximately 22.6 µm. The field of view was reduced to 2560 × 200 pixels, corresponding to 57.9 × 4.5 m m2
(horizontal × vertical, respectively). Data were transferred and saved in the ESRF central storage server, through
a 10 Gb/s network. The transfer and saving speed determined an upper limit to the frame rate achievable, equal
in this experiment to 100 fps with the aforementioned field of view.
Animal preparation. The care of animals and the experimental procedures were in accordance with the
Directive 2010/63/EU of the European Parliament on the protection of animals used for scientific purposes and
were approved by the Ethical committee #113 (Ethax) under the authorization number 2015091517388915. The
study was performed on six male New Zealand White Rabbits (Wt: 2.71 ± 0.15 kg); five with induced VILI and
one control. Anesthesia was induced by intramuscular injection of Ketamine (10 to 15 mg/kg) and Xylazine (3
Scientific Reports | (2021) 11:4236 | https://doi.org/10.1038/s41598-020-77300-x 7
Vol.:(0123456789)www.nature.com/scientificreports/
to 6 mg/kg). A tracheostomy was performed with insertion of a tightly secured 3.5-F plastic catheter (Portex,
Smiths Medical, Minneapolis, Minnesota, USA). A 24-G catheter (Venflon, BD, Franklin Lakes, New Jersey,
USA) was placed on the central ear artery, to monitor blood pressure. After surgery the animal was immobilized
in the vertical position in a custom-made plastic holder and placed in the experimental hutch for imaging.
Anesthesia was maintained during the duration of the experiment with IV infusion of Ketamine (80 mg/kg/h)
(Ketamine 1000, Virbac, France) and Xylazine (8 mg/kg/h) (Paxman, Virbach, France). After verifying adequate
depth of anesthesia, muscle relaxation was induced by Atracurium infusion (0.6 mg/kg/h) to avoid motion
and suppress spontaneous breathing. Mechanical ventilation was administered using a custom-made system as
described previously50,51 (Supplementary Fig. S1).
The electrocardiogram (ECG), tracheal pressure ( PTRACH), tracheal flow and arterial pressure were continu-
ously recorded using a Powerlab 16/35 data acquisition device (DAQ, Adinstruments, Dunedin, New Zealand).
The signals were sampled at 10 kHz. Blood gas analysis was performed using the i-STAT System analyzer (Abbot
Point of Care Inc., Princeton, NJ USA).
4D microscopy acquisition protocol. The motion of the lung parenchyma is induced by the combined
action of heart contraction and mechanical ventilation, two asynchronous sources of motion. In order to avoid
motion artefact in the reconstructed images, mechanical ventilation and the heartbeat were synchronized (Sup-
plementary Fig. S2), by triggering the respiratory cycle with the R peaks of the ECG. The R waves of the ECG,
acquired by the Powerlab, were detected using the Labchart software (ADInstruments, Dunedin, New Zealand),
with a thresholding algorithm. When an R wave was detected a square wave was generated, with user defined
duration and duty cycle. The square wave was transmitted via a TTL signal generated by the Powerlab to the
electromagnetic valve in the expiratory branch of the mechanical ventilator, controlling its status (closed; open)
with a preset inspiration/expiration time. The ECG polling was disabled for the whole duration of the square
wave. When the square wave ended, a new polling on the ECG signal began. The following respiratory cycle
was started when the next R peak was detected. The average period of the cardiac cycle was on the order of
300–350 ms, which was too short to obtain a sufficient ventilation: the duration of the square wave included
therefore 4 to 5 cardiac cycles. When this synchronization protocol was applied, the mechanical ventilator was
adapted to allow for the control of the expiratory valve with the Powerlab. The ventilator was switched back to its
standard configuration after each synchronized scan.
When the heart rate is stable, it can be assumed that the motion of the lung parenchyma is periodic: the
phase of the motion is fully determined by the ECG through two parameters (Supplementary Fig. S2): the
interval from the jth R peak (Φj = Δtj) and the j index itself, denoting which of the n-heart pulsations included
in the respiratory cycle is considered. Under these assumptions, a retrospective gated acquisition protocol was
adopted: image projections were acquired at a constant frame rate and retrospectively sorted to reconstruct one
CT for each phase of the parenchymal motion.
A complete CT was acquired during a single slow 2π rotation of the sample, using the half acquisition tech-
nique. In parallel beam geometry (which is almost perfectly satisfied by using synchrotron radiation: horizontal
divergence: < 0.5 mrad), it allows to almost double the field of view of the camera for large samples by moving
etector52.
the axis of rotation towards the edge of the d
Experimental protocol. At baseline, the animals were ventilated with a protective ventilation strategy,
with: VT = 5–6 ml/kg, FiO2 = 0.5; PEEP = 5 cmH2O. VILI was induced through surfactant depletion by 4 whole-
lung saline lavages (40 mL each) followed by injurious ventilation, with: F iO2 = 1; PEEP = 0 cmH2O and a peak
inspiratory pressure (PMAX) = 30 cmH2O. The development of injury was monitored at regular intervals of 30 min,
through blood gas analysis performed on PEEP 5 cmH2O, and through static chest tomography performed in
apnea at PEEP 5 c mH2O and 25 c mH2O, respectively. Static chest tomography was performed at the same pres-
sures at baseline and immediately after the saline lavage, as a reference. The injurious ventilation was stopped
when the P aO2/FiO2 ratio was below 200 mmHg (moderate-acute lung injury2) and mechanical ventilation was
switched back to protective ventilation. One 4D (3D + time) microscopy scan of the injured lung was acquired.
A novel acquisition protocol, based on the synchronization between heartbeat and mechanical ventilation, was
specifically designed to minimize motion artefacts as described in the previous section.
During the 4D microscopy acquisition, mechanical ventilation was synchronized with the ECG, with the
following parameters: PEEP = 5 c mH2O; FiO2 = 1; respiratory rate = 30 to 40 breaths per minute; inspiratory/
expiratory ratio = 1:2; driving pressure = 15 to 25 cmH2O. For the acquisition of the 4D microscopy the integration
time was set to 3 ms and the frame rate to 90 fps. The speed of rotation was set to cover 1000 respiratory cycles
in a 2π rotation, determining a total scan duration of approximately 30 min, with 147,500 projections acquired.
In one animal (Rabbit 5) 1.2 mL of iodine (400 mg ml−1) was added to the 40 mL saline solution for the lav-
age, to better visualize the distribution of fluid within the airspaces.
After imaging, each animal was euthanized by barbiturate overdose (IV injection of pentobarbital sodium
220 mg/kg); the heart and lungs were removed en-bloc and fixed by instillation of Formaldehyde 4% through the
tracheal cannula at a hydrostatic pressure of 20 cmH2O. The extraction began on average 4 h after the beginning
of the injurious ventilation, 30 min after the euthanasia. The fixed samples were sliced axially and embedded
in paraffin. Lung tissue sections (3 µm) were prepared on glass slides and stained with hematoxylin, eosin and
saffron (HES). The slides were scanned under light microscopy at × 10 magnification using a LEICA Aperio AT2
microscope (Leica microsystem, Wetzlar, Germany).
4D microscopy reconstruction. The phase of the lung parenchymal motion, at which each projection
was acquired, was determined prior to tomographic reconstruction. Thanks to the synchronization between
Scientific Reports | (2021) 11:4236 | https://doi.org/10.1038/s41598-020-77300-x 8
Vol:.(1234567890)www.nature.com/scientificreports/
the heartbeat and the mechanical ventilator, the phase was fully determined by the ECG. The ECG acquired
during the scan was analyzed with a Matlab script (version 2017a, www.mathworks.com), to identify the QRS
complexes based on the approach described in53: this approach is based on a band pass filtering in the wavelet
domain. Once the QRS complexes were identified, a feedback on the detection was obtained computing the
time interval between consecutive complexes, corresponding to the duration of the heartbeats, expected to be
constant or slowly varying. The window of the band pass filter in the wavelet domain was empirically adjusted
in case of wrong QRS identifications.
Given a specific delay tj from the j-th QRS complex of the periodic respiratory cycle, which labels the phase
of the parenchymal motion, all the projections whose acquisition started in a time interval centered around
tj and with amplitude T equal to the integration time, were used for the reconstruction of the corresponding
phase:φj = �tj . Tomographic reconstruction was performed with a Filtered Back Projection algorithm using the
software PyHST254 after the application of the Paganin’s single material phase retrieval algorithm55. Since the ECG
signal is not perfectly periodic, the projections were not equally spaced. The angle associated to each projection
was computed knowing the speed of the rotation and the time elapsed since the beginning of the acquisition.
For each dynamic scan, 10 to 15 phases were reconstructed. Since the selection of the projections is based
on the ECG analysis, the phases corresponding to the QRS complexes of each heart cycle were reconstructed,
together with the phases at 150 ms time distance. Since the duration of the heart cycle was of approximately
300–350 ms, the phases chosen were almost equally spaced in time. If the heart cycle was longer than 375 ms,
a third phase was reconstructed per heart period, positioned at 300 ms from the previous QRS complex. The
choice of having one image approximately every 150 ms was a compromise between time resolution and com-
putational time.
Detection of atelectrauma. 4D microscopy was used to study and quantify atelectrauma dynamically
during a whole respiratory cycle. To this end, volumes corresponding to consecutive timeframes were realigned
using elastic image registration and the density of corresponding regions was compared, to identify opening and
closure of airspaces. Prior to elastic registration volumes were rescaled by a factor of two, to reduce the computa-
tion time, and denoised by the application of an anisotropic diffusion a lgorithm56 implemented in the Simple
ITK library (Insight Segmentation and Registration Toolkit, https://itk.org).
Image registration was performed using the Simple Elastix library57,58. An initial affine transformation was
estimated to compensate for the vertical translation of the lungs during ventilation, followed by a 3D B-Spline
model. The cost function utilized was the sum of square differences of the volumes, with the bending energy
regularization term described in Rueckert et al.59, coupled to a gradient descent optimizer. A multiresolution
approach was utilized, with scaling factors 8, 4 and 2, achieving a minimum voxel size of 8 03 μm3. The spacing of
the grid, on which the B-Spline approximation was defined, was adapted to the different resolutions: 1.6 mm for
the scaling factor 8 and 4 and 0.8 mm for the highest resolution. A Gaussian smoothing, with standard deviation
equal to one half of the scaling factor, was applied when downsampling. The computation time was 1 h on a local
desktop machine (2 CPUs: Intel Xeon @ 2.3 GHz ⨯ 18, 512 GB of RAM).
Once two consecutive time frames were realigned, a threshold on the gray levels was applied. The threshold
was empirically defined based on the histogram of the gray levels, to divide the two main distributions: the one
of the aerated voxels and the one of blood vessels and soft tissue. Since a given threshold corresponds to a precise
value of air fraction in the voxel (estimated as 45% in this study), the threshold was considered constant along
the respiratory cycle and in between rabbits. Opening occurred when the status of the voxels changed from non-
aerated to aerated, and vice-versa. Since the registration did not have a one-voxel precision, a morphological
opening with a 3D kernel of radius 1 was applied to remove detections due to residual misalignments of airways
and blood vessels.
Atelectrauma was quantified by defining the recruitment and derecruitment fractions F R and
F
D, respectively
equal to the volume detected as opening and closing between i
the time frames i and i + 1 VR,D , normalized to
i
the total lung volume in the field of view at time frame i V :
i
VR,D
FiR,D =
Vi
The normalization was adopted to take into account the inflation and deflation during mechanical ventilation
and for inter-rabbit comparison.
Assessment of injury development. To assess how injury developed in our model, the static tomo-
graphic scans acquired at PEEP 5 cmH20 and 25 cmH20 during injurious ventilation were reconstructed using
Filtered Back Projection and after applying the Paganin’s single material phase retrieval algorithm. The analysis
was focused on three conditions: baseline, saline lavage and end of injurious ventilation. The gray levels were
converted to Hounsfield Units (HU) assuming a linear relationship, which was guaranteed by the linearity of
the detector49 and the monochromaticity of the beam. The gray level and HU of blood and air were utilized
as reference points for the conversion. The linear attenuation coefficient for the blood at 50 keV was obtained
from the NIST database and was used to compute the nominal HU value of blood at this energy. The lung tis-
sue in each tomographic reconstruction was segmented into 4 components: Closed (HU > − 100), Poorly aer-
ated (− 500 < HU < − 100), Normally Aerated (− 900 < HU < − 500) and Hyper-inflated (HU < − 900)60. Since the
intervals found in literature refer to a lower spatial resolution, the volumes were downscaled by a factor 10 in the
reconstruction plane before conversion to HU. A sub-acinar spatial resolution could lead to a higher air content
inside each voxel and to the resulting overestimation of hyperinflation. The fraction corresponding to each of
Scientific Reports | (2021) 11:4236 | https://doi.org/10.1038/s41598-020-77300-x 9
Vol.:(0123456789)www.nature.com/scientificreports/
Figure 7. HES staining of the lung tissue and corresponding in vivo dynamic 3D microscopy for Rabbit 3. On
the HES images, the regions of interest chosen for the qualitative evaluation are shown, using a color coding
representing the score given by the pathologist. The regions of interest were chosen in areas showing R/D in the
CT and in areas not showing it, in order to compare the spatial distribution of R/D and injury.
the four categories was computed, by dividing by the total lung tissue volume in the field of view at each time
and pressure. The pressure–time dependence of the tissue fractions was considered an indicator of lung injury
development and was evaluated with a repeated measurements two-way ANOVA, considering time and pressure
as factors. The analysis was performed for each tissue category separately. The two-way interaction between the
factors was performed with a paired t-test using the Bonferroni correction for the p-value. The statistical tests
were performed with the software R (version 3.6.3).
Assessment of alveolar damage and inflammation. Correlation between alveolar damage and ate-
lectrauma was assessed by histological analysis, based on a qualitative description of the injury (Fig. 7). Regional
lung cellular infiltration was further quantified by automated cell counting. For each lung, one histologic section
was chosen, yielding a total of ten samples. For each sample ten regions of interest (ROI) of 800 × 800 μm2 were
chosen as representative of two classes: (i) atelectrauma visible in the 4D microscopy; (ii) normally aerated dur-
ing the whole respiratory cycle. A one-to-one correspondence between CT and histology couldn’t be established,
due to the morphological changes occurring during the sample preparation; CT and histology couldn’t therefore
be realigned. Blood vessels and airways were used as landmarks to manually identify corresponding regions with
the best accuracy achievable.
The qualitative assessment of the injury in the 100 regions of interest was performed by a pathologist blinded
to the sample condition, with a score from 1 to 4, corresponding to: none; mild; moderate and severe injury,
similar to Tsuchida et al.61. The score was based on neutrophil infiltration, alveolar wall disruption and forma-
tion of hyaline membranes.
Cellular infiltration was estimated on the same regions of interests, using a cell counting procedure based on
the software ImageJ (https: //imagej .nih.gov/), targeting the cell nuclei stained by the hematoxylin. The number of
nuclei counted was normalized to the tissue length present in each region of interest , obtaining a linear cell den-
sity. Tissue length was estimated with a custom made python script based on the package scikit-image62. Briefly
the fraction of the total tissue surface present in the ROI associated to a given tissue thickness was estimated
using morphological granulometry63, i.e. successive morphological opening with a kernel of increasing radius.
Total tissue length was estimated accordingly, by dividing the tissue surface to the corresponding tissue thickness.
Data availability
The datasets analyzed in the current study are available from the corresponding author on reasonable request.
Received: 23 June 2020; Accepted: 4 November 2020
References
1. Ashbaugh, D., Boyd Bigelow, D., Petty, T. & Levine, B. Acute respiratory distress in adults. Lancet 290, 319–323 (1967).
2. The ARDS Definition Task Force. Acute respiratory distress syndrome: the Berlin definition. JAMA 307, 2526–2533 (2012).
3. Bellani, G., Laffey, J. G., Pham, T. & Fan, E. The LUNG SAFE study: a presentation of the prevalence of ARDS according to the
Berlin Definition! Crit. Care 20, 268 (2016).
4. Bates, J. H. T. & Smith, B. J. Ventilator-induced lung injury and lung mechanics. Ann. Transl. Med. Publ. Ahead Print 6, 378 (2018).
5. Acute Respiratory Distress Syndrome Network. Ventilation with lower tidal volumes as compared with traditional tidal volumes
for acute lung injury and the acute respiratory distress syndrome. N. Engl. J. Med. 342, 1301–1308 (2000).
Scientific Reports | (2021) 11:4236 | https://doi.org/10.1038/s41598-020-77300-x 10
Vol:.(1234567890)www.nature.com/scientificreports/
6. Yen, S. et al. The link between regional tidal stretch and lung injury during mechanical ventilation. Am. J. Respir. Cell Mol. Biol.
60, 569–577 (2018).
7. Kay, S. S., Bilek, A. M., Dee, K. C. & Gaver, D. P. Pressure gradient, not exposure duration, determines the extent of epithelial cell
damage in a model of pulmonary airway reopening. J. Appl. Physiol. 97, 269–276 (2004).
8. Mead, J., Takishima, T. & Leith, D. Stress distribution in lungs: a model of pulmonary elasticity. J. Appl. Physiol. 28, 596–608 (1970).
9. National Heart Lung, and Blood Institute ARDS Clinical Trials Network. Higher versus lower positive end-expiratory pressures
in patients with the acute respiratory distress syndrome. N. Engl. J. Med. 351, 327–336 (2004).
10. Meade, M. O. et al. Ventilation strategy using low tidal volumes, recruitment maneuvers, and high positive end-expiratory pressure
for acute lung injury and acute respiratory distress syndrome: a randomized controlled trial. JAMA 299, 637–645 (2008).
11. Mercat, A. et al. Positive end-expiratory pressure setting in adults with acute lung injury and acute respiratory distress syndrome:
a randomized controlled trial. JAMA 299, 646–655 (2008).
12. Briel, M. et al. Higher vs lower positive end-expiratory pressure in patients with acute lung injury and acute respiratory distress
syndrome: systematic review and meta-analysis. JAMA 303, 865–873 (2010).
13. Bravin, A., Coan, P. & Suortti, P. X-ray phase-contrast imaging: from pre-clinical applications towards clinics. Phys. Med. Biol. 58,
R1–R35 (2012).
14. Kitchen, M. J. et al. CT dose reduction factors in the thousands using X-ray phase contrast. Sci. Rep. 7, 15953 (2017).
15. Bayat, S. et al. Effect of positive end-expiratory pressure on regional ventilation distribution during mechanical ventilation after
surfactant depletion. Anesthesiol. J. Am. Soc. Anesthesiol. 119, 89–100 (2013).
16. Cereda, M. et al. Visualizing the propagation of acute lung injury. Anesthesiol. J. Am. Soc. Anesthesiol. 124, 121–131 (2016).
17. Nieman, G. F. et al. Physiology in medicine: understanding dynamic alveolar physiology to minimize ventilator-induced lung
injury. J. Appl. Physiol. 122, 1516–1522 (2017).
18. Retamal, J. et al. Non-lobar atelectasis generates inflammation and structural alveolar injury in the surrounding healthy tissue
during mechanical ventilation. Crit. Care 18, 505 (2014).
19. Muscedere, J. G., Mullen, J. B., Gan, K. & Slutsky, A. S. Tidal ventilation at low airway pressures can augment lung injury. Am. J.
Respir. Crit. Care Med. 149, 1327–1334 (1994).
20. D’Angelo, E. et al. Low-volume ventilation causes peripheral airway injury and increased airway resistance in normal rabbits. J.
Appl. Physiol. 92, 949–956 (2002).
21. González-López, A. et al. Lung strain and biological response in mechanically ventilated patients. Intensive Care Med. 38, 240–247
(2012).
22. Chen, Z., Song, Y., Hu, Z., Zhang, S. & Chen, Y. An estimation of mechanical stress on alveolar walls during repetitive alveolar
reopening and closure. J. Appl. Physiol. 119, 190–201 (2015).
23. Pelosi, P. et al. Recruitment and derecruitment during acute respiratory failure. Am. J. Respir. Crit. Care Med. 164, 122–130 (2001).
24. Crotti, S. et al. Recruitment and derecruitment during acute respiratory failure. Am. J. Respir. Crit. Care Med. 164, 131–140 (2001).
25. David, M. et al. Analysis of atelectasis, ventilated, and hyperinflated lung during mechanical ventilation by dynamic CT. Chest
128, 3757–3770 (2005).
26. David, M. et al. Analysis of the static pressure volume curve of the lung in experimentally induced pulmonary damage by CT-
densitometry. RoFo Fortschritte auf dem Gebiete der Rontgenstrahlen und der Nukl. 177, 751–757 (2005).
27. Mergoni, M., Volpi, A., Bricchi, C. & Rossi, A. Lower inflection point and recruitment with PEEP in ventilated patients with acute
respiratory failure. J. Appl. Physiol. 91, 441–450 (2001).
28. Downie, J. M., Nam, A. J. & Simon, B. A. Pressure–volume curve does not predict steady-state lung volume in canine lavage lung
injury. Am. J. Respir. Crit. Care Med. 169, 957–962 (2004).
29. Hickling, K. G. Best compliance during a decremental, but not incremental, positive end-expiratory pressure trial is related to
open-lung positive end-expiratory pressure: a mathematical model of acute respiratory distress syndrome lungs. Am. J. Respir.
Crit. Care Med. 163, 69–78 (2001).
30. Jonson, B. et al. Pressure–volume curves and compliance in acute lung injury: evidence of recruitment above the lower inflection
point. Am. J. Respir. Crit. Care Med. 159, 1172–1178 (1999).
31. Luecke, T. et al. Setting mean airway pressure during high-frequency oscillatory ventilation according to the static pressure-volume
curve in surfactant-deficient lung injurya computed tomography study. Anesthesiol. J. Am. Soc. Anesthesiol. 99, 1313–1322 (2003).
32. Broche, L. et al. Dynamic mechanical interactions between neighboring airspaces determine cyclic opening and closure in injured
lung. Crit. Care Med. 45, 687–694 (2017).
33. Cressoni, M., Chiurazzi, C., Chiumello, D. & Gattinoni, L. Does high PEEP prevent alveolar cycling?. Medizinische Klin. - Inten-
sivmed. und Notfallmedizin 113, 7–12 (2018).
34. Cavalcanti, A. B. et al. Effect of lung recruitment and titrated positive end-expiratory pressure (PEEP) vs Low PEEP on mortality
in patients with acute respiratory distress syndrome: a randomized clinical trial. JAMA 318, 1335–1345 (2017).
35. Nieman, G. F. et al. Prevention and treatment of acute lung injury with time-controlled adaptive ventilation: physiologically
informed modification of airway pressure release ventilation. Ann. Intensive Care 10, 3 (2020).
36. Suki, B., Barabási, A. L., Hantos, Z., Peták, F. & Stanley, H. E. Avalanches and power-law behaviour in lung inflation. Nature https
://doi.org/10.1038/368615a0 (1994).
37. Markstaller, K. et al. Temporal dynamics of lung aeration determined by dynamic CT in a porcine model of ARDS. BJA 87, 459–468
(2001).
38. Bates, J. H. T. & Irvin, C. G. Time dependence of recruitment and derecruitment in the lung: a theoretical model. J. Appl. Physiol.
93, 705–713 (2002).
39. Smith, B. J., Grant, K. A. & Bates, J. H. T. Linking the development of ventilator-induced injury to mechanical function in the lung.
Ann. Biomed. Eng. 41, 527–536 (2013).
40. Spieth, P. M. et al. Mechanotransduction in the lungs. Minerva Anestesiol. 80, 933–941 (2014).
41. Cavanaugh, K. J. Jr., Oswari, J. & Margulies, S. S. Role of stretch on tight junction structure in alveolar epithelial cells. Am. J. Respir.
Cell Mol. Biol. 25, 584–591 (2001).
42. Cavanaugh, K. J. & Margulies, S. S. Measurement of stretch-induced loss of alveolar epithelial barrier integrity with a novel in vitro
method. Am. J. Physiol. - Cell Physiol. https://doi.org/10.1152/ajpcell.00341.2002 (2002).
43. Matute-Bello, G., Frevert, C. W. & Martin, T. R. Animal models of acute lung injury. Am. J. Physiol. Lung Cell. Mol. Physiol. 295,
L379–L399 (2008).
44. Frank, J. A., Pittet, J.-F., Wray, C. & Matthay, M. A. Protection from experimental ventilator-induced acute lung injury by IL-1
receptor blockade. Thorax 63, 147–153 (2008).
45. Yen, S. et al. Interaction between regional lung volumes and ventilator-induced lung injury in the normal and endotoxemic lung.
Am. J. Physiol. Cell. Mol. Physiol. 318, L494–L499 (2020).
46. Bayat, S. et al. Methacholine and ovalbumin challenges assessed by forced oscillations and synchrotron lung imaging. Am. J. Respir.
Crit. Care Med. 180, 296–303 (2009).
47. Elleaume, H. et al. Instrumentation of the ESRF medical imaging facility. Nucl. Instrum. Methods Phys. Res. Sect A Accel. Spectrom.
Detect. Assoc. Equip. 428, 513–527 (1999).
48. Suortti, P. et al. Fixed-exit monochromator for computed tomography with synchrotron radiation at energies 18–90 keV. J. Syn-
chrotron Radiat. 7, 340–347 (2000).
Scientific Reports | (2021) 11:4236 | https://doi.org/10.1038/s41598-020-77300-x 11
Vol.:(0123456789)www.nature.com/scientificreports/
49. Mittone, A. et al. Characterization of a sCMOS-based high-resolution imaging system. J. Synchrotron Radiat. 24, 1226–1236 (2017).
50. Bayat, S. et al. Quantitative functional lung imaging with synchroton radiation using inhaled xenon as contrast agent. Phys. Med.
Biol. 46, 3287–3299 (2001).
51. Porra, L. et al. Effect of tidal volume on distribution of ventilation assessed by synchrotron radiation CT in rabbit. J. Appl. Physiol.
96, 1899–1908 (2004).
52. Haberthur, D., Hintermuller, C., Marone, F., Schittny, J. C. & Stampanoni, M. Radiation dose optimized lateral expansion of the
field of view in synchrotron radiation X-ray tomographic microscopy. J. Synchrotron Radiat. 17, 590–599 (2010).
53. R wave detection in the ECG. https://fr.mathworks.com/help/wavelet/ug/r-wave-detection-in-the-ecg.html.
54. Mirone, A., Brun, E., Gouillart, E., Tafforeau, P. & Kieffer, J. The PyHST2 hybrid distributed code for high speed tomographic
reconstruction with iterative reconstruction and a priori knowledge capabilities. Nucl. Instrum. Methods Phys Res. Sect. B Beam
Interact. Mater. Atoms 324, 41–48 (2014).
55. Paganin, D., Mayo, S. C., Gureyev, T. E., Miller, P. R. & Wilkins, S. W. Simultaneous phase and amplitude extraction from a single
defocused image of a homogeneous object. J. Microsc. 206, 33–40 (2002).
56. Perona, P. & Malik, J. Scale-space and edge detection using anisotropic diffusion. IEEE Trans. Pattern Anal. Mach. Intell. 12, 629–639
(1990).
57. Klein, S., Staring, M., Murphy, K., Viergever, M. A. & Pluim, J. P. W. Elastix: A Toolbox for Intensity-Based Medical Image Regis-
tration. IEEE Trans. Med. Imaging 29, 196–205 (2010).
58. Marstal, K., Berendsen, F., Staring, M. & Klein, S. SimpleElastix: A User-Friendly, Multi-lingual Library for Medical Image Reg-
istration. in IEEE Computer Society Conference on Computer Vision and Pattern Recognition Workshops 574–582 (2016). https://
doi.org/10.1109/CVPRW.2016.78.
59. Rueckert, D. Nonrigid registration using free-form deformations: Application to breast MR images. IEEE Trans. Med. Imaging 18,
712–721 (1999).
60. Cressoni, M. et al. Opening pressures and atelectrauma in acute respiratory distress syndrome. Intensive Care Med. 43, 603–611
(2017).
61. Tsuchida, S. et al. Atelectasis causes alveolar injury in nonatelectatic lung regions. Am. J. Respir. Crit. Care Med. 174, 279–289
(2006).
62. Van Der Walt, S. et al. Scikit-image: image processing in python. PeerJ 2, e453 (2014).
63. Matheron, G. Random Sets and Integral Geometry (Wiley, New York, 1974).
Acknowledgements
The authors would like to thank the ESRF for the provision of the beamtime (MD1072), the ID17 beamline staff
for their support in the setting up and control of the experiments, and the BioMedical Facility personnel for their
contribution in the realization of the in vivo protocols.
Author contributions
L.F., L.B., G.L., A.L., A.B. and S.B.: conception and design of research; L.F., L.B., G.L., A.M., A.B. and S.B. per-
formed experiments; L.F., L.B., A.M., O.S., S.B., analyzed data; L.F., L.B., O.S., A.L., A.B., and S.B.: interpreted
results of experiments; L.F. prepared figures; L.F. and S.B. drafted manuscript; L.F., A.L., A.B. and S.B. edited and
revised manuscript; all authors approved final version of manuscript.
Funding
This work was supported by the European Synchrotron Radiation Facility, the French National Research Agency
in the framework of the "Investissements d’avenir” program (ANR-15-IDEX-02), the Swedish Heart and Lung
Foundation (2017-0531) and the Swedish Research Council (K2015-99X-22731-01-04 and 2018-02438).
Competing interests
The authors declare no competing interests.
Additional information
Supplementary information is available for this paper at https://doi.org/10.1038/s41598-020-77300-x.
Correspondence and requests for materials should be addressed to S.B.
Reprints and permissions information is available at www.nature.com/reprints.
Publisher’s note Springer Nature remains neutral with regard to jurisdictional claims in published maps and
institutional affiliations.
Open Access This article is licensed under a Creative Commons Attribution 4.0 International
License, which permits use, sharing, adaptation, distribution and reproduction in any medium or
format, as long as you give appropriate credit to the original author(s) and the source, provide a link to the
Creative Commons licence, and indicate if changes were made. The images or other third party material in this
article are included in the article’s Creative Commons licence, unless indicated otherwise in a credit line to the
material. If material is not included in the article’s Creative Commons licence and your intended use is not
permitted by statutory regulation or exceeds the permitted use, you will need to obtain permission directly from
the copyright holder. To view a copy of this licence, visit http://creativecommons.org/licenses/by/4.0/.
© The Author(s) 2021
Scientific Reports | (2021) 11:4236 | https://doi.org/10.1038/s41598-020-77300-x 12
Vol:.(1234567890)You can also read