Loneliness and Social Isolation: An Unequally Shared Burden in Europe - IZA DP No. 14245 APRIL 2021
←
→
Page content transcription
If your browser does not render page correctly, please read the page content below
DISCUSSION PAPER SERIES

IZA DP No. 14245

Loneliness and Social Isolation:
An Unequally Shared Burden in Europe

Béatrice d’Hombres
Martina Barjaková
Sylke V. Schnepf

APRIL 2021
DISCUSSION PAPER SERIES

IZA DP No. 14245

Loneliness and Social Isolation:
An Unequally Shared Burden in Europe

Béatrice d’Hombres
European Commission, Joint Research Centre
Martina Barjaková
Economic and Social Research Institute
Sylke V. Schnepf
European Commission, Joint Research Centre and IZA

APRIL 2021

Any opinions expressed in this paper are those of the author(s) and not those of IZA. Research published in this series may
include views on policy, but IZA takes no institutional policy positions. The IZA research network is committed to the IZA
Guiding Principles of Research Integrity.
The IZA Institute of Labor Economics is an independent economic research institute that conducts research in labor economics
and offers evidence-based policy advice on labor market issues. Supported by the Deutsche Post Foundation, IZA runs the
world’s largest network of economists, whose research aims to provide answers to the global labor market challenges of our
time. Our key objective is to build bridges between academic research, policymakers and society.
IZA Discussion Papers often represent preliminary work and are circulated to encourage discussion. Citation of such a paper
should account for its provisional character. A revised version may be available directly from the author.

                                                     ISSN: 2365-9793

                                           IZA – Institute of Labor Economics
Schaumburg-Lippe-Straße 5–9                      Phone: +49-228-3894-0
53113 Bonn, Germany                             Email: publications@iza.org                                    www.iza.org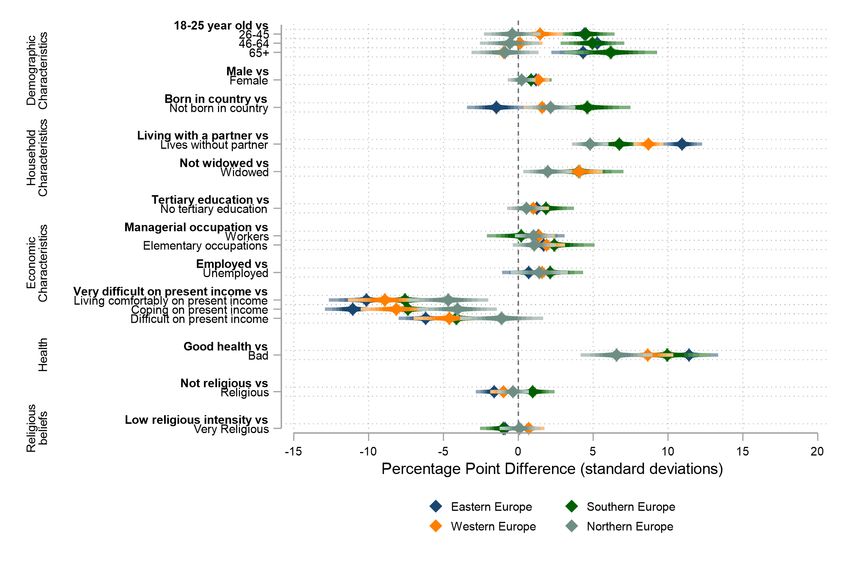
IZA DP No. 14245                                                                                                                     APRIL 2021

            ABSTRACT
            Loneliness and Social Isolation:
            An Unequally Shared Burden in Europe*
            Concerns about loneliness and social isolation are growing more than ever. With the
            COVID-19 pandemic entering its second year, there are fears that the toll on loneliness
            could have consequences long after the virus recedes. This study offers a comparative
            overview of the incidence and determinants of loneliness and social isolation in Europe in
            the pre-COVID-19 period. The empirical results indicate that 8.6% of the adult population
            in Europe suffer from frequent loneliness and 20.8% from social isolation, with eastern
            Europe recording the highest prevalence of both phenomena. Trends over time do not
            indicate any change in the incidence of social isolation following the widespread adoption
            of social media networks from 2010 onwards. The empirical analysis shows that favourable
            economic circumstances protect against loneliness and social isolation, while living alone
            and poor health constitute important loneliness risk factors. Although social isolation
            increases with age, the elderly do not report more frequent feelings of loneliness than
            other age groups, all other things being equal. The relative contributions of the different
            objective circumstances included in the empirical analysis — demographic characteristics,
            economic conditions, living arrangements, health status, religious beliefs and geographical
            location — to chronic loneliness and social isolation vary substantially.

            JEL Classification:               I12, I14, I18, I30, D60
            Keywords:                         loneliness, social isolation, risk factors, Europe

            Corresponding author:
            Beatrice d’Hombres
            European Commission, Joint Research Centre (JRC)
            Directorate I – Competences
            Unit I.1 - Monitoring, Indicators & Impact Evaluation
            Via E. Fermi 2749, TP 361, Ispra (VA), I-21027
            Italy
            E-mail: beatrice.dhombres@ec.europa.eu

            * The contents of this paper are the views of the authors and do not necessarily represent an official position of the
            European Commission.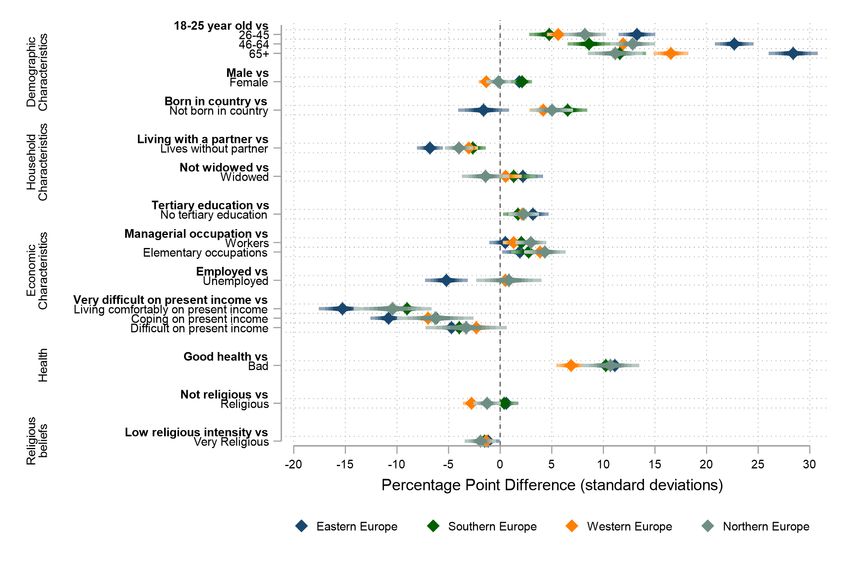
1    Introduction
Concerns about loneliness are growing more than ever. Population ageing, the rising num-
ber of people living alone, global mobility, changes in working methods and the increased
use of digital technologies for communication have led many to suggest that loneliness
is becoming more prevalent. Since the outbreak of the COVID-19 pandemic, lockdowns,
quarantines, curfews, distancing measures, the cancellation of community activities and
events have magnified existing levels of loneliness and social isolation (Buecker et al.,
2020). With the pandemic entering its second year, there are fears that the toll on lone-
liness could have consequences long after the virus recedes.

The impact of loneliness on individual well-being and social cohesion should not be under-
estimated. Loneliness has been compared to obesity and smoking in the mortality risks
that it entails (Holt-Lunstad et al., 2015; Cacioppo and Patrick, 2008; Hertz, 2020). It
is associated with physical and psychological health problems (Hawkley and Cacioppo,
2010). Lonely adults tend to suffer from higher levels of cortisol (the ‘stress hormone’),
raised blood pressure, impaired sleep and cardiovascular resistance compared with non-
lonely individuals, both in stressful situations and when at rest (Hertz, 2020; Hawkley
et al., 2010). Over time, this translates into chronic inflammation and higher morbidity
and mortality rates. Loneliness is also associated with depressive symptoms (Cacioppo et
al., 2006) and with unhealthy behaviours such as smoking and a lack of physical exercise.
In an increasingly connected world, lonely and socially isolated people face the double
penalty of poorer health and being stigmatised as socially awkward.

And feelings of loneliness and social isolation may themselves drive lonely individuals even
further away from others, because loneliness affects behaviour (Cacioppo et al., 2017;
Cacioppo and Patrick, 2008). Individuals suffering from loneliness and social isolation
tend to display lower levels of empathy and feel more threatened by unexpected life
situations compared with their non-lonely counterparts. As argued in Hertz (2020), these
risks translate into higher levels of distrust, intolerance towards others and ultimately
may provide the basis for political developments that pose a risk to social cohesion (Kory
Floyd, 2017; Mayer and Perrineau, 1992).
Although discussions about loneliness are prominent in political debates, and a growing
number of newspapers are now talking about a ‘loneliness pandemic’, cross-national ev-
idence on the incidence of loneliness is still limited. The aim of this study is to fill this
gap and to offer a comparative overview of the prevalence and determinants of loneliness

                                              1
and social isolation in Europe. To the best of our knowledge, existing cross-national stud-
ies (Sundström et al., 2009; Fokkema et al., 2012; Yang and Victor, 2011; Barreto et al.,
2021) do not cover the time frame, countries and set of risk factors that are included in the
present study. In addition, while most of the existing studies focus on the elderly, the em-
pirical analysis in this study is based on a representative sample of the general population.
The remainder of the paper is organised as follows. Section II defines loneliness. Section
III describes the data and presents descriptive statistics, while Section IV sets out the
empirical findings and discusses the drivers associated with loneliness and social isolation.
Section V considers the limitations of the study and future research avenues, and offers
some concluding remarks.
2 Defining and measuring loneliness
While there are different definitions of loneliness in the literature, there is general agree-
ment that it is a subjective feeling referring to an unpleasant experience which derives
from the low quality and/or quantity of a person’s social network (Perlman and Peplau,
1984). Loneliness is thus a subjective feeling with negative connotations. 1 In other words,
loneliness does not mean being alone but feeling alone (Perlman and Peplau, 1984; Ander-
sson, 1998). It therefore differs from the objective condition of being socially isolated. A
person with a lot of social contacts may still experience feelings of loneliness (Andersson,
1998; De Jong Gierveld et al., 2016). This tallies with Perlman and Peplau’s finding that
loneliness relates not just to the quantity of a person’s social relationships, but also to
the quality of these relationships. Loneliness is thus not only about having too few social
contacts per se but about also the perception that these relationships are not satisfying
enough.
The literature identifies several forms of loneliness. Transient loneliness involves occasional
feelings of loneliness, while situational loneliness is triggered by specific events in life (such
as the loss of a partner or moving to a new town), and chronic loneliness results from a
lack of satisfactory relationships for extended time periods (Perlman and Peplau, 1984).
It is this chronic loneliness that is particularly detrimental. Meanwhile, Weiss (1973)
While the focus of this paper is on negative loneliness, there can also be positive loneliness associated
1
with ‘voluntary (mostly temporary) withdrawal from social contacts’ (De Jong Gierveld et al., 2016).
This can happen when a person decides, for instance, not to interact socially in order to dedicate time
to meditation, reflection or artistic activities.
2distinguishes between social and emotional loneliness. The latter stems from the lack of
an intimate relationship (e.g. a romantic partner), while the former is associated with the
perceived absence of a broad social network (e.g. friends, neighbours). 2 Feelings of anxiety
and isolation occur with emotional loneliness, whereas social loneliness is connected with
aimlessness and marginality.
Since loneliness is intrinsically a personal and subjective feeling, its measurement is not
straightforward. It can be measured directly, by asking people about their subjective
feelings of loneliness usually over a specified period of time (e.g. the past week or two
weeks). Alternatively, indirect indicators, which explore specific determinants of loneli-
ness, may be preferred. Surveys for indirect indicators do not employ the words ‘lonely’
or ‘loneliness’ but instead ask about feelings or facts related to loneliness.
Several scales of loneliness based on indirect indicators have been developed in recent
decades, with the best known being the UCLA Loneliness Scale (Russell, 1996) and the
De Jong Gierveld Loneliness Scale (De Jong Gierveld and Kamphuis, 1985). The UCLA
Loneliness Scale is based on 20 questions on aspects such as the frequency of feeling a
lack of companionship, or whether respondents feel left out or isolated from others. The
De Jong Gierveld Loneliness Scale is composed of 11 questions linked to feelings such as
whether respondents miss having close friends or people around them. This scale also
covers questions aimed at measuring more objective circumstances, such as whether re-
spondents have people they can trust completely or rely on in case of hardship. A specific
feature of this scale is that it encompasses the concepts of emotional and social loneliness
(as defined by Weiss, 1973) which are measured separately by two distinct subscales (De
Jong Gierveld and Van Tilburg, 2006). There are also short versions of both the UCLA
and De Jong Gierveld loneliness scales, with three and six questions respectively (Hughes
et al., 2004; De Jong Gierveld and Kamphuis, 1985; De Jong Gierveld and Van Tilburg,
2006). The UCLA and De Jong Gierveld scales offer the advantage of having been tested
scientifically, and therefore have greater validity and reliability than direct measures of
loneliness (De Jong Gierveld et al., 2016). But at the same time, indirect questions may
be influenced by the researchers’ definition and understanding of loneliness, while direct,
subjective measures solely reflect respondents’ feelings. 3 The UCLA and De Jong Gierveld
2
Emotional loneliness corresponds to the inadequate quality of social networks and social loneliness
to an insufficient quantity of social contacts in Perlman and Peplau’s definition.
3
See Nicolaisen and Thorsen (2014) or DeJong Gierveld et al. (2016) for a discussion on the correlation
between direct and indirect measures. See Penning et al (2014) for a comparison of the UCLA and De
Jong Gierveld loneliness scales.
3loneliness scales or their shorter versions cannot be used in this paper due to a lack of
cross-country data.
This paper covers most of the EU countries and employs both a direct measure of loneliness
(i.e. the subjective feeling of loneliness) as well as an objective indicator of social isolation
(i.e. the frequency of meeting socially with friends, relatives or work colleagues). This
offers the opportunity to compare the results across countries and shed further light on
issues related to the definition and measurement of loneliness.
3 Loneliness and Social Isolation through the lens of
the European Social Survey
3.1 Data
Our empirical analysis is based on data drawn from the biennial European Social Survey
(ESS henceforth). The ESS is carried out every two years since 2002. It contains nation-
ally representative samples of individuals aged 15 or older who are residents in private
households, regardless of nationality, citizenship, or language. 4 The survey covers infor-
mation on respondents’ socio-economic and household characteristics as well as detailed
information on trust in institutions, values, identity, health, well-being, various aspects
of civic and political participation and declared attitude towards minority groups.
The 2006, 2010, 2012 and 2014 ESS waves include a direct question on loneliness whilst
all waves (from 2002 to 2018) contain one indirect measure. 5 The wording of the direct
question is the following: “[. . . ] please tell me how much of the time during the past week
you felt lonely?” with the possible answers being “None or almost none of the time”,
”Some of the time”, ”Most of the time”, “All or almost all of the time”. The indirect
question goes as follows: “[. . . ] how often do you meet socially with friends, relatives
or work colleagues?”, with possibilities of answering “Never”, ”Less than once a month”,
”Once a month”, ”Several times a month”, ”Once a week”, ”Several times a week”, ”Every
day”. From these two questions we derive two indicators - one on loneliness and one on
social isolation. Following Yang and Victor (2011), we label respondents reporting to
The country sample size per wave amounts to around 1,500 respondents.
4
Some of the waves include additional indirect measures of loneliness such as having someone to discuss
5
intimate and personal matters with (and about how many such people there are), feelings towards people
in the local area or whether respondents have people in one’s life that really care about them.
4Table 1: Loneliness and Social Isolation: definitions
Indicator Question New Variable
Direct Question How much of the time during the past Not lonely (1- 2)
Frequent Loneliness week you felt lonely? (1) None or almost Lonely (3-4)
none of the time, (2) Some of the time, Year : 2006, 2010, 2012,
(3) Most of the time, (4) All or almost all 2014
of the time.
In the analysis, educational categories (1)
and (2) have been merged.
Indrect Question How often do you meet socially with Socially Isolated (1-3)
Social Isolation friends, relatives or work colleagues?. Not Socially Isolated (4-
(1) Never, (2) Less than once a month, (3) 7)
Once a month, (4) Several times a month Year : 2002-2018
(5) Once a week, (6) Several times a week,
(7) Every day
have felt lonely most of the time, almost all the time or all of the time in the past week
as “frequently lonely”, whereas, along the line of Saltkjel et al., (2013) and Mattila et al.,
(2017), “socially isolated” individuals are those stating that they meet socially at most
once a month. We also check the sensitivity of the results when isolated respondents are
those meeting socially less than once a month with friends, colleagues or relatives.
3.2 The prevalence of frequent loneliness and social isolation in
Europe
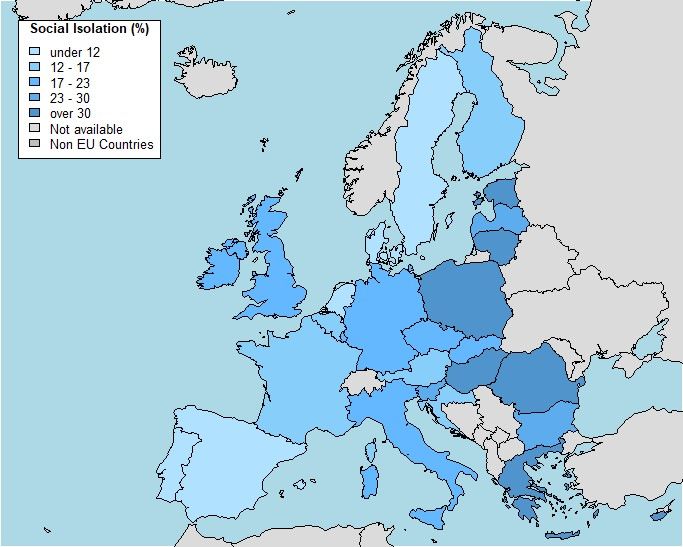
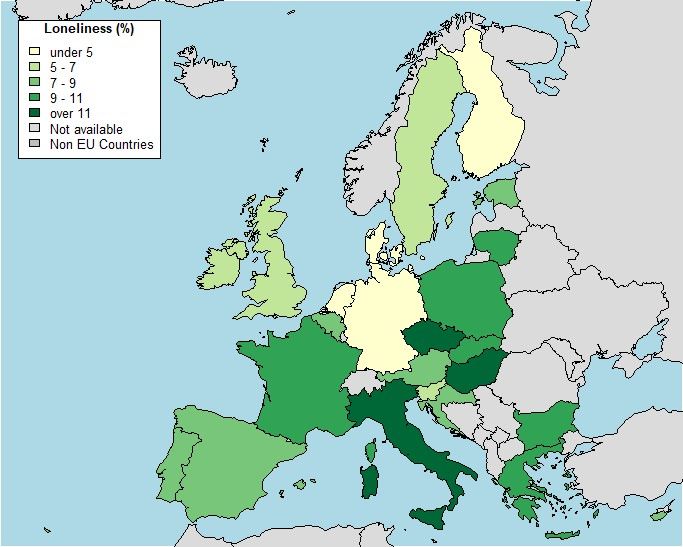
Figure 1 depicts the prevalence of loneliness and social isolation in Europe (see also figures
A1 and A2 in Appendix). Neither of these is uncommon.
Around 9% of Europeans 6 report to be frequently lonely. About every 10th citizen in
Hungary, the Czech Republic, Italy, Poland, Belgium and Greece feels lonely. The lowest
percentage of lonely people are found in the Netherlands and Denmark with just 3%,
Finland with 4% and Germany, Ireland and Sweden with 5%.
Compared to feeling lonely, many more Europeans (20.8%) are socially isolated. Country
variations for this measure are much higher than for subjective loneliness. More than
40% of Hungarians and Greeks do not meet more often than once a month socially. In
6
At the time of the survey, the United Kingdom was still part of the European Union, hence British
citizens are included in the analyses.
5Lithuania, Estonia and Poland the figure approaches 35%. In contrast, social isolation is
the lowest in the Netherlands, Denmark and Sweden with around 8% of individuals being
socially isolated. It is important to keep in mind that these figures may be underesti-
mated, given the negative social stigma associated with loneliness.
Loneliness and social isolation have a clear regional pattern (Figure 2). The lowest levels
of loneliness are found in Northern Europe, followed by Western Europe (with the ex-
ception of France). In contrast, Eastern Europe has the highest share of lonely people,
followed by Southern Europe. Western and Southern Europe are the regions with the
lowest, whereas Eastern Europe records the highest proportion of socially isolated indi-
viduals. More variability is observed in Southern Europe, with Portugal displaying very
low levels of social isolation (9%) whilst the opposite is found in Greece (43%).
These results are in line with the existing literature. Yang and Victor (2011) provide
the only study we are aware of that covers a substantial amount of EU member states.
Using the third wave (2006) of the ESS and the information on self-reported loneliness,
the authors also conclude that Eastern Europe and Southern Europe display higher levels
of loneliness than those living in Northern and Western European countries. 7 Similarly,
Sundström et al. (2009) and Fokkema et al. (2012) report that Central European and
Mediterranean countries have higher prevalence of loneliness among adults aged 50 or
over than Northern European countries. 8
Although the regional patterns described above are undoubtedly partly explained by
differences in individual circumstances across EU member states, they are equally shaped
by a broader socio-cultural country context. In Southern and Eastern European countries
family ties are strong and filial norms, such as co-residing of elderly parents with their
adult children, used to be more prevalent than in Western or Northern Europe (Reher,
1998, Dykstra, 2009, De Jong Gierveld and Tesch-Römer, 2012). Expectations of social
connectedness and hence potential dissatisfaction could therefore be higher in the former
than in the latter group of countries (Sundström et al., 2009).
7
The authors treat Baltic countries as belonging to Northern Europe. However, they conclude that
these countries differ in loneliness from other Northern European countries (i.e. the prevalence is higher).
8
Both studies rely on the Survey of Health, Ageing and Retirement in Europe (SHARE) which specif-
ically targets the population aged 50 or over.
6Figure 1: Prevalence of Loneliness (2006-2014) and Social Isolation (2002-2018) Note: The map on loneliness displays information for 23 EU countries plus the UK. LV, LU, MT and RO are the missing EU countries. Data on loneliness is available for 2006, 2010, 2012 and 2014 unless mentioned otherwise. Data availability: AT (2006 and 2014), BG, CY, CZ, SK (2006, 2010, 2012), EL and HR (2010), IT (2012), LT (2010, 2012, 2014). The map on social isolation displays information for 26 EU countries plus the UK. MT is the missing EU country. Data on social isolation is available every two years from 2002 to 2018 unless mentioned otherwise. Data availability: AT (2002, 2004, 2006, 2014, 2014, 2018), BG, CY, SK (2006, 2008, 2010, 2012, 2018), CZ (2002, 2004, 2008, 2010, 2012, 2014, 2016, 2018), DK (2002, 2004, 2006, 2008, 2010, 2012, 2014) EE (2002 is missing), EL(2002, 2004, 2008, 2010), HR (2008, 2010, 2018), IT (2002, 2012, 2016, 2018), LT (2010, 2012, 2014, 2016, 2018),7LU(2002, 2004), LV (2008, 2018), RO(2008), SK(2004, 2006, 2008, 2010, 2012, 2018).
Figure 2: Prevalence of Loneliness and Social Isolation in EU macro regions

Note: Social isolation is measured across the 9 waves of the ESS (2002-2018) whereas information on
subjective loneliness is available in 2006, 2010, 2012 and 2014. Northern Europe includes Denmark, Fin-
land, Ireland, Sweden and the United Kingdom; Western Europe is Austria, Belgium, France, Germany,
and the Netherlands; Southern Europe is Cyprus, Greece, Italy, Portugal and Spain; Eastern Europe is
Bulgaria, the Czech Republic, Croatia, Estonia, Hungary, Lithuania, Poland, Slovenia and Slovakia.

                                                  8
Figure 3: Prevalence of social isolation over time, by age – 2002-2018
Note: This graph is based on a subset of countries for which data are available for the nine waves of
the ESS. The 13 countries are Belgium, Finland, France, Germany, Hungary, Ireland, the Netherlands,
Poland, Portugal, Slovenia, Spain, Sweden, and the United Kingdom.
3.3 Social Isolation – change over time
Since 2010, the number of monthly active Facebook and YouTube users has dramatically
increased from 500 million for both social media in 2010 to 1.9 billion for Facebook and
2.3 billion for YouTube in 2018 in the world. In Europe, the percentage of individuals
participating in social networks rose from 36% in 2011 to 54% in 2019 while according
to the OECD (2019), the 14-24 year-olds from the OECD-22 were spending around 4.37
hours per day on the internet in 2016. Existing evidence is controversial on whether the
rather recent phenomenon of participation in social media increases loneliness or can sub-
stitute face-to-face contacts (Twenge et al, 2019; Pitman and Reich, 2016; Nowland et al,
2018).
Online interactions could, on the one hand, enhance existing relationships and even forge
new ones (“stimulation” hypothesis), or on the other hand, substitute face-to-face ex-
changes (“displacement” assumption). Although there is a lively debate on the potential
impact of social medial on loneliness, in particular among the youth, the evidence is rather
inconclusive. As argued by Nowland et al (2018), social media effects might vary by age
group as well as depend on the type (e.g. text versus image-based networks) and specific
9use of social media technologies (e.g. passive versus active users). 9
Figure 3 displays the time variations in social isolation for the full sample as well as by
age groups. To be able to compare changes over time, we use data from the 13 countries
for which we have information on social isolation for each of the 9 ESS waves. The
figure shows that social isolation remained relatively stable over time. We note a slight
increasing trend from 2008 for the full sample and most of the age groups. Yet, there is
no significant change in social isolation following the widespread adoption of social media
networks.
Unfortunately, we cannot properly examine time variations in loneliness, as the data on
loneliness covers a much shorter time frame (2006-2014).
4 The profile of lonely and socially isolated individ-
uals
4.1 Estimation method
We estimate the following equation to assess the determinants of loneliness and social
isolation:
Yict = Xict β + Cc + Tt + ict . (1)
where yict measures frequent loneliness or social isolation for individual i living in country
c at time t whilst Xict is a vector of variables capturing the socio-economic status as well
as the demographic and household characteristics of individual i. More specifically, Xict
includes information on gender, age, migrant and health status, household type (pres-
ence of children, marital status), the education level, labour market and occupational
status of individual i, the financial situation of his/her household as well as information
on the living area (rural, large cities). Cc and Tt are respectively country and year fixed
effects. Table 2 describes each of the variables included in equation (1). Equation (1) is
estimated with a logistic model on the full sample as well as separately by macro-region. 10
9
As explained by the authors, the relationship between loneliness and social media is bidirectional as
loneliness affects the way individuals employ social media technologies. Jung and Sundar (2021) suggest
that social medial could help the elderly to feel less isolation whereas Crenna-Jennings (2021) find that
heavy social media use is associated with lower well-being among children and adolescents. Other recent
studies include Allcott et al (2020) and Beyens et al (2020).
10
Estimates based on linear probability models provide similar results.
10In the last part of the next section, we assess the relative importance of the covariates in-
cluded in equation (1). This normally involves decomposing the variance, or, equivalently,
its R-squared (Grömping, 2006 and 2015). Note that this implies that for the decompo-
sition, equation (1) is estimated with a linear probability model. This is not problematic
as estimates based on linear probability or logit models tend to provide similar results.
More specifically, we examine the relative contribution of each variable on the right-hand
side of equation (1) to the model’s total explanatory power. The approach accounts for
the dependence of partial R-squared on the order of entrance of covariates in equation (1)
by averaging over all possible orders.
4.2 Empirical results
Columns 1 of Appendix Tables 4 and 5 display the estimates of equation (1) on the full
sample when yict respectively measures frequent loneliness and social isolation. In order
to ease the reading of the findings, a selected set of factors contributing to loneliness are
also displayed in Figures 6 and 7. The “diamonds” depict the percentage point differences
in terms of loneliness and social isolation between a person with the individual character-
istics reported on the y-axis and their reference group reported in bold. The horizontal
lines through these diamonds represent the 95% confidence intervals.
Both frequent loneliness and social isolation are related to individuals’ demographic char-
acteristics. The elderly suffer from far more social isolation than other age groups. Com-
pared to those aged 18 to 25, adults aged 65 and over are 17 percentage points more
likely not to engage often in social activities. This figure is above 28 percentage points in
Eastern Europe and equal to 11 percentage points in Northern Europe. Family ties and
varying cultures and closeness of friendships might drive regional variations (Sudström,
2009, Dykstra, 2009). Overall, social isolation appears to increase linearly with age. On
the other hand, all other things being equal, frequent loneliness is not a specificity of
the elderly. Although respondents aged 65 or more are 1 percentage point more likely to
feel frequently lonely then young adults (18-25 years old), the confidence intervals asso-
ciated with the point estimates of the three age category dummies (25-45, 46-64 and 65
+ years old) overlap. Such result goes against previous research pointing out a U-shaped
relationship in European countries (Yang & Victor, 2011; Dykstra, 2009, Luhmann and
Hawkley, 2016). On the other hand, in a recent study covering 237 countries, islands and
territories, Barreto et al (2021) report a negative association between loneliness and age.
Yet, our finding can be explained if the expectation from the society is that loneliness is
11Figure 4: Nonlinear relationship between Loneliness and Age
(a) (b)
Note: The figure (a) on the left plots the unconditional relationships between loneliness and age. Instead
of using age group dummies, we employ a smooth non-linear function. In the figure (b) on the right
hand side , we account for the linear effect of the covariates included in equation (1).
particularly prevalent among the seniors (e.g. due to the loss of loved ones or the shrink-
ing of social networks), and that the feeling of loneliness of a senior is determined by its
relative evaluation with respect to its peer group. In that case, the elderly may not posit
themselves as lonely even though they live in greater social isolation than other popula-
tion groups. As shown in the Figures 4 and 5, the positive linear relationship between age
and social isolation and the absence of it between age and loneliness is confirmed when
age is entered nonlinearly in equation (1) whilst the other covariates remain the same as
those presented in Tables 4-5.
As in Sundström et al. (2009), macro-regional estimates show that there is not a significant
relationship between loneliness and age in Western and Northern European countries.
Women appear to be slightly more prone to loneliness than men whilst there are no gender
differences in terms of social isolation. 11 Interestingly, macro regional estimates indicate
that there are no gender differences in loneliness neither in Southern nor in Northern
Europe. Similarly, women tend to be more socially isolated than men in Eastern and
Southern Europe whereas the opposite is observed in Western Europe: in other words,
females report more loneliness but less social isolation than males in this region.
11
See Luhmann and Hawkley, 2016 for a similar result on loneliness with German data.
12Figure 5: Nonlinear relationship between Social Isolation and Age
(a) (b)
Note:The figure (a) on the left plots the unconditional relationship between social isolation and age.
Instead of using age group dummies, we employ a smooth non-linear function. In the figure (b) on the
right, we account for the linear effect of the covariates included in equation (1).
Frequent loneliness and social isolation are linked to family arrangements. Face-to-face
connections with close family lower the incidence of loneliness. Single individuals have,
on average, 8-percentage-point higher risk of being frequently lonely than individuals liv-
ing with a partner, in spite of meeting socially more often. As shown in Fokkema et al
(2009), living alone is key in triggering loneliness, and this despite the fact that new digital
communication channels have widely facilitated contacts with people living outside the
household. Not having children at home also significantly contributes to frequent feelings
of loneliness, even though such people meet socially more often. Regional variations are
substantial. Whereas individuals living without a partner face a 5-percentage-point higher
risk of frequent loneliness in Northern Europe, this figure doubles in Eastern Europe. Not
surprisingly, the widowed are also 4 percentage-point more likely to be lonelier. Although
being widowed is also linked to a reduced frequency of social contacts, the magnitude of
the effect is lower than what we observe for loneliness.
Favorable economic circumstances protect against frequent loneliness and social isolation.
This is in line with the existing literature (e.g. Luhmann & Hawkley, 2016; Cohen-
Mansfield et al., 2009; Savikko et al., 2005). More specifically, individuals reporting
to live comfortably on present income have a 9-percentage-point lower chance of feeling
lonely compared to their counterparts declaring that it is very difficult to live with cur-
13rent income. Similarly, the unemployed as well as those occupying elementary positions
are each about 2 percentage points more likely to feel frequently lonely than respectively
the employed respondents and those being managers or professionals. Education is also
associated with less frequent loneliness. Macro-regional variations underline that loneli-
ness results from the interplay of individual and environmental factors (Fokkema et al,
2009, Dykstra, 2009). Income is significantly more important in Eastern Europe than in
Northern Europe in protecting against loneliness.
Engaging in social activities also requires adequate income. Respondents comfortable
with present income are between 9 (Southern Europe) and 15 percentage points (Eastern
Europe) less likely to be socially isolated than respondents stating that it is very difficult
to rely on present income. Financial constraints lead to difficulties in maintaining one’s
social network. In addition, as one climbs the ladder of occupations (from no occupation
to elementary positions, workers, technicians until managers and professionals) the prob-
ability of meeting socially with friends, relatives or work colleagues once a month or less
decreases. Furthermore, education provides more opportunities to meet socially.
In line with previous literature (De Jong Gierveld and Van Tilburg, 2010; Sundström
et al., 2009; Nicolaisen and Thorsen, 2014, Luhmann and Hawkley, 2016), poor health
is highly associated with both loneliness and social isolation. Individuals with health
issues are, all other things being equal, 9 percentage points more likely to be frequently
lonely or socially isolated compared to their healthier counterparts. These figures are
equivalent to an increase in frequent loneliness by 100% and in social isolation by 50%.
Regional analysis shows that in Eastern Europe the difference between the unhealthy and
healthy amounts to 11 percentage points for frequent loneliness, and in Northern Europe,
7 percentage points. This is to be expected, in particular if health problems are linked
with reduced functional capacities. Health and social welfare systems may have a role to
play in offering services to support lonely or socially isolated individuals with health issues.
Finally, on the full sample, religion seems to protect against loneliness to some extent
and against social isolation, whereas differences in loneliness and social isolation between
individuals in urban and rural areas are marginal. The former is probably due to the fact
that attending religious services helps maintaining or even enhancing social ties between
individuals who share common values and a sense of belonging to a similar community
(Rote et al, 2013; Lim Putnam, 2010). We note, however, that the magnitude of the
14Figure 6: Drivers of Loneliness and Social Isolation – full sample
Note:Figure based on the estimates reported in columns (1) of Tables 4-5 in the Appendix. The figure
only displays a selected set of coefficients.
effect is very low and not uniform across macro-regions.
When we group the covariates included in equation (1) into 6 broad categories (socio-
economic status, health status, demographic characteristics, household characteristics,
religious beliefs and localization) in order to measure the relative contribution of each of
them to the model’s total explanatory power, some interesting patterns emerge. As shown
in Figure 8, the household characteristics of the respondents contribute substantially to
loneliness (37.6%) whereas, in comparison, they do not explain much of the explained
variability of social isolation.
This is also confirmed for the macro regions except Northern Europe. Similarly, a com-
paratively large share of the variation in loneliness is driven by the health status of the
respondents (24.6%). This is particularly striking in Northern Europe where we find that
35.5% of the R2 in the loneliness equation is driven by differences in health status against
10.1% when yict measures social isolation. On the contrary, demographic characteris-
tics explain twice as much variation across the sample in social isolation (10.3%) than
in frequent loneliness (5%). This confirms what we already discussed earlier: ageing as
well as the other demographics characteristics to a certain extent (gender, citizenship,
15Figure 7: Drivers of Loneliness (top panel) and Social Isolation (bottom panel)
(a) Loneliness
(b) Social Isolation
Note: The Figures are based on the estimates reported in columns (2-6) of Table 4 (top panel) and Table
5 (bottom panel) in the Appendix. The figures only displays a selected set of coefficients.
16Figure 8: Relative importance of risk factors for Loneliness (top panel) and Social Isolation
(bottom panel)
(a) Loneliness
(b) Social Isolation
Note: Each category includes the following covariates: (i) demographic characteristics (age, gender, citi-
zenship), (ii) socioeconomic status (education, labour market status, occupation, income), (iii) household
characteristics (living arrangements, marital status presence of children), (iv) health status, (v) localiza-
tion (country fixed effects, living area indicator) and (vi) religious beliefs. Taken together the covariates
explain about 11% of the total variance in loneliness and social isolation.
17migration background) are associated with a number of challenges (poor health, income
difficulties, loss of loved ones, shrinking network, etc.). Once this is accounted for, the
demographic characteristics of the respondents do not matter much. Overall, the socio-
economic characteristics of the respondents contribute to almost one fifth to one fourth
of the explainable variance in frequent loneliness and social isolation. The socio-economic
conditions matter in all macro EU regions.
Finally, the geographical location explains more than 50% of the explained variance of
social isolation whilst it explains less than 10% of the R 2 in the loneliness equation. This
highlights that a large part of the variability in social isolation is due to country-specific
characteristics, i.e., social participation is largely shaped by the socio-cultural country
context.
5 Conclusion
The purpose of this paper is to offer a comparative overview of the incidence and determi-
nants of loneliness and social isolation in Europe in the pre-COVID-19 period. Data from
the European Social Survey are used to investigate the risk factors for social isolation
(over the 2002-2018 period) and loneliness (2006-2014).
The descriptive results indicate that 8.6% of the adult population in Europe suffer from
frequent loneliness and 20.8% from social isolation, with eastern Europe recording the
highest prevalence of both phenomena. No significant changes are observed in the inci-
dence of social isolation over the period of the study.
The empirical analysis shows that favourable economic circumstances protect against
loneliness and social isolation, while living alone and poor health constitute important
loneliness risk factors. Although social isolation increases with age, the elderly do not
report more frequent feelings of loneliness than other age groups, all other things being
equal. The relative contributions of the set of objective circumstances included in the
empirical analysis — demographic characteristics, socio-economic conditions, living ar-
rangements, health status, religious beliefs and geographical location — to loneliness and
social isolation vary substantially. Geographical location contributes to more than 50%
of the explained variance in social isolation but less than 10% of the variability of lone-
liness. At the same time, the health status and household characteristics of respondents
18contribute substantially to loneliness, but do not explain much of the variability of social
isolation.
Data limitations precluded an investigation of the role of social media in protecting against
or increasing the risk of social isolation and loneliness. However, this is certainly some-
thing that needs to be addressed in future pan-European studies on loneliness. Future
research should also examine whether loneliness influences civic behaviour and, more
broadly, attitudes towards others and general trust, two important components in the
functioning of liberal democracies.
Social connections are critical in our daily lives. The distress experienced worldwide over
the past year is, in part, driven by limitations on social interactions. The forced social
distancing experienced since March 2020 and the economic effects of the pandemic are
likely to have long-term consequences. A forthcoming study will evaluate the extent
to which the current situation has exacerbated the problems of those who were already
lonely and whether the composition of the population most at risk of social isolation and
loneliness has changed during this unprecedented period.
19Bibliography
Allcott H, Braghieri L, Eichmeyer, S. and M. Gentzkow (2020). The Welfare Effects
of Social American Economic Review,110(3), 629-76. Andersson, L. (1998). Loneliness
research and interventions: A review of the literature. Aging and Mental Health 2 (4),
264-274.
Barreto, M., C. Victor, C. Hammond, A. Eccles, M. T. Richins, and P. Qualter (2021).
Loneliness around the world: Age, gender, and cultural differences in loneliness, Person-
ality and Individual Differences, 169, 1-6.
Beyens I, Pouwels JL, van Driel II, Keijsers L, Valkenburg PM (2020). The effect of
social media on well-being differs from adolescent to adolescent. Sci Rep. 2020 Jul 1;10(1)
:10763.
Buecker, S., Horstmann, K.T., Krasko, J., Kritzler, S., Terwiel, S., Kaiser T., Luh-
mann, M., (2020) Changes in daily loneliness for German residents during the first four
weeks of the COVID-19 pandemic, Social Science & Medicine 265, 113541.
Cacioppo, J. T., Hughes, M. E., Waite, L. J., Hawkley, L. C. and R. A. Thisted
(2006). Loneliness as a specific risk factor for depressive symptoms: cross-sectional and
longitudinal analyses. Psychology and Aging 21 (1), 140-151.
Cacioppo, J. T. and W. Patrick (2008). Loneliness: Human nature and the need for
social connection. New York: W. W. Norton & co.
Cacioppo, J. T., Hawkley, L. C., Ernst, J. M., Burleson, M., Berntson, G. G., Nouri-
ani, B., and Spiegel, D. (2006) Loneliness within a nomological net: An evolutionary
perspective, Journal of Research in Personality, 40(6), 1054-1085.
Yuan Chen, H., Cacioppo, S., (2017) Reciprocal Influences Between Loneliness and
Self-Centeredness: A Cross-Lagged Panel Analysis in a Population-Based Sample of
African American, Hispanic, and Caucasian Adults, Personality and Social Psychology
Bulletin, https://journals.sagepub.com/toc/psp/43/843(8): 1125-1135.
Cohen-Mansfield, J., Shmotkin, D. and S. Goldberg (2009). Loneliness in old age:
longitudinal changes and their determinants in an Israeli sample. International Psy-
chogeriatrics 21 (6), 1160-1170.
Crenna-Jennings (2021).Young people’s mental and emotional health, EPI & Prince’s
Trust
De Jong Gierveld, J. and F. Kamphuis (1985). The development of a Rasch-type
loneliness scale. Applied Psychological Measurement 9 (3), 289-299.
De Jong Gierveld, J. and C. Tesch-Römer (2012). Loneliness in old age in Eastern
and Western European societies: Theoretical perspectives. European Journal of Ageing
209 (4), 285-295.
De Jong Gierveld, J. and T. G. Van Tilburg (2006). A 6-item scale for overall, emo-
tional, and social loneliness: Confirmatory tests on survey data. Research on Aging 28 (5),
582-598.
De Jong Gierveld, J. and T. G. Van Tilburg (2010). The De Jong Gierveld short scales
for emotional and social loneliness: Tested on data from 7 countries in the UN generations
and gender surveys. European Journal of Ageing 7 (2), 121-130.
De Jong Gierveld, J., Van Tilburg, T. G. and P. A. Dykstra (2016). Loneliness and
Social Isolation. In Vangelisti, A. and D. Perlman, The Cambridge Handbook of Personal
Relationships, second edition. Cambridge: Cambridge University Press.
Dykstra, P. A. (2009). Older adult loneliness: Myths and realities. European Journal
of Ageing 6 (2), 91-100.
Ernst, J. M. and J. T. Cacioppo (1999). Lonely hearts: Psychological perspectives on
loneliness. Applied and Preventive Psychology 8 (1), 1-22.
Fokkema, T., De Jong Gierveld, J. and P. A. Dykstra (2012). Cross-national differ-
ences in older adult loneliness. The Journal of Psychology 146 (1-2), 201-228.
Gromping U (2006). relaimpo: Relative Importance of Regressors in Linear Models:
the package relaimpo, Journal of Statistical Software 17(1).
Gromping U (2015). Variable importance in regression models, Computational statis-
tics, Feb, 137-152.
Hansen, T. and B. Slagvold (2015). Late-life loneliness in 11 European countries:
Results from the Generations and Gender Survey. Social Indicators Research 124 (1),
1-20.
Hawkley, L. C. and J. T. Cacioppo (2010). Loneliness matters: A theoretical and
empirical review of consequences and mechanisms. Annals of Behavioral Medicine 40 (2),
218-227.
Hawkley, L. C., Hughes, M. E., Waite, L. J., Masi, C. M., Thisted, R. A. and J. T.
Cacioppo (2008). From social structural factors to perceptions of relationship quality
and loneliness: The Chicago health, aging, and social relations study. The journals of
gerontology. Series B, Psychological sciences and social sciences 63 (6), S375-S384.
Hawkley, L.C., Thisted, R. A. and J. T. Cacioppo (2009). Loneliness predicts reduced
physical activity: Cross-sectional and longitudinal analyses. Health Psychology 28 (3),
354-363.
Hawkley, L. C., Thisted, R. A., Masi, C. M. and J. T. Cacioppo (2010). Loneliness
predicts increased blood pressure: Five-year cross-lagged analyses in middle-aged and
21older adults. Psychology and Aging 25 (1), 132-141.
Hertz, N., (2020) The Lonely Century: Coming Together in a World That’s Pulling
Apart, Sceptre eds. 352 pages.
Holt-Lunstad, J., Smith, T. B., Baker, M., Harris, T. and D. Stephenson (2015).
Loneliness and social isolation as risk factors for mortality: A meta-analytic review. Per-
spectives on Psychological Science 10 (2), 227-237.
Holwerda, T. J., Beekman, A. T. F., Deeg, D. J. H., Stek, M. L., Van Tilburg, T.
G., Visser, P. J., Schmand, B., Jonker C. and R. A. Schoevers (2012). Increased risk of
mortality associated with social isolation in older men: only when feeling lonely? Results
from the Amsterdam Study of the Elderly (AMSTEL). Psychological Medicine 42 (4),
843-853.
Hughes, M. E., Waite, L. J., Hawkley, L. C. and J. T. Cacioppo (2004). A short scale
for measuring loneliness in large surveys: Results from two population-based studies.
Research on Aging 26 (6), 655-672.
Jung. E.H. and S. S. Sundar (2021) Older Adults’ Activities on Facebook: Can
Affordances Predict Intrinsic Motivation and Well-Being? Health Communication, Jan
4:1-11.
Jylhä, M. (2004). Old age and loneliness: Cross-sectional and longitudinal analyses in
the Tampere Longitudinal Study on Aging. Canadian Journal on Aging 23 (2), 157-168.
Luhmann, M. and L. C. Hawkley (2016). Age differences in loneliness from late
adolescence to oldest old age. Developmental Psychology 52 (6), 943-959.
Lim, C., & Putnam, R. (2010). Religion, social networks, and life satisfaction. Amer-
ican Sociological Review, 75, 914 – 933 .
Mattila, M., Rapeli, L., Wass, H. and P. Söderlund (2017). Health and Political
Engagement (Routledge Research in Comparative Politics). Routledge.
Nowland, R., Necka, E.A. and J. Cacioppo (2018) Loneliness and Social Internet Use:
Pathways to Reconnection in a Digital World? Perspectives on Psychological Science, 13
(1). pp. 70-87.
Nicolaisen, M. and K. Thorsen (2014). Who are lonely? Loneliness in different age
groups (18-81 years old), using two measures of loneliness. The International Journal of
Aging and Human Development 78 (3), 229-257.
Penning, M.J., Liu, G., and P.H.B Choi (2014) Measuring Loneliness Among Middle-
Aged and Older Adults: The UCLA and de Jong Gierveld Loneliness Scales. Social
Indicator Research, 118, 1147–1166
Perlman, D. and L. A. Peplau (1984). Loneliness research: A survey of empirical
22findings. In Peplau, L. A. and S. Goldston, Preventing the harmful consequences of severe
and persistent loneliness (pp. 13-46). Rockville, MD, US: National Institute of Mental
Health.
Pinquart, M. and S. Sörensen (2001). Influences on loneliness in older adults: A
meta-analysis. Basic and Applied Social Pscyhology 23 (4), 245-266.
Pittman, P. and B. Reich (2016). Social media and loneliness: Why an Instagram pic-
ture may be worth more than a thousand Twitter words, Computers in Human Behavior,
62, 155-167.
Reher, D. S. (1998). Family ties in Western Europe: Persistent contrasts. Population
and Development Review 24 (2), 203-234.
Rote S, Hill TD, Ellison CG. Religious attendance and loneliness in later life. Geron-
tologist. 2013; 53(1):39-50.
Russell, D. W. (1996). UCLA Loneliness Scale (Version 3): Reliability, validity, and
factor structure. Journal of Personality Assessment 66 (1), 20-40.
Saltkjel, T., Dahl, E. and K. A. Van Der Wel (2013). Health related social exclusion
in Europe: A multilevel study of the role of welfare generosity. International Journal for
Equity in Health 12 (1), 1-11.
Sundström, G., Fransson, E., Malmberg, B. and A. Davey (2009). Loneliness among
older Europeans. European Journal of Ageing 6 (4), 267-275.
Twenge, Jean M., Brian H. Spitzberg, W. Keith Campbell (2019). Less in-person
social interaction with peers among U.S. adolescents in the 21st century and links to
loneliness. Journal of Social and Personal Relationships, 36 (6), 1892-1913.
Weiss, R. S. (1973). Loneliness: The experience of emotional and social isolation.
Cambridge, MA, US: The MIT Press.
Yang, K. and C. Victor (2011). Age and loneliness in 25 European nations. Ageing
and Society 31 (8), 1368-1388.
23Table 2: Construction of variables and summary statistics
Variable Original question Original answers New categories
ISCED I (less than lower secondary)
ISCED II (lower secondary)
What is the highest level of ISCED IIIb (lower tier upper secondary) No tertiary education (0)
education you have successfully
Tertiary education ISCED IIIa (upper tier upper secondary)
completed? ISCED IV (advanced vocational, sub-degree)
ISCED V1 (lower tertiary, BA level)
Tertiary education (1)
ISCED V2 (higher tertiary, >=MA level)
Male (0)
Gender Coded by interviewers -
Female (1)
Legally married
In a legally registered civil union
[…] Which one of the descriptions
Legally separated Not widowed (0)
Marital status on this card describes your legal
Legally divorced/civil union dissolved
marital status now?
None of these (never married or in civil union)
Widowed/civil partner died Widowed (1)
Living with children in Living with children (0)
Coded by interviewers -
household Living without children (1)
Living with partner in Living with partner (0)
Coded by interviewers -
household Living without partner (1)
A big city
Suburbs or outskirts of a big city Urban (0)
Which phrase on this card best
Living area Town or small city
describes the area where you live?
Country village
Rural (1)
Farm or home in countryside
Migrant status Were you born in [country]? -
Not born in country (1)
18-25 (1)
And in what year were you born? 26-45 (2)
Age group Age calculated based on year of birth
46-64 (3)
65+ (4)
What is/was the name or title of
your main job? In your main job, Managers and professionals (1)
what kind of work do/did you do Technicians (2)
Occupation group most of the time? What training or Categories as given by ISCO-88 and ISCO-08 Workers (3)
qualifications are/were needed for Elementary Occupations (4)
the job?
None (5)
Paid Work Employed (1)
Education In education (2)
And which of these descriptions Permanently sick or disabled
Labour market status best describes your situation (in Retired Not in labour force (3)
the last seven days)? Housework, looking after children, others
Unemployed, looking for job
Unemployed (4)
Unemployed, not looking for job
Community or military service Not considered (-)
Living comfortably on present income Living comfortably
[…]Which of the descriptions on Coping on present income Coping on present income
this card comes closest to how Finding it difficult on present
Household income Finding it difficult on present income
you feel131 about your income
household’s income nowadays? Finding it very difficult on present
Finding it very difficult on present income
income
Very Good
Good (1)
Good
How is your health in general?
Health status Fair Fair (2)
Would you say it is ...
Bad
Bad (3)
Very Bad
Roman Catholic Religous
Protestant
Eastern Orthodox
Do you consider yourself as
Other Christian denomination
belonging to any particular
Religion Jewish
religion or denomination? If yes,
Islamic
which one?
Eastern religions
Other non-Christian religions
None Not religious
Regardless of whether you belong
to a particular religion, how 0 (not religious at all) 1, 2, 3
Religious intensity Religious intensity high (7-10)
religious would you say you are? ….10 (Very religious)
Notes: For frequent loneliness ESS waves 5 (2010), 6 (2012), 7 (2014) and 9 (2018) are pooled together. For social isolation, all 9 ESS waves are
pooled togetherTable 3: Explanatory variables - summary statistics
Table 4: Determinants of frequent loneliness Note: European Social Survey – 2006, 2010, 2012 and 2014. Time and country fixed effects are included in all estimates..Standard errors in parentheses - * p < 0.10, ** p < 0.05, *** p < 0.01. Data weighted by post-stratification weights and population size weights.
Table 5: Determinants of social isolation Note: European Social Survey – 2002-2018. Time and country fixed effects are included in all estimates. Standard errors in parentheses - * p < 0.10, ** p < 0.05, *** p < 0.01. Data weighted by post-stratification weights and population size weights.
Figure A1: Feeling of loneliness - frequency Figure A2: Meeting socially with friends, relatives or work colleagues - frequency
Table 2: Construction of variables and summary statistics
Variable Original question Original answers New categories
ISCED I (less than lower secondary)
ISCED II (lower secondary)
What is the highest level of ISCED IIIb (lower tier upper secondary) No tertiary education (0)
education you have successfully
Tertiary education ISCED IIIa (upper tier upper secondary)
completed? ISCED IV (advanced vocational, sub-degree)
ISCED V1 (lower tertiary, BA level)
Tertiary education (1)
ISCED V2 (higher tertiary, >=MA level)
Male (0)
Gender Coded by interviewers -
Female (1)
Legally married
In a legally registered civil union
[…] Which one of the descriptions
Legally separated Not widowed (0)
Marital status on this card describes your legal
Legally divorced/civil union dissolved
marital status now?
None of these (never married or in civil union)
Widowed/civil partner died Widowed (1)
Living with children in Living with children (0)
Coded by interviewers -
household Living without children (1)
Living with partner in Living with partner (0)
Coded by interviewers -
household Living without partner (1)
A big city
Suburbs or outskirts of a big city Urban (0)
Which phrase on this card best
Living area Town or small city
describes the area where you live?
Country village
Rural (1)
Farm or home in countryside
Migrant status Were you born in [country]? -
Not born in country (1)
18-25 (1)
And in what year were you born? 26-45 (2)
Age group Age calculated based on year of birth
46-64 (3)
65+ (4)
What is/was the name or title of
your main job? In your main job, Managers and professionals (1)
what kind of work do/did you do Technicians (2)
Occupation group most of the time? What training or Categories as given by ISCO-88 and ISCO-08 Workers (3)
qualifications are/were needed for Elementary Occupations (4)
the job?
None (5)
Paid Work Employed (1)
Education In education (2)
And which of these descriptions Permanently sick or disabled
Labour market status best describes your situation (in Retired Not in labour force (3)
the last seven days)? Housework, looking after children, others
Unemployed, looking for job
Unemployed (4)
Unemployed, not looking for job
Community or military service Not considered (-)
Living comfortably on present income Living comfortably
[…]Which of the descriptions on Coping on present income Coping on present income
this card comes closest to how Finding it difficult on present
Household income Finding it difficult on present income
you feel131 about your income
household’s income nowadays? Finding it very difficult on present
Finding it very difficult on present income
income
Very Good
Good (1)
Good
How is your health in general?
Health status Fair Fair (2)
Would you say it is ...
Bad
Bad (3)
Very Bad
Roman Catholic Religous
Protestant
Eastern Orthodox
Do you consider yourself as
Other Christian denomination
belonging to any particular
Religion Jewish
religion or denomination? If yes,
Islamic
which one?
Eastern religions
Other non-Christian religions
None Not religious
Regardless of whether you belong
to a particular religion, how 0 (not religious at all) 1, 2, 3
Religious intensity Religious intensity high (7-10)
religious would you say you are? ….10 (Very religious)
Notes: For frequent loneliness ESS waves 5 (2010), 6 (2012), 7 (2014) and 9 (2018) are pooled together. For social isolation, all 9 ESS waves are
pooled togetherYou can also read