IMPACT-BASED FORECASTING FOR THE COASTAL ZONE: EAST COAST LOWS
←
→
Page content transcription
If your browser does not render page correctly, please read the page content below
IMPACT-BASED FORECASTING FOR THE
COASTAL ZONE: EAST COAST LOWS
Final project report

Harald Richter1,3, Craig Arthur2,3, David Wilke1,3, Mark Dunford2,3, Martin
Wehner2,3, Beth Ebert1,3

1Bureau     of Meteorology, Melbourne, 2Geoscience Australia, Canberra,
3Bushfire   and Natural Hazards CRC
IMPACT-BASED FORECASTING FOR THE COASTAL ZONE: EAST COAST LOWS – FINAL PROJECT REPORT | REPORT NO. 647.2021

  Version        Release history                                   Date

  1.0            Initial release of document                       02/03/2021

 © Bushfire and Natural Hazards CRC 2021

 All material in this document, except as identified below, is licensed under the
 Creative Commons Attribution-Non-Commercial 4.0 International Licence.

 Material not licensed under the Creative Commons licence:
       •     Department of Industry, Science, Energy and Resources logo
       •     Cooperative Research Centres Programme logo
       •     Bushfire and Natural Hazards CRC logo
       •     All other logos
       •     All photographs, graphics and figures

 All content not licenced under the Creative Commons licence is all rights reserved.
 Permission must be sought from the copyright owner to use this material.

 Disclaimer:
 The Bureau of Meteorology, Geoscience Australia and the Bushfire and Natural
 Hazards CRC advise that the information contained in this publication comprises
 general statements based on scientific research. The reader is advised and needs to
 be aware that such information may be incomplete or unable to be used in any
 specific situation. No reliance or actions must therefore be made on that information
 without seeking prior expert professional, scientific and technical advice. To the extent
 permitted by law, the Bureau of Meteorology, Geoscience Australia and the Bushfire
 and Natural Hazards CRC (including its employees and consultants) exclude all liability
 to any person for any consequences, including but not limited to all losses, damages,
 costs, expenses and any other compensation, arising directly or indirectly from using
 this publication (in part or in whole) and any information or material contained in it.

 Publisher:
 Bushfire and Natural Hazards CRC

 March 2021

 Citation: Richter H, Arthur C, Wilke D, Dunford M, Wehner M & Ebert B (2021) Impact-
 based forecasting for the coastal zone: East Coast Lows - final project report, Bushfire
 and Natural Hazards CRC, Melbourne.

 Cover: Picture illustrating wind & rain hazards. Source: Harald Richter

                                                                           1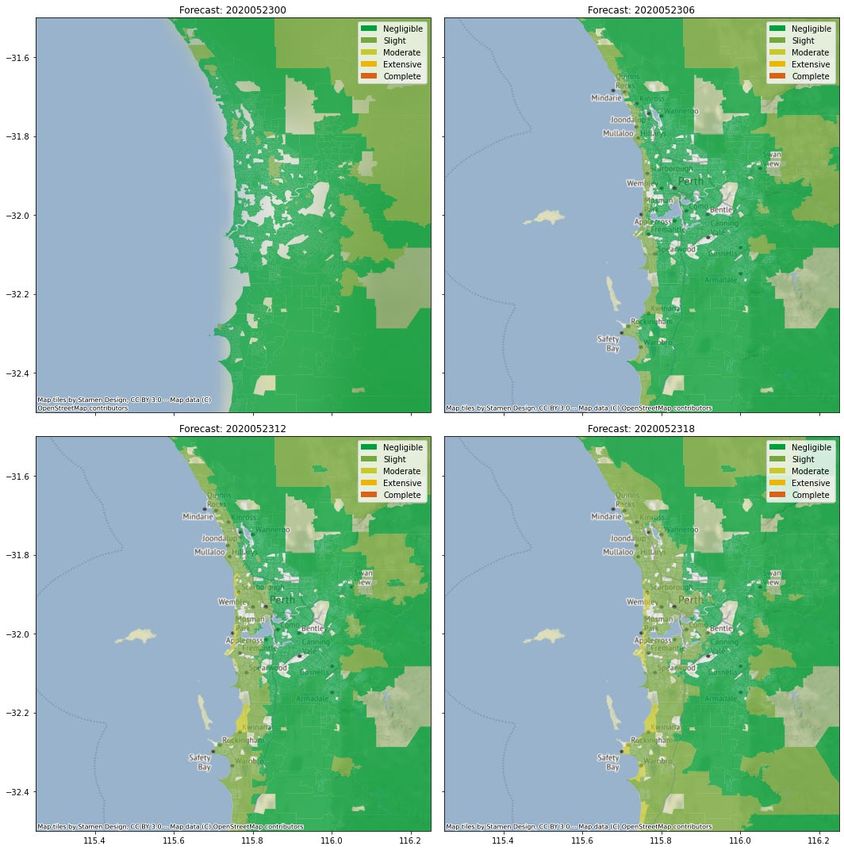
IMPACT-BASED FORECASTING FOR THE COASTAL ZONE: EAST COAST LOWS – FINAL PROJECT REPORT | REPORT NO. 647.2021

TABLE OF CONTENTS
ACKNOWLEDGMENTS                                                                                               5

EXECUTIVE SUMMARY                                                                                             6

END-USER PROJECT IMPACT STATEMENT                                                                              8

PRODUCT USER TESTIMONIALS                                                                                     9

INTRODUCTION                                                                                                  10

DATA & METHODS                                                                                                12
Hazard data                                                                                                   12
Vulnerability data                                                                                            15
Exposure data                                                                                                 16
The workflow                                                                                                  17

FINDINGS / KEY MILESTONES                                                                                     19
Project glossary                                                                                              19
Workflow setup                                                                                                20
Derivation of case-specific vulnerability relationships for the Dungog case                                   20
Case-specific vulnerability relationships for Dungog NSW: multi-hazard impacts                                21
Case-specific exposure data for Dungog NSW: statistically derived data                                        23
Workflow established                                                                                          24
Request for more detailed damage assessment data                                                              25
Demonstration for extreme weather desk forecasters                                                            25
First milestone variation                                                                                     25
Identification of additional wind & rain-producing events                                                     25
Systematic production of hazard grids                                                                         26
Preliminary rain impact model workflow                                                                        27
Project joined WMO Task Team                                                                                  28
Revision of selected asset class for impact modelling                                                         28
Testing a twin-hazard predictor for wind and rain                                                             29
Perth RAF & DFES-hosted end-user workshop                                                                     30
Refined validation methodology developed and indicative results generated for the
wind impact model                                                                                             31
Impact forecasting review paper submitted to AJEM                                                             34
Extend wind impact forecast pilot to allow multiple forecast lead times                                       36
Some international perspectives on impact forecasting                                                         37
Second end-user workshop on 25 and 27 August 2020                                                             38
Summary                                                                                                       39

UTILISATION, IMPACT AND POTENTIAL NEXT STEPS                                                                  42
Summary                                                                                                       42
Output title                                                                                                  42
Other opportunities                                                                                           42

PUBLICATIONS LIST                                                                                             43
Journal publications                                                                                          43
Conference proceedings – papers                                                                               43
Invited conference presentations                                                                              43
International conferences                                                                                     43

                                                                3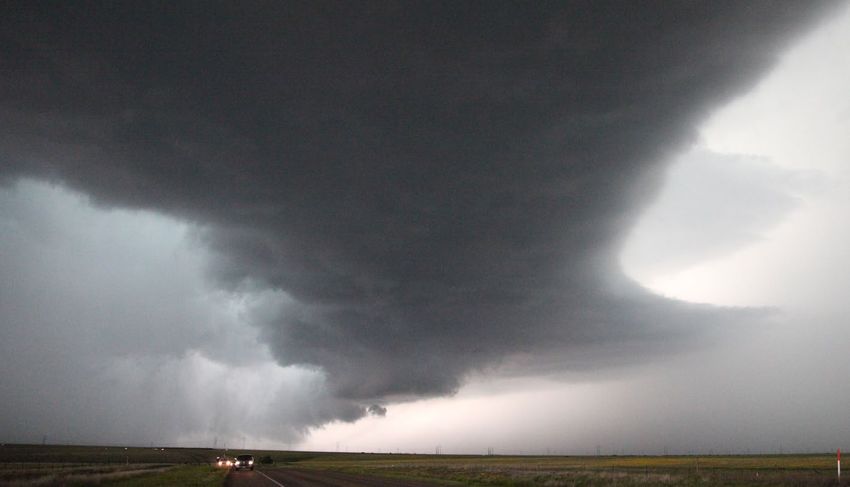
IMPACT-BASED FORECASTING FOR THE COASTAL ZONE: EAST COAST LOWS – FINAL PROJECT REPORT | REPORT NO. 647.2021

Research Advisory Forums                                                                                      44
Australian Meteorological and Oceanographic Society (AMOS) annual conferences                                 44
AFAC/BNHCRC conferences                                                                                       44
Bureau Annual Modelling workshop, November 2018                                                               45
Bureau of Meteorology seminars                                                                                45
ASWA annual conference                                                                                        45

TEAM MEMBERS                                                                                                  46
Research team                                                                                                 46
End-users                                                                                                     46

REFERENCES                                                                                                    48

APPENDIX A: SUMMARY OF DELIVERED MILESTONES                                                                   49

                                                                4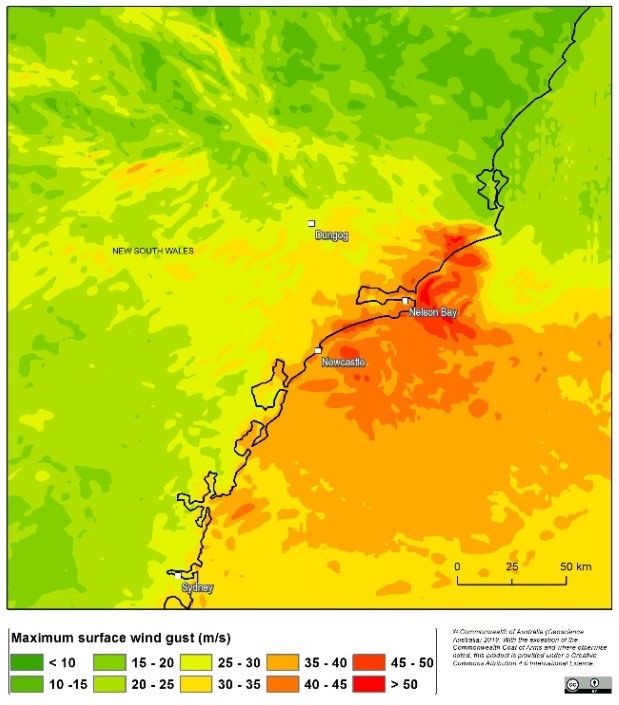
IMPACT-BASED FORECASTING FOR THE COASTAL ZONE: EAST COAST LOWS – FINAL PROJECT REPORT | REPORT NO. 647.2021

ACKNOWLEDGMENTS
The project is grateful to Anthony Day and Simon Gethin from the NSW SES for
the provision of the BEACON damage assessment data for the 20-22 April 2015
East Coast Low event, and to John Moore from FRNSW for the provision of the
EICU dataset for the same event.

                                                                5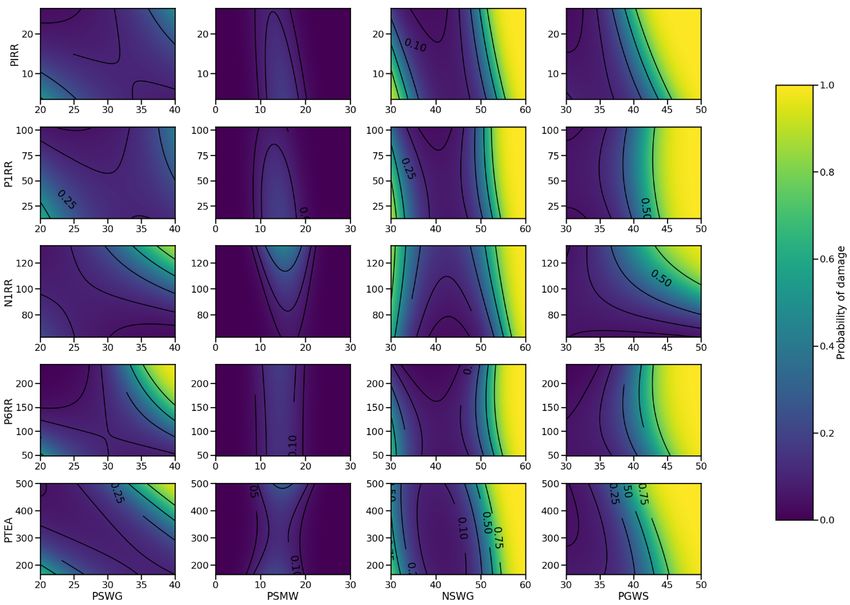
IMPACT-BASED FORECASTING FOR THE COASTAL ZONE: EAST COAST LOWS – FINAL PROJECT REPORT | REPORT NO. 647.2021

EXECUTIVE SUMMARY
The Bushfire and Natural Hazards CRC project Impact-based forecasting for the
coastal zone: East-Coast Lows set out in 2017 to demonstrate a pilot capability
to deliver wind and rain impact forecasts for residential housing from an
ensemble of weather prediction models runs. The project was a collaborative
effort between the Australian Bureau of Meteorology (Bureau) and Geoscience
Australia (GA).
The project was initially focused on the wind and rainfall impact from the 20-22
April 2015 east coast low event in New South Wales (Wehner and Maqsood 2015).
The wind and rainfall hazard data were provided by a 24-member ensemble of
the Australian Community Climate Earth System Simulator (ACCESS; Bureau of
Meteorology 2018) model on a 1.3 km grid, with damage data provided by NSW
State Emergency Services (SES) and the Emergency Information Coordination
Unit (EICU. Exposure data were sourced from the National EXposure Information
System (NEXIS; Nadimpalli et al. 2007; Power et al. 2017) at GA. Heuristic wind
vulnerability functions, derived in a previous project, were also provided by GA,
while no large-scale rain vulnerability relationships existed.
Through the utilisation of GA’s HazImp software, we developed and tested a
workflow that integrated the numerical weather forecasts, vulnerability
relationships and exposure data at the community level, and early in the second
year of the project we started producing the first spatial quantitative wind
impact plots.
The multi-hazard nature of the east coast low event, the relatively low wind
speeds relative to the design wind speeds for the affected residential buildings
and the available damage assessment data made attributing the observed
building damage to a single hazard such as wind or rain difficult. Wind damage
to residential housing in this case was largely due to tree fall, as opposed to
structural failure, while the most severe damage for the Dungog event was due
to flood inundation. To increase the utility of the damage assessment data we
recommended early in our project that the SES/EICU damage survey templates
should record multiple damage states and linkages between damage and the
associate hazard(s). Such expanded recording practices would lead to
improvements in the development of the hazard-damage relationships, a
requirement for progress in quantitative hazard impact modelling. Additional
uncertainty arose through the NEXIS exposure data which are statistically inferred
at the Dungog township and are therefore merely indicative of the actual
building attributes.
During the second year of the project a range of scope reductions were
introduced in response to our previous and emerging findings during this second
year.
    • The uncertainty in the exposure and vulnerability information and arising
       difficulties in verifying the quantitative wind impact forecasts against
       compatible damage assessment data precluded us from a more detailed

                                                                6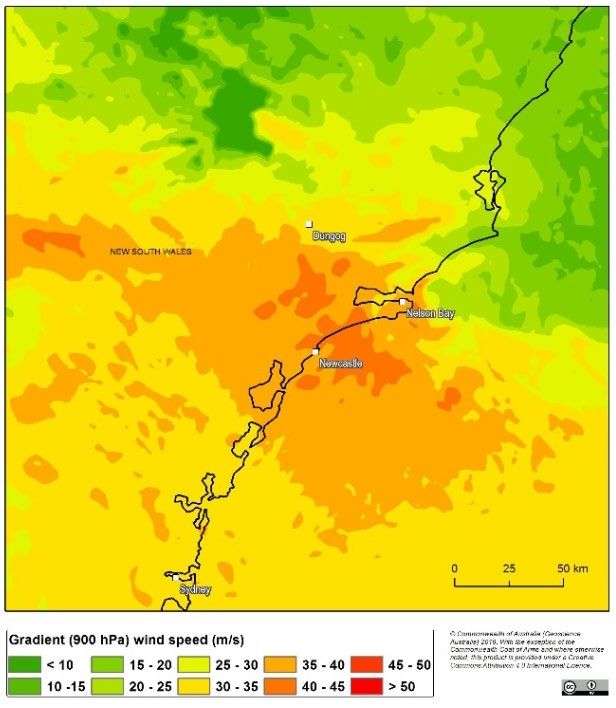
IMPACT-BASED FORECASTING FOR THE COASTAL ZONE: EAST COAST LOWS – FINAL PROJECT REPORT | REPORT NO. 647.2021

          exploration of the wind forecast uncertainties afforded by the 24-member
          ACCESS ensemble. The project switched to source its wind information
          mainly from the 1.5 km BARRA-SY reanalysis as the most accurate high
          resolution wind data source available.
     •    Attempts to derive rain damage vulnerability relations were stifled by
          extreme sensitivity of our results to any variation in the rain inputs. A
          decision was made to focus solely on the better defined wind impacts.
     •    We attempted to apply the wind impact prediction system to a number
          of other wind damage events such as the December 2015 Kurnell tornado
          event near Sydney. The number of viable cases was low to begin with, as
          these required the co-availability of high resolution reanalysis wind data
          (limited spatial domains within Australia) and high quality damage
          assessment data (limited to more recent years). However, all of the
          available cases that satisfied the reanalysis and damage data restrictions
          still suffered from limited wind predictability given that the highest wind
          speeds in these events were driven by small-scale meteorological
          processes that cannot be predicted accurately in space and time.
The project set up the end-to-end workflow from wind hazard to spatial impact.
These spatial impact outputs were delivered into the Visual Weather system at
the Bureau of Meteorology, foreshadowing the possibility of easily achievable
future visualisation to operational meteorologists.
To evaluate the performance of the quantitative wind impact forecast that we
had produced, very careful and detailed processing of the available damage
data was needed to remove damage reports due to tree fall, as opposed to
structural failure, rain ingress, and flood inundation. We have now shown that the
inclusion of exposure and vulnerability information can outperform a wind
impact forecast that only uses a plain wind hazard prediction. In other words, the
Dungog case study suggests that the extra effort needed for the quantitative
inclusion of exposure and vulnerability information is a promising approach in the
pursuit of future quantitative impact forecasts in Australia.
To gain a better understanding of how other agencies have approached the
wind impact prediction problem, we also conducted an extensive literature
search which resulted in a selective summary of meteorological hazard impact
prediction systems. These findings have been submitted to the Australian Journal
of Emergency Management as a review paper.
We finally applied our impact forecast methodology to a second extreme
weather case during May 2020 in Perth. An extra-tropical cyclone produced
widespread wind damage with wind gusts in excess of 100 km/h recorded over
many hours. In this case we found that wind impact forecasts are sensitive to the
fluctuations in wind gust forecasts produced by the Bureau’s high-resolution real-
time weather prediction models. Alongside the multi-hazard nature of damage
to residential buildings, this impact sensitivity to the hazard constitutes a second
complication for the quantitative prediction of wind impacts.

                                                                7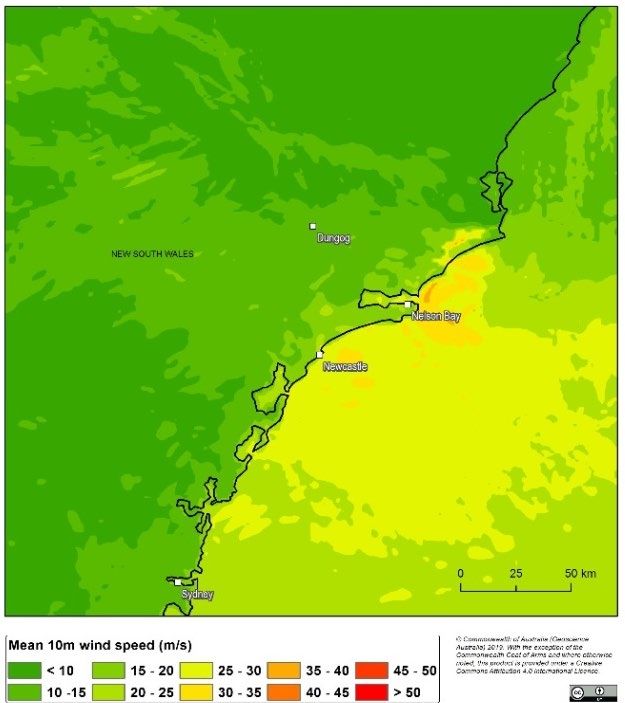
IMPACT-BASED FORECASTING FOR THE COASTAL ZONE: EAST COAST LOWS – FINAL PROJECT REPORT | REPORT NO. 647.2021

END-USER PROJECT IMPACT STATEMENT
Simon Louis, NSW Regional Office, Bureau of Meteorology

A core pillar of the mission of the Bureau of Meteorology and our partners in
emergency services is to reduce the loss of life and damage to property in
extreme weather events. Critical to this mission is the ability to provide forecasts
and warnings of weather conditions in a way that facilitates effective decision
making by officials and members of the public. These decisions can range from
the type of language used in public messaging, to pre-positioning of emergency
response teams, to tactical decisions made by on-the-ground responders.
Fundamental to this decision-making process is the ability to match up
intelligence about likely weather conditions with knowledge about risks and
vulnerabilities in the community.

The work of the Impact Based Forecasting BNHCRC project team is a critical first
step in bridging this gap between hazards associated with weather conditions
and the vulnerability of the community to the hazards. By establishing a proof of
concept approach to combining these two pieces of the puzzle to produce
explicit forecasts of impacts from extreme weather events, this work will lay the
ground work for potential future operational impact based forecasting systems.
A key challenge in designing a system of this type lies in gathering disparate
sources of data and making sure that existing procedures for collecting impact
data are fit for purpose. An important output from the project may include
recommendations on how impact data are collected in future.

It is likely that explicit impact forecasting systems will become a key part of the
tool kit for operational meteorologists and emergency services in the future. I look
forward to the continued work of the BNHCRC team exploring the possibilities in
this area.

                                                                8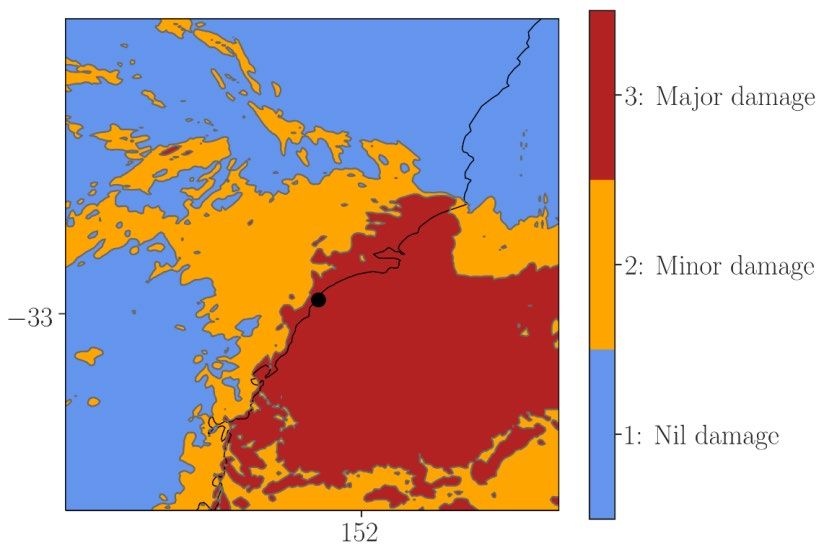
IMPACT-BASED FORECASTING FOR THE COASTAL ZONE: EAST COAST LOWS – FINAL PROJECT REPORT | REPORT NO. 647.2021

PRODUCT USER TESTIMONIALS
Roger Mentha, Fire and Rescue NSW
The project has brought significant research to end-users at both the AFAC
conference in Melbourne and the Research Advisory Forum in Perth. These two
engagements provided opportunity for direct feedback from end-users and the
opportunity to bring the scientific experts and emergency service end-users
together. Presentation of options for utilisations and feedback from end-users on
applying the research to protecting critical infrastructure was beneficial and will
assist year 3 outcomes.

                                                                9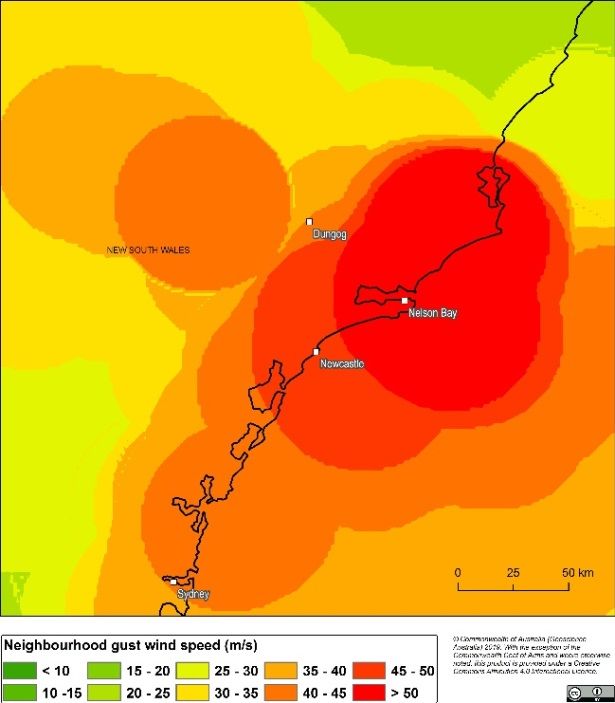
IMPACT-BASED FORECASTING FOR THE COASTAL ZONE: EAST COAST LOWS – FINAL PROJECT REPORT | REPORT NO. 647.2021

INTRODUCTION
Strong surface wind gusts and heavy rain are meteorological hazards that are
predominantly produced by storms such as extratropical cyclones (including
east coast lows), tropical cyclones or thunderstorms. Interest in these hazards
from a response agency point of view lies in their impact on the natural and built
environment. At present, weather forecast models still predict mostly 'raw'
meteorological output such as surface wind speeds at certain times, or rain
accumulations over a specified period. This model output needs to be combined
with exposure and vulnerability information to translate the forecast hazard into
predicted impact.

Weather Services around the world have gradually been shifting their focus from
the delivery of weather and hazard information to value-added information that
better characterises the impacts that such hazards can have. Weather impact
forecasts have matured or are maturing to the point of operational delivery. One
such example is the impact and likelihood matrix employed by the Met Office
Severe Weather Warning Service in the UK (Neal et al. 2014).

The prediction of weather impacts can be accomplished on many levels of
sophistication. A simple approach to estimate impacts is to recast weather
variables produced by a numerical weather prediction model in terms of how
unusual a specific forecast is relative to a reference climatology (Perry 2017). The
implication is that the more unusual an event the more likely it is that the event
has an appreciable impact as community preparedness should scale with the
degree of departure from normal conditions. The other end of the spectrum is
marked by impact prediction models where the effect of a hazard (or interacting
hazards) is quantified in full. Examples of impact models are the Vehicle
Overturning Model (Hemingway and Gunawan 2018) or the Surface Water
Flooding Model (Aldridge et al. 2016). These hazard impact models are
operational or close to operational at the UK Met Office. In-between these two
types of impact estimation approaches are various levels of hazard, exposure
and vulnerability specifications that, to a varying extent, invite the user to
subjectively integrate the various impact drivers (hazards, exposure, vulnerability)
in an attempt to estimate the resulting impact.

As part of the three-year Bushfire and Natural Hazards CRC Project “Impact
forecasting in the coastal zone: East coast lows”, we integrated wind hazard
hindcasts and forecasts with information on vulnerability and exposure to
estimate the wind impact on residential properties. The study aimed to produce
a proof-of-concept system to demonstrate that high-resolution weather forecast
models, exposure data and vulnerability relationship estimates have reached a
stage of maturity that allows for the production of meaningful spatial wind
impact estimates for residential buildings.

The specific aim of this project was to develop a pilot capability to produce
useful spatial impact predictions for residential housing due to extreme wind in
Australia's coastal regions. Such predictions are expected to improve timely

                                                                10
IMPACT-BASED FORECASTING FOR THE COASTAL ZONE: EAST COAST LOWS – FINAL PROJECT REPORT | REPORT NO. 647.2021
mitigating actions by a wide range of stakeholders, in particular the emergency
response agencies. This pilot project focused on the 20-22 April 2015 Dungog east
coast low event as this type of extratropical cyclone often severely impacts the
subtropical east coast of Australia. More widely, these events produce a range
of hazards that are relevant to the coastal zone, i.e. high wind, rain, flooding and
coastal surge and erosion. An east coast low, rather than a tropical cyclone
event, was chosen, in part because the larger size of east coast lows allows for
more reliable wind field predictions by numerical weather prediction models as
utilised in this work. The focus of this project was on the wind and rain hazards,
which was based on user feedback together with the feasibility of combining
relevant hazard forecasts and impact models. Floods are of interest but were not
included in this project because Bureau flood warnings are already addressing
some of the flood impacts which in turn are translated into more local impacts
by individual local councils. More specifically, the project goals included:
• determination of the type of impact information based on the
wind/rain hazard that would be most valuable to end-users
• development and testing of an approach to integrate numerical
weather forecasts, vulnerability relationships and exposure data at the
community level
• development of spatially and temporally varying and meaningful
impact information
• testing of the project approach for a small number of previous events
• determination of how data resolution, availability, etc., constrain the
impact information that could be provided in a future operational
system
• development of a pilot impact-based forecasting system.
11IMPACT-BASED FORECASTING FOR THE COASTAL ZONE: EAST COAST LOWS – FINAL PROJECT REPORT | REPORT NO. 647.2021
DATA & METHODS
The project originally aimed to demonstrate that standard surface wind and
rainfall output fields from a high-resolution (or "convection-allowing”) numerical
weather prediction (NWP) model ensemble can be processed to provide a
useful spatial estimate of wind and rain impact on residential buildings up to two
days in advance. This goal was reduced in scope to focus on the demonstration
of a useful spatial wind impact estimate for residential buildings given wind
hazard prediction from the deterministic Bureau’s ACCESS-City model (or its
attendant reanalysis product such as BARRA-SY, Su et al. 2019 and Su et al. 2021).
This processing chain or workflow requires three fundamental input fields: hazard,
exposure and vulnerability information. A hazard in the project context can be
described as the wind field of a magnitude that is closely related to the essential
causal mechanisms for an impact (in this case damage to a residential building).
Exposure information describes what assets are acted upon by the hazard or
hazards, and vulnerability describes how susceptible an asset is to the actions of
a given hazard. This section describes what data the project sources for its
hazard, exposure and vulnerability estimates, and how these data are processed
to arrive at spatial impact estimates.
FIGURE 1: INTEGRATION OF THE THREE COMPONENTS - HAZARD, EXPOSURE AND VULNERABILITY - TO ARRIVE AT AN ESTIMATE OF IMPACT
HAZARD DATA
The hazard data used in this project is derived from the output of the "City Model"
of the Australian Community Climate Earth System Simulator Australian Parallel
Suite 3 (ACCESS-C3; Bureau of Meteorology 2018). Each cycle, the operational
ACCESS-C3 model produces hourly wind outputs on a 1.5 km horizontal grid out
to about two days in advance. The model runs four cycles per day. We also
12IMPACT-BASED FORECASTING FOR THE COASTAL ZONE: EAST COAST LOWS – FINAL PROJECT REPORT | REPORT NO. 647.2021
utilised near-surface wind estimates from the BARRA-SY reanalysis (Su et al. 2019,
2021) which is also available on a 1.5 km grid. Both, the ACCESS-C3 model and
the high-resolution reanalysis essentially based on the same model, are state-of-
the-art weather prediction / analysis systems that have been tested extensively
at the UK Met Office and at the Australian Bureau of Meteorology. The ACCESS
global model (a coarser resolution version of ACCESS-CE3) ranks among the top
three numerical weather prediction models in the world, and is therefore one of
the best tools for the provision of a reliable and high-quality surface wind field.
The raw model output does not deliver the "best" actual hazard estimate straight
away, but some processing is required first. For example, the basic model wind
output, such as the mean wind at 10-m above ground level (U10m; Fig. 2b), is not
the most suitable estimator for wind damage, given wind damage is more closely
related to wind gusts rather than ~20 minute mean winds. It is therefore useful to
distinguish between raw model output and a related wind hazard specification.
A promising model output variable for estimating wind damage is the ACCESS-
C3 wind gust diagnostic, Ug, derived from the 10-m above ground mean wind
speed, but also factoring in the effects of turbulence such as planetary boundary
layer eddies (Fig. 2d). Ug is calibrated to represent a 3 second gust wind speed
(P. Clarke, pers. comm.), and corresponds closely to the observed gust wind
speed recorded at automatic weather stations. We note that there is still a
residual wind gust time averaging discrepancy between the model output and
the heuristic vulnerability functions (below) which assume an 0.2 sec wind gust.
Apart from the 10-m gust diagnostic Ug and the less suitable 10-m mean wind,
other options exist to sensibly define a wind-based damage proxy or hazard. In
this project we utilised the 900 hPa (“gradient level”, approximately 1-km above
sea level) winds on the assumption that turbulent mixing can transport such winds
to the surface under the right meteorological conditions (Fig. 2a). We also used
a neighbourhood maximum gust wind hazard estimator where every grid box is
set to the maximum wind gust within a 40-km radius (Fig. 2c). Such
neighbourhood maximum concepts are widely used in severe convective
forecasting using convection-allowing models (Roberts et al. 2019; Kain et al.
2010) and take into account spatial uncertainty of where the maximum gusts
may occur.
13IMPACT-BASED FORECASTING FOR THE COASTAL ZONE: EAST COAST LOWS – FINAL PROJECT REPORT | REPORT NO. 647.2021
FIGURE 2: FOUR CHARACTERISATIONS OF WIND HAZARD FOR THE 2015 EAST COAST LOW EVENT, AS SIMULATED IN THE BARRA-SY REANALYSIS
(CLOCKWISE FROM TOP LEFT): POINT GRADIENT WIND SPEED, POINT MEAN WIND SPEED, POINT GUST WIND SPEED AND NEIGHBOURHOOD GUST WIND
SP SPEED. ALL VALUES ARE IN UNITS OF METRES PER SECOND.
The four variants of near-surface wind fields depicted in Fig. 2 allow us to
ascertain how uncertainties in the wind input fields will carry through into
variability in the quantitative wind impact predictions shown later. As a proxy
useful for the prediction of rain ingress, model rainfall accumulations over varying
time periods (10 minutes, 30 minutes; 1 hour; 3 hours; 6 hours, 12 hours and event
maxima) are used as the rain hazard fields.
The project initially considered the inclusion of fine-scale topography, shielding
and terrain roughness information beyond the information available through the
ACCESS-City model, but abandoned that approach based the lack of reliable
national datasets that would be required for the pursuit of a national capability
in wind impact modelling.
14IMPACT-BASED FORECASTING FOR THE COASTAL ZONE: EAST COAST LOWS – FINAL PROJECT REPORT | REPORT NO. 647.2021
VULNERABILITY DATA
Vulnerability is a term used to describe the relationship between severity of
impact on an asset from a hazard of given magnitude. It can be quantified and
expressed through vulnerability of fragility functions. Vulnerability functions relate
average damage suffered by a population of similar assets to hazard
magnitude. Fragility functions relate proportions of a population of similar assets
in different damage states to hazard magnitude. Often, both types of functions
are presented as S-shaped curves although there is no requirement to do so. This
is particularly the case for flood hazard where the required repair increases in a
series of steps as water depth increases.
Vulnerability and fragility functions can be developed by three methods:
heuristic estimation, analytical computation and empirical data. In terms of
measuring damage, or the vertical axis of a vulnerability curve, damage index is
often used as this is a non-dimensional measure of damage which is defined as
repair cost divided by replacement cost. Since it is non-dimensional it can be
applied to any building of the relevant type irrespective of building size.
Vulnerability relationships for the project were originally intended to be derived
from two damage assessment datasets specific to the East Coast Low event this
project focuses on, one provided by the State Emergency Services in NSW (the
BEACON data), and the other by the Fire and Rescue NSW Emergency
Information Coordination Unit (the EICU data). Both damage datasets cover the
20-22 April 2015 East Coast Low impact around the Dungog NSW area. The
BEACON dataset was recorded by SES volunteers and covers the area 35.054oS
≤ lat ≤ 31.193oS and 150.361oE ≤ lon ≤ 152.927oE, where lat and lon are the latitude
and longitude, respectively. It records a range of attributes such as "property
type" or "job received", amongst others. The EICU data was recorded by
employees of the Emergency Information Coordination Unit. The data covers an
area 33.3978oS ≤ lat ≤ 32.3898oS and 151.2658oE ≤ lon ≤ 151.972oE, but unlike the
BEACON data, it also recorded five damage categories. Vulnerability
relationships are derived by plotting the degree of damage reported for
residential buildings against the wind and rain hazard specification based on the
ACCESS-C3 model output.
Given our findings that the 2015 Dungog case did not provide suitable or
sufficient data to derive adequate data-based vulnerability relations, the project
resorted to the use of nationally available heuristically derived wind vulnerability
functions based on tropical and extratropical cyclone events. The phasing of the
BNHCRC companion project "Improving the resilience of existing housing to
severe wind events" did not allow us to use improved wind vulnerability
relationships from that project as these were not available in time. An additional
consideration for this project has been that any vulnerability relation utilised for
specific case studies is ultimately intended for national application in order to
provide a future national capability of wind impact estimation. This implies that
highly locally specific wind vulnerability functions might produce better local
15IMPACT-BASED FORECASTING FOR THE COASTAL ZONE: EAST COAST LOWS – FINAL PROJECT REPORT | REPORT NO. 647.2021
results, but may well be less suitable on the continental scale. . With the
requirement of a 0.2 second wind gust input (rather than the 3-sec gusts from
ACCESS-C3), these functions are not calibrated against ACCESS-C3 wind
outputs, but can be related to a 3-sec wind gust (e.g., Holmes and Ginger, 2012)
and they provide a starting point from which we can establish the workflow while
working towards refined vulnerability functions in the future, once more suitable
damage datasets are available.
Heuristic vulnerability functions, as used in this project, are developed by people
experienced in observing or estimating loss from natural hazard qualitatively
estimating a vulnerability function informed by their experience and any
available empirical data. Figure 3 shows an example set of heuristic vulnerability
curves for a selection of Western Australian house types exposed to severe wind
hazard. Note that the vulnerability curves used are agnostic to the wind
direction, and respond only to wind gust magnitudes.
FIGURE 3: HEURISTIC VULNERABILITY FUNCTIONS FOR A RANGE OF WA HOUSE TYPES EXPOSED TO SEVERE WIND HAZARD (BOUGHTON, 2018).
EXPOSURE DATA
Exposure is a term used, in understanding impact and risk, to describe those
assets that will be affected by a particular hazard during an event. Exposure
information is sourced from the National EXposure Information System (NEXIS)
developed by Geoscience Australia (Nadimpalli 2007; Power et al., 2017). NEXIS
contains information on building locations, including structural, economic and
demographic attributes at the individual building level.
The quality of the NEXIS data is spatially variable; it is reliant on the quality and
availability of building specific input data. Where local building survey data is
available, the quality of the NEXIS data, at the building level, is better as
compared to areas where attributes need to be derived statistically. The
statistically derived data areas are representative at an aggregated level but
less likely to represent the exact building specific attributes for individual
buildings. The NEXIS exposure information for the location of initial interest in this
project, Dungog NSW, is statistically derived, which adds uncertainty to any
impact prediction for that location.
16IMPACT-BASED FORECASTING FOR THE COASTAL ZONE: EAST COAST LOWS – FINAL PROJECT REPORT | REPORT NO. 647.2021
FIGURE 4: SCHEMATIC DEPICTION OF THE NATIONAL EXPOSURE INFORMATION SYSTEM.
To constrain the scope of this pilot study, residential buildings, comprising semi-
detached and separate houses, are initially selected as the asset class for the
demonstration of the project workflow. NEXIS contains nationally-consistent
construction type information for these house types.
THE WORKFLOW
The automated generation of a spatial impact estimates through Geoscience
Australia's open source HazImp software requires input information on exposure
and vulnerability relationships in addition to the ACCESS-C3 based hazard inputs.
The spatial impact estimates are produced by HazImp as part of the workflow
chain shown in Fig. 5. They are intended to be made available to Bureau of
Meteorology forecasters through Visual Weather (the Bureau’s primary
operational data display system) and to other end-users in the emergency
management sector. A particular benefit of delivery of impact forecasts to
Bureau end-users is that severe weather forecasts and warnings can be
augmented with impact information to enhance their utility to a variety of end-
users, including the emergency response agencies.
17IMPACT-BASED FORECASTING FOR THE COASTAL ZONE: EAST COAST LOWS – FINAL PROJECT REPORT | REPORT NO. 647.2021
FIGURE 5: IDEALISED PROJECT WORKFLOW FROM HIGH RESOLUTION MODEL OUTPUT TO A SPATIAL DISPLAY OF IMPACTS IN THE BUREAU OF
METEOROLOGY'S OPERATIONAL DATA DISPLAY SYSTEM (VISUAL WEATHER).
The selection of ACCESS as the project’s hazard forecasting tool, science
expertise present within the project, and the available exposure and vulnerability
data, has restricted the project to focus on the wind and rain hazard, and to only
study their impact on residential buildings as the selected asset class (Fig. 6). The
emergency response sector has made it clear to the project that, ultimately, the
impact of all meteorological hazards on all asset classes (in particular critical
infrastructure) is highly desirable. Such work is possible, but would require an effort
that is way beyond the resources available to this project.
FIGURE 6: SUMMARY OF THE PROJECT'S SELECTION OF HAZARDS AND IMPACTED ASSETS (THE CONNECTIONS MARKED IN RED).
18IMPACT-BASED FORECASTING FOR THE COASTAL ZONE: EAST COAST LOWS – FINAL PROJECT REPORT | REPORT NO. 647.2021
FINDINGS / KEY MILESTONES
Our core project team was first assembled during the first year of the project, but
we experienced a steady stream of project staff arrivals and departures during
our 3-year project life cycle due to changing professional circumstances.
Equally, we initially compiled a group of end-users on the basis of demonstrated
prior commitment and responsiveness to the project. This end-user group also
experienced departures and arrivals, so the listed end-users in this report have
not all been involved for the entire duration of the project. The end-users have
been affiliated with the Bureau of Meteorology, the State Emergency Services
(SES) in Victoria, New South Wales and South Australia, Fire and Rescue New
South Wales (FRNSW), the Department for Environment, Water and Natural
Resources (DEWNR), the South Australian Country Fire Service (CFS), the Attorney-
General's Department's Crisis Coordination Centre (AGCCC), the Department of
Fire and Emergency Services in Western Australia (DFES), and the Queensland
Department of Fire and Emergency Services (QFES). A complete over view of all
the milestones delivered by the project is shown in Appendix A.
The key deliverable of the project over its 3-year life cycle are listed next.
PROJECT GLOSSARY
The diverse background of our team and end-user group, in combination with
the multi-disciplinary nature of natural hazard impact assessment necessitated
the development of a glossary of terms by the project. Our glossary provides
succinct definitions of the terminology used, specific to this project, with the
intention of ensuring all participants understand the words and language used
throughout reporting and engagement activities. The glossary also contains
definitions from a range of other organisations and bodies such as UNISDR or
WMO to provide an ability to view the chosen project definitions in the context
of pre-existing ones.
FIGURE 7: VISUAL SNIPPET OF THE GLOSSARY COMPILED BY THE PROJECT. EACH ROW PROVIDES AN ORGANISATION-SPECIFIC LISTING OF
DEFINITIONS FOR THE MORE COMMON TERMS USED IN HAZARD IMPACT MODELLING.
19IMPACT-BASED FORECASTING FOR THE COASTAL ZONE: EAST COAST LOWS – FINAL PROJECT REPORT | REPORT NO. 647.2021
WORKFLOW SETUP
Within the first year of the project we set up an end-to-end (weather model
output to spatial impact) workflow across two agencies, the Bureau and GA.
Vulnerability information was derived from pre-existing vulnerability relations
based on damage assessments from Queensland tropical cyclone case studies,
and exposure information was sourced from NEXIS. Hazard predictions (or
hindcasts) came from either ACCESS-City (APS3) or the high resolution reanalysis
(BARRA-SY). The workflow is depicted in Figure 5.
DERIVATION OF CASE-SPECIFIC VULNERABILITY RELATIONSHIPS FOR
THE DUNGOG CASE
Two damage assessment datasets for the 20-22 April 2015 East Coast Low event
were sourced and analysed to reveal that the relationship between residential
building damage and the driving hazards is complex with a need for the
damage reporting to be modified. Through some of our project end-users, these
modifications are now being undertaken, which is progress in itself and will, in
time, enable new vulnerability relationships for residential housing to be
developed for some locations affected by severe weather.
Vulnerability refers to the relationship between severity of impact on an asset
from a hazard of given magnitude. Quantitative vulnerability relationships are
essential in the estimation of quantitative impact predictions. The key
impediments to the derivation of vulnerability relationships for the Dungog event
were threefold.
• First, only the EICU data contained a categorical degree of damage
(none, minor, major, severe and destroyed). Such a categorisation is
needed to relate the damage severity to the magnitude of the
associated hazard.
• Second, the wind speeds produced by the Dungog event mostly stayed
well below the design wind speeds for newer housing in the Hunter area
(34-40 m s-1) and therefore cannot be expected to define the full wind
vulnerability relationship.
• In addition, whilst damage was reported in the BEACON and EICU data, it
was not possible to determine which hazard(s) caused the damage, i.e.
wind or rain or other hazards.
The wind-related damage that did occur during the Dungog event was mostly
due to tree fall, rather than direct wind impact on buildings. This 'damage by
intermediary' causality chain additionally complicates the derivation of
vulnerability relations given tree response to strong winds depends on a multitude
of other factors.
An outcome from these findings has been a recommendation to the NSW SES
(via the project's end-user, Anthony Day) to amend the damage reporting detail
20IMPACT-BASED FORECASTING FOR THE COASTAL ZONE: EAST COAST LOWS – FINAL PROJECT REPORT | REPORT NO. 647.2021
in the BEACON data. We asked for the inclusion of [a] damage rated by
categories and for [b] a linkage for all reported damage to the underlying
hazard(s).
CASE-SPECIFIC VULNERABILITY RELATIONSHIPS FOR DUNGOG NSW:
MULTI-HAZARD IMPACTS
Detailed examination of the damage data for the Dungog event also confirmed
a well-established view that most impacts are multi-hazard in nature. Fig. 8
demonstrates that the reported total damage in the EICU dataset is not sensibly
related to the model-derived wind speed alone, but is the aggregated product
of interacting hazards including wind, heavy rain and overland flooding. For
example, the damage reports in the top damage category (76-100%,
or"destroyed") are not due to the wind hazard, but are related to flooding as a
nearby creek rose beyond its banks (Wehner et al. 2015).
Fig. 9 shows the relationship between the EICU damage categories as a function
of the 48-hour instantaneous rain rate rainfall maximum. Again, the most severe
damage in the 76-100% category occurred at rain rates that were at most
intermediate, suggesting that it was not the rai hazard that was responsible for
the damage in the highest reported damage category
The derivation of vulnerability relationships from damage assessment data either
requires an unambiguous link between the reported damage and a single
underlying hazard that caused the damage (as is typically the case for tropical
cyclone damage), or it will be necessary to explore the use of multi-hazard
predictors to estimate the spatial event-integrated damage pattern in a more
statistical sense. Our project did engage in one such exploration, assessing the
usefulness of a joint wind & rain damage predictor for the Dungog event (see
below).
21IMPACT-BASED FORECASTING FOR THE COASTAL ZONE: EAST COAST LOWS – FINAL PROJECT REPORT | REPORT NO. 647.2021
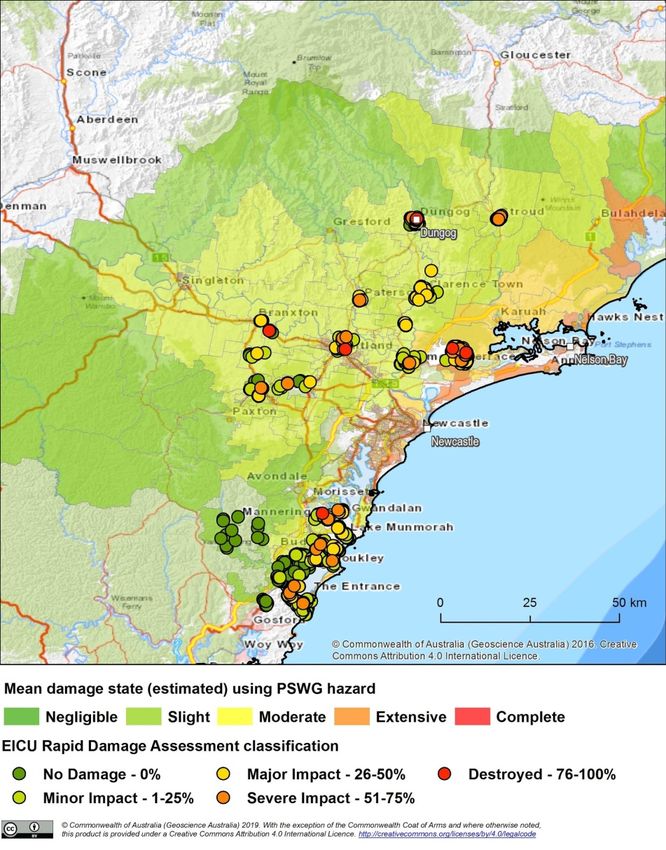
FIGURE 8: 20-22 APRIL 2015 EICU DAMAGE DATA FOR THE TOWN OF DUNGOG (NSW). THE RECORDED BUILDING DAMAGE, CATEGORISED INTO FIVE
CLASSES (NONE, MINOR, MAJOR, SEVERE, DESTROYED), IS SHOWN IN RELATION TO THE MATCHING 48-HOUR MAXIMUM 10-M MEAN WIND SPEED FROM
ONE INDIVIDUAL ENSEMBLE MEMBER (MEMBER 12) OF A 24-MEMBER HIGH RESOLUTION MODEL RUN ON A 1.3 KM GRID. THE COLOURED BOXES SHOW
THE INNER TWO QUARTILES OF THE MODEL WIND DISTRIBUTION FOR EACH DAMAGE CATEGORY.
FIGURE 9: AS IN FIG. 8, BUT IN RELATION TO THE MATCHING 48-HOUR MAXIMUM OF THE INSTANTANEOUS RAIN RATE (KG M2 S-1) FROM ENSEMBLE
MEMBER 0 (THE CONTROL RUN) OF A 24-MEMBER HIGH RESOLUTION MODEL RUN ON A 1.3 KM GRID. THE RAIN RATE IS OUTPUT BY THE MODEL EVERY
30 MINUTES DURING THE PERIOD 00 UTC 20 APRIL 2015 TO 00 UTC 22 APRIL 2015. A CONSTANT RAIN RATE OF 0.01 KG M2 S-1 WOULD EQUATE TO AN
HOURLY RAIN ACCUMULATION OF 36 MM. NOTE THAT THE LABELS ON THE ORDINATE ARE THE SAME AS USED IN FIG. 8, BUT WITH AN ADDITIONAL
DESCRIPTOR PROVIDED.
22IMPACT-BASED FORECASTING FOR THE COASTAL ZONE: EAST COAST LOWS – FINAL PROJECT REPORT | REPORT NO. 647.2021
CASE-SPECIFIC EXPOSURE DATA FOR DUNGOG NSW:
STATISTICALLY DERIVED DATA
The project has also explored the quality of available exposure information for
residential buildings in the Dungog (NSW) area, where such information is derived
from surveyed data in neighbouring towns. We gained some important insights
into the uncertainties that derived exposure information possesses. Ultimately, the
uncertainties of exposure information, of vulnerability relationships and of the
hazard predictions generated by the weather prediction models combine into
the uncertainty of the final impact outputs.
Akin to the vulnerability relationships, the available exposure information has also
been tested for its level of uncertainty. For the township of Dungog, the NEXIS
information is statistically derived from known point source data in equivalent
nearby towns. The building attributes "wall material" and "roof material" in NEXIS
for houses in Dungog are derived from exposure survey results in Newcastle (Dhu
and Jones 2002) and Alexandria (Maqsood et al. 2013). The "age" attribute for
houses built pre-1982 are sourced from NSW cadastral parcel registration date.
The "age" attribute for houses built 1982 and onwards is sourced 75% from NSW
median suburb year and 25% from cadastral parcel registration date.
We examined all 856 dwellings in Dungog in a desktop exposure survey (using
Google Streetview, aerial and other imagery) and compared the surveyed
(actual) wall and roof types to the statistically derived attributes within NEXIS. Fig.
10 shows the degree of agreement between the surveyed and statistically
derived house types (a house type is defined as a specific combination of one
of ten possible roof types and one of six possible wall types).
Fig. 10 implies that the statistically derived residential building attributes for
Dungog do not agree well with the actual attributes on the town scale. This
suggests that in areas where residential building attributes need to be derived
statistically due to lack of in-situ survey data, wind and rain impacts on such
housing can only be meaningfully considered on scales larger than the town
scale. This observation is well understood by the NEXIS data custodians. In
general, an ameliorating factor is that the NEXIS representation of house types is
of higher quality for the more common types. Implementation of an impact
forecasting system nationally will require a nationally consistent exposure system
which in turn relies on what data each jurisdiction collects and the quality of that
data. This decision will become a cost-benefit analysis for each government.
23IMPACT-BASED FORECASTING FOR THE COASTAL ZONE: EAST COAST LOWS – FINAL PROJECT REPORT | REPORT NO. 647.2021
FIGURE 10: RELATIONSHIP OF STATISTICALLY DERIVED NEXIS AND SURVEYED HOUSE TYPES FOR ALL POST-1982 HOUSES IN THE TOWN OF DUNGOG
NSW. A "HOUSE TYPE" IS DEFINED AS A COMBINATION OF WALL MATERIAL (10 CATEGORIES) AND ROOF MATERIAL (6 CATEGORIES). NOTE THAT ONLY
A SMALL NUMBER OUT OF ALL 60 POSSIBLE HOUSE TYPES IS ACTUALLY PRESENT IN DUNGOG.
WORKFLOW ESTABLISHED
During 20-21 September, early during the second year of this project, Serena
Schroeter and Craig Arthur teamed up in the Bureau's Head Office in Melbourne
to collaborate on the removal of the residual hurdles in the end-to-end workflow.
This included:
● modifying HazImp code to ingest netCDF files (data format for ACCESS
NWP)
● modifying HazImp to produce geospatial data output to enable impact
data to be visualised in geographic information systems and other
applications (including Visual Weather).
The first ever spatial impact output from Geoscience Australia's Hazard Impact
Model displayed through the Bureau primary operational data viewer, Visual
Weather, is shown in Fig. 11.
FIGURE 11: FIRST SAMPLE OF A SPATIAL IMPACT OUTPUT FROM HAZIMP DISPLAYED IN THE BUREAU'S VISUAL WEATHER DATA VIEWER. THE UNDERLYING
HAZARD IS THE WIND SPEED 10 METRES ABOVE GROUND LEVEL AS PRODUCED FROM ONE OF THE ENSEMBLE MEMBERS FOR THE 20-22 APRIL 2015
DUNGOG EAST COAST LOW EVENT ON A 1.3 KM GRID. THE IMPACT RATING (COLOUR) IN EACH POLYGON IS DERIVED FROM AN AVERAGE ACROSS
MULTIPLE DAMAGE INDICES COMPUTED FOR EACH INDIVIDUAL RESIDENTIAL BUILDING LOCATED WITHIN THE POLYGON.
24IMPACT-BASED FORECASTING FOR THE COASTAL ZONE: EAST COAST LOWS – FINAL PROJECT REPORT | REPORT NO. 647.2021
REQUEST FOR MORE DETAILED DAMAGE ASSESSMENT DATA
BEACON Data Reporting Upgrade Request: The project has approached SES
NSW (through Tony Day, NSW SES) requesting some modifications of the BEACON
Damage Assessment template. The two main drivers of this change request are
the project's need to (a) categorise damage by degree of severity, and (b)
attribute reported damage to the hazard(s) that caused that damage. No
progress has been made on the implementation of the requested modifications
due to the low priority within NSW SES, and the absence of support for resources
to perform the required work to enhance the BEACON system.
DEMONSTRATION FOR EXTREME WEATHER DESK FORECASTERS
On 20 September 2018 the project engaged several forecasters from the
Bureau's Extreme Weather Desk and the Victorian Regional Office. We
demonstrated the first samples of spatial impact graphics to draw out opinions
on their usability and how this new information could enrich the existing forecast
products. All consulted users were remarkably eager to gain access to the spatial
impact information, but the incorporation into forecasts was a more difficult
question to answer at this early stage.
FIRST MILESTONE VARIATION
As reported in previous quarterly reports, investigations during the first year of the
project made it increasingly clear that the available damage assessment data
for the 20-22 April 2015 Dungog East Coast Low event did not allow the project
to relate the level of residential building damage to the magnitude of either the
wind or the rain hazard in isolation. The reasons are that most damage is caused
by more than a single hazard, and that the best available damage data do not
link the reported damage to the hazard that caused it. Consequently, in
consultation with the BNHCRC, we have modified some of the milestones to
accommodate the above findings. The varied milestones for project year two
are included in Appendix A.
IDENTIFICATION OF ADDITIONAL WIND & RAIN-PRODUCING EVENTS
The selection of cases exhibiting strong surface winds and heavy rain has been
strongly constrained by the co-availability of damage assessment and high
resolution NWP model data. First, to establish relationships between hazard
magnitude and damage magnitude, only Emergency Information Coordination
Unit (EICU) data can be used as damage data, and only since 2015 when the
EICU data in their current high quality form was first collected. Second, it is
beyond the project's capacity to produce any further customised high-resolution
ACCESS-City model runs for cases beyond the April 2015 Dungog event given
the complexity of the ACCESS modelling system and the expertise required to
25IMPACT-BASED FORECASTING FOR THE COASTAL ZONE: EAST COAST LOWS – FINAL PROJECT REPORT | REPORT NO. 647.2021
operate the model. We therefore rely on existing high resolution model runs
provided by the high resolution reanalysis BARRA. While BARRA provides
reanalyses on 1.5 km grids for approximately the previous two decades, the high-
resolution grids are only set up in the four areas outlined in black in Fig. 12.
FIGURE 12: DOMAINS OF THE FOUR BARRA HIGH-RESOLUTION (1.5 KM) REANALYSIS PRODUCED BY THE BUREAU. THE FOUR DOMAIN NAMES, FROM
EAST TO WEST, ARE BARRA-SY, BARRA-TA, BARRA-SA AND BARRA-WA.
Large-scale wind and rain cases had to be sourced inside the BARRY-SY domains
during the four years 2015-2018 (see above), and be equipped with an
adequate number of EICU damage reports, which narrowed the selection to the
following three cases (Table 1). Further examination of the two additional cases
revealed, however, that the BARRA-SY wind hazard representation was not
suitable for non-probabilistic wind impact modelling. For example, in the
December 2015 Kurnell event, wind damage was mostly limited to the narrow
swaths of a number of severe thunderstorms. Storms of that small scale
(compared to an extratropical low) are not predicted at the right place and
right time by most high-resolution models including BARRA-SY. This created a
mismatch between hazard placement and damage locations.
TABLE 1: LIST OF SEVERE WIND / RAIN EVENTS SUITABLE FOR HIGH RESOLUTION MODELLING WHERE EICU AND BARRA-SY DATA ARE AVAILABLE
SIMULTANEOUSLY.
Year Event Name Event Type Approximate Total number of EICU
number of houses records
damaged
April 2015 Dungog ECL Wind / Rain / Flood 252 2000
December 2015 Kurnell Tornado Wind / Tornado from Strong 167 135
Convective Storms
June 2016 Picton, Narrabeen, East Coast Low (coastal 229 1400
Bankstown erosion)
SYSTEMATIC PRODUCTION OF HAZARD GRIDS
The project produced range of wind and rain hazards grids that was intended to
allow an optimal way of devising hazard combination choice for the estimate of
combined wind and rain impacts on residential properties. The twenty possible
26IMPACT-BASED FORECASTING FOR THE COASTAL ZONE: EAST COAST LOWS – FINAL PROJECT REPORT | REPORT NO. 647.2021
combinations from five rainfall hazard proxy grids and the four wind hazard proxy
grids are listed in Table 2.
TABLE 2: NINE HAZARD TYPES (5 FOR RAINFALL IMPACT, 4 FOR WIND IMPACT) ARE EXTRACTED FROM THE HIGH-RESOLUTION REANALYSIS DATASET
BARRA-SY FOR 3 WIDESPREAD WIND AND RAIN EVENTS IN DUNGOG (20-22 APRIL 2015), KURNELL (16 DECEMBER 2015) AND NARRABEEN (4-6 JUNE
2016).
Wind predictor Point Surface Wind Point Surface Mean Neighbourhood (40 Point Gradient-level
(right) and rain Gust (PSWG) Wind (10-minute km radius) Surface (900 hPa) Wind
predictor mean; PSMW) Wind Gust (NSWG) Speed (PGWS)
(below)
Point Predictor Predictor Predictor Predictor
Instantaneous Combination 1 Combination 2 Combination 3 Combination 4
rain rate or
accumulation
(PIRR)
Point 1-hr Predictor Predictor Predictor Predictor
accumulation Combination 5 Combination 6 Combination 7 Combination 8
(P1RR)
Point 6-hr Predictor Predictor Predictor Predictor
accumulation Combination 9 Combination 10 Combination 11 Combination 12
(P6RR)
Point Total Event Predictor Predictor Predictor Predictor
accumulation Combination 13 Combination 14 Combination 15 Combination 16
(PTEA)
40 km radius Predictor Predictor Predictor Predictor
neighbourhood Combination 17 Combination 18 Combination 19 Combination 20
accumulation
(N1RR)
The hazard grids extracted from BARRA-SY broadly consider rain and wind at a
point location over varying timescales. One neighbourhood maximum value is
included for each hazard type (N1RR; NGWS) to study the effects that each
model grid point experiences the maximum hourly rain rate / wind gust value
that exists in a neighbourhood within a 40 km radius. A 40 km neighbourhood
radius may seem excessively large, but in particular for multi-day lead times NWP
model placement errors can be of similar spatial scale (or larger), so that this
large radius needs to be understood as an attempt to accommodate model
errors of similar magnitude.
All grids for the Dungog and Kurnell cases could be produced, but the BARRA-SY
reanalysis runs for the Narrabeen case in June 2016 did not complete on time for
our analysis.
PRELIMINARY RAIN IMPACT MODEL WORKFLOW
The central impact production code, HazImp, was configured to accept BARRA-
SY 1.5 km reanalysis rainfall grids in addition to the previously used wind grids. This
allows HazImp to produce rainfall impacts, given the additional specification of
rainfall vulnerabilities of residential property. Unlike wind vulnerabilities, much less
is known about the susceptibility of residential buildings to water ingress from
high-intensity rainfall. To demonstrate the impact forecasting workflow works for
27IMPACT-BASED FORECASTING FOR THE COASTAL ZONE: EAST COAST LOWS – FINAL PROJECT REPORT | REPORT NO. 647.2021
rainfall, the existing wind vulnerabilities were rescaled to function as vulnerabilities
to hourly rain rates. The scientific validity of this highly idealised approach is
questionable, and these first guess functions serve the initial purpose of executing
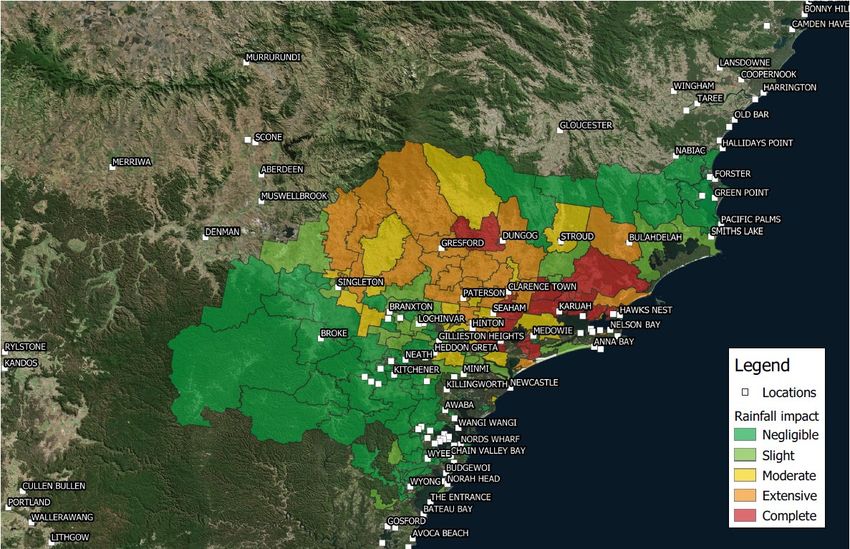
a rain hazard workflow end to end. Figure 13 shows the resulting impact forecast
product for the 20-22 April 2015 East Coast Low, with impacts aggregated to SA1
level.
FIGURE 13: MEAN RESIDENTIAL BUILDING LOSS RATIO DUE TO THE RAIN HAZARD, AGGREGATED TO SA1 POLYGONS FOR THE 20-22 APRIL 2015
DUNGOG EAST COAST LOW EVENT. THE MEAN LOSS RATIO IS CATEGORISED INTO NEGLIGIBLE (< 0.15%), SLIGHT (0.15-0.5%), MODERATE (0.5-1.0%),
EXTENSIVE (1.0-2.0%) AND COMPLETE (> 2%). THE RAIN HAZARD IS THE EVENT MAXIMUM HOURLY RAIN ACCUMULATION SOURCED FROM THE 1.5 KM
BARRA-SY REANALYSIS DATASET AS PRODUCED BY THE BUREAU OF METEOROLOGY.
PROJECT JOINED WMO TASK TEAM
During its second year, the project has joined the World Meteorological
Organisation (WMO) Task Team on Human Impacts, Vulnerability and Risks led by
Brian Mills from Environment and Climate Change Canada (ECCC;
https://www.wmo.int/pages/prog/arep/wwrp/new/high_impact_weather_proj
ect.html ). Through this membership the project gained easier access to impact
prediction groups and experts around the world, and we were also able to more
easily solicit feedback on our own work by the international community as part
of quality benchmarking.
REVISION OF SELECTED ASSET CLASS FOR IMPACT MODELLING
On 7 March 2019 the project engaged in a fruitful discussion with the lead end-
user (Roger Mentha, FRNSW) and Anthony Day (NSW SES) in Sydney. Discussion
focused on the scope of analysis possible in the project, and the Strategic
Priorities of NSW SES in emergency response. A key priority for NSW SES is the
28IMPACT-BASED FORECASTING FOR THE COASTAL ZONE: EAST COAST LOWS – FINAL PROJECT REPORT | REPORT NO. 647.2021
protection of critical infrastructure (CI) and community assets essential to
community survival in an emergency incident. Previous activities at Geoscience
Australia indicate that engagement with CI owners and operators presents a
major challenge to including elements of CI in the impact modelling workflow.
The project suggests to open a dialogue involving SES NSW, FRNSW, this project
and BNHCRC via the NSW State Emergency Management Committee (SEMC) to
explore the design of a potential future project with an ability to focus on impact
forecasts for elements of critical infrastructure.
TESTING A TWIN-HAZARD PREDICTOR FOR WIND AND RAIN
The literature review, and informal communications with other researchers
working on impact-based forecasting applications have shown that the majority
of physical impacts are not the result of a single hazard, but that multiple hazards
interact to drive hazard. In this pilot project we are restricted to two
meteorological hazards that can be readily derived from NWP products: wind
and rain. For these interacting hazards, a pertinent question is whether some
combination of wind gust strength and rain rate can deliver a robust predictor of
damage to residential houses.
We employed the Quadratic Discriminant Analysis (QDA) as a methodology that
yields the probability of housing damage for a range of combinations of wind
speed and rain rates as listed in Table 2. Again, the event impact data used are
the Emergency Information Coordination Unit (EICU) rapid damage assessment
data for the 20-22 April 2015 Dungog East Coast Low event. The spatial hazard
estimations are sourced from the Bureau's Reanalysis, BARRA-SY.
29IMPACT-BASED FORECASTING FOR THE COASTAL ZONE: EAST COAST LOWS – FINAL PROJECT REPORT | REPORT NO. 647.2021
FIGURE 14: THE PROBABILITY OF BUILDING DAMAGE ARISING DUE TO A COMBINATION OF RAINFALL AND WIND HAZARD PREDICTORS BASED ON A
QUADRATIC DISCRIMINANT ANALYSIS (QDA). THE ROWS SPECIFY DIFFERENT TYPES OF RAIN HAZARD PREDICTORS: 1-HOUR RAINFALL ACCUMULATION
AT A POINT (P1RR), 1-HOUR RAINFALL ACCUMULATION IN A 40 KM NEIGHBOURHOOD (MAXIMUM VALUE WITHIN THAT NEIGHBOURHOOD; N1RR), 6-
HOUR RAINFALL ACCUMULATION AT A POINT (P6RR), EVENT (72-HOUR) RAINFALL ACCUMULATION AT A POINT (PTEA). THE COLUMNS SPECIFY 10-M
3-SECOND WIND GUST AT A POINT (PSWG), 10-M ~10 MINUTE MEAN WIND (PSMW), NEIGHBOURHOOD MAXIMUM 10-M 3-SECOND WIND GUST
(NSWG), 900-HPA (~1 KM ABOVE THE GROUND) WIND SPEED AT A POINT (PGWS). ALL PREDICTORS (EXCEPT FOR PTEA) ARE EVENT MAXIMA FOR THE
72-HOUR PERIOD FROM 03 UTC 19 APRIL 2015 TO 03 UTC 22 APRIL 2015. "DAMAGED" IS DEFINED AS EICU DAMAGE RATINGS IN THE CATEGORIES
MODERATE, EXTENSIVE OR COMPLETE. SOLID BLACK CONTOUR INTERVALS FOR THE DAMAGE PROBABILITIES ARE 0.25.
This QDA analysis turned out to be highly sensitive to the input data, which in our
case is limited to those events where we have access to qualitative damage
survey data and the corresponding BARRA-SY data. Adding the Kurnell tornado
case to the above analysis changed the outcomes dramatically, raising serious
concerns about the robustness of the relationship. This inability to derive robust
dual-predictor damage probabilities formed the bases for a second scope
review within the project. Unlike for wind, no useable rain ingress vulnerability
functions exist in Australia (or elsewhere, to our knowledge). With such first guess
vulnerabilities and the EICU damage data as they are, the inclusion of rain
impacts seems to be beyond our reach for now.
PERTH RAF & DFES-HOSTED END-USER WORKSHOP
The Extreme Weather Research Advisory Forum (RAF) for 2019 took place at the
Department of Fire and Emergency Services (DFES) in Perth on 30 July 2019. After
recalling the current status of the work, the project presented four potential
options for utilisation work to the stakeholders present:
1. Creation of a Crisis Coordination Centre (CCC) product akin the GA's
tropical cyclone impact product
30You can also read


