In The Public Interest - soa
←
→
Page content transcription
If your browser does not render page correctly, please read the page content below
SOCIAL INSURANCE
                                                                                       & PUBLIC FINANCE
                                                                                           SECTION

In The
Public
Interest
I S S U E 1 9 • J U LY 2 0 1 9

Decision-Useful Risk              3   Chairperson’s Corner
                                      By Piotr Krekora
                                                                              38 A Variable Benefit Plan for the
                                                                                 Public Sector

Measures for                      4   Letter From the Editor: Please
                                      Participate!
                                                                                 By Brian Murphy

                                                                              43 The Society of Actuaries Living to
Public Pensions                       By Bruce D. Schobel                        100 Symposia: What Does Long Life
                                                                                 Mean to Us?
                                  6   Decision-Useful Risk Measures for          By Anna M. Rappaport
                                      Public Pensions
By William Fornia, Paul Angelo,       By William Fornia, Paul Angelo, Randy   45 Voluntary Social Security Coverage
                                                                                 of State and Local Government
Randy Dziubek and Todd Tauzer         Dziubek and Todd Tauzer
                                                                                 Employees
                                  24 Annual Ranking of the ACA’s First           By Bruce D. Schobel
Page 6                               Decade
                                     By Greg Fann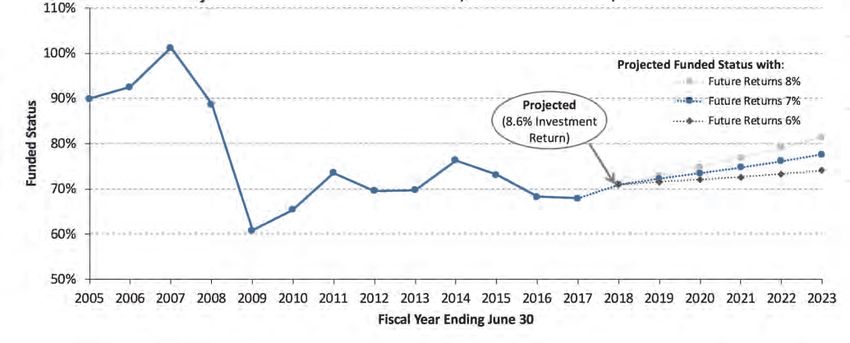
In The 2019
SECTION
LEADERSHIP
Public
Officers
Piotr Krekora, ASA, EA, FCA, MAAA, Chairperson
Douglas Fiddler, ASA, EA, FCA, MAAA, Vice Chairperson
Gregory Fann, FSA, FCA, MAAA, Treasurer
Janet Cranna, FSA, EA, FCA, MAAA, MSPA, Secretary
Interest Council Members
Christopher Merkel, FSA, MAAA
James J. Rizzo, ASA, EA, FCA, MAAA
Jeffery M. Rykhus, FSA, MAAA
Bruce Schobel, FSA, MAAA
Michael L. Stephens, ASA
Issue 19 • July 2019
Newsletter Editor
Published twice a year by the Bruce Schobel, FSA, MAAA
Social Insurance and Public Finance Section bdschobel@aol.com
of the Society of Actuaries.
Associate Newsletter Editor
475 N. Martingale Road, Suite 600 Jeffery M. Rykhus, FSA, MAAA
Schaumburg, Ill 60173-2226 jrykhus@gmail.com
Phone: 847.706.3500 Fax: 847.706.3599
www.soa.org Program Committee Coordinators
Christopher Merkel, FSA, MAAA
This newsletter is free to section members. 2019 Health Meeting Representative
Current issues are available on the SOA
website (www.soa.org). Ali Zaker-Shahrak, FSA, MAAA
2019 SOA Annual Meeting & Exhibit Representative
To join the section, SOA members and
non-members can locate a membership Douglas Fiddler, ASA, EA, FCA, MAAA
form on the Social Insurance and Public Webcast Coordinator
Finance Section webpage at https://
www.soa.org/sections/social-ins-pub SOA Staff
-fin/social-ins-pub-fin-landing/ Mary Stone, FSA, EA, FCA, MAAA, Staff Partner
mstone@soa.org
This publication is provided for
informational and educational purposes Ladelia Berger, Section Specialist
only. Neither the Society of Actuaries nor lberger@soa.org
the respective authors’ employers make any
endorsement, representation or guarantee Julia Anderson Bauer, Publications Manager
with regard to any content, and disclaim jandersonbauer@soa.org
any liability in connection with the use or
misuse of any information provided herein. Sam Phillips, Staff Editor
This publication should not be construed as sphillips@soa.org
professional or financial advice. Statements
of fact and opinions expressed herein are Julissa Sweeney, Senior Graphic Designer
those of the individual authors and are not jsweeney@soa.org
necessarily those of the Society of Actuaries
or the respective authors’ employers.
Copyright © 2019 Society of Actuaries.
All rights reserved.
Publication Schedule
Publication Month: January 2020
Articles Due: Sept. 2, 2019
The digital edition of this newsletter can be
found on the section landing page at https://
www.soa.org/sections/social-ins-pub-fin/
social-ins-pub-fin-newsletter/
2 | JULY 2019 IN THE PUBLIC INTEREST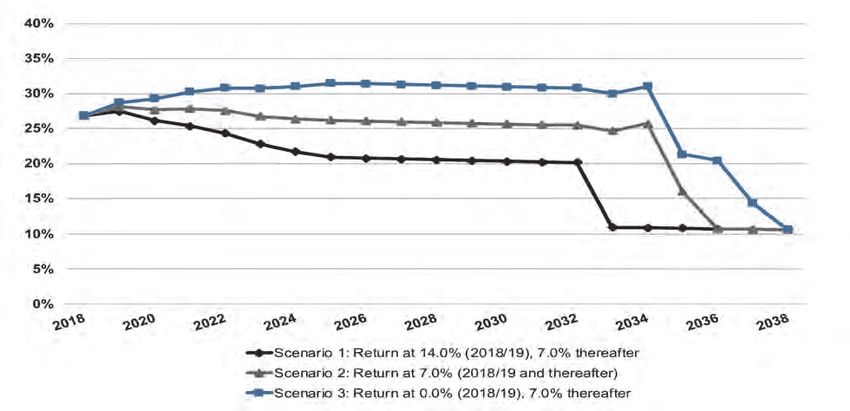
Chairperson’s Corner                                                 be important and relevant enough to stay the course. But we
                                                                     need to adapt to a changing environment. We should expand
                                                                     our activities beyond formal continuing education content. Like
By Piotr Krekora                                                     venturing into a world of podcasts—SIPF has yet to produce
                                                                     one. Our first step is to nominate a podcast coordinator. If you
                                                                     feel that you or your fellow actuary would be a good podcast
                                                                     coordinator, please do not hesitate to contact the undersigned,
                                                                     our staff partner, or our section specialist. We can use your help.

O
                                                                     There is one other characteristic distinguishing us from other
         ur council met in April to discuss the direction for our    sections: we are very mature. That’s right. Compared to other
         section over the next few years. As you all know, the       sections, or the SOA in general, we have very few young mem-
         Social Insurance and Public Finance (SIPF) section is       bers. This doesn’t mean that we lack energy; au contraire, my
a little different than most other sections: the majority of our     fellow council members and friends are very actively working
members joined other sections before becoming members of             preparing webcasts, a newsletter and meeting sessions. But we
SIPF. We are not the first choice for many of SOA members            are looking forward to welcoming younger members with fresh
looking to join a section. More than 90 percent of our members       ideas and a different worldview. This is the additional area I
belong to other sections as well, compared to approximately          would like to see changing: getting more new SOA members
50 percent of members in Retirement and Health sections not          working with us. Let’s not forget that social security systems are
affiliated with any other sections. Furthermore, our members         meant to last for decades and serve many generations to come,
practice in all areas of the actuarial profession, making us one     not just the ones receiving benefits right now. The sooner our
of the most diverse sections. As such, SIPF is not serving a         younger colleagues join us on our mission, the sooner they start
specific practice area. Rather, we address topics coming to our      contributing to improving the financial health of those social
minds even if our jobs put us all over the broad spectrum of         security systems. After all, young generations are notorious for
actuarial practice.                                                  working in the public interest.

These topics are summarized in our mission statement as: “The        In a way we are being helped by the SOA’s effort to increase
purpose of the section is to develop consistent, high-quality        engagement amongst young actuaries—our newsletter was
continuing education opportunities and sponsor fundamental           the first of the section newsletters to be published in the new,
research into evaluating and managing (1) social insurance pro-      mobile-friendly format. If you haven’t tried the digital and audio
grams and (2) benefit plans for government employees and the         edition yet, you should check it out; I liked it. However, revamp-
role of such benefit plans in public finance.” Programs within       ing the newsletter and making it more attractive will not help
the section’s purview include social security, government-ad-        much if nobody knows about it. So, I am asking all section
ministered health plans such as Medicare and Medicaid, and           members and friends to encourage their younger colleagues to
other government-sponsored pension and health benefit plans.         check us out and join the Social Insurance and Public Finance
The section’s purview is not limited to programs in the United       Section. Some of them might become our podcast coordina-
States.                                                              tors or produce other content appealing to young actuaries.
                                                                     But most importantly, we need to be able to pass the baton
My fellow council members pointed out that this mission is more      to our successors who will continue working on improving
succinctly summed up by the title of our newsletter: In The Public   the financial health of our public security systems, and, in the
Interest. And they are right; articles and presentations that we     pursuit of that goal, continue making this planet a better place
produced in the past few years covered relevant topics from social   in which to live.
security benefits and financial status, through risk management
in public sector pensions, to various aspects of Medicaid and the
                                                                                          Piotr Krekora, ASA, EA, FCA, MAAA, Ph.D., is a
Affordable Care Act. In the public interest indeed.                                       consulting actuary with Gabriel, Roeder, Smith
                                                                                          and Company. He can be reached at Piotr.
After a daylong discussion, I left the meeting with a feeling that                        Krekora@GRSConsulting.com.
some changes are in order. Not to our mission; it continues to

                                                                                                            JULY 2019 IN THE PUBLIC INTEREST |   3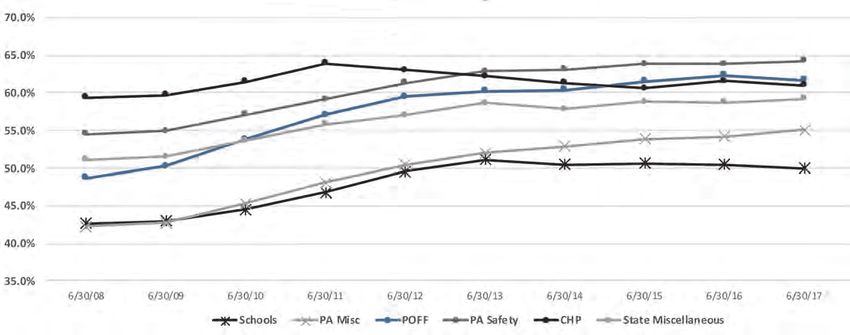
Letter From the Editor:                                               not great: Few people will contact a newsletter author and thank
                                                                            him or her for the useful information. But that doesn’t mean

      Please Participate!
                                                                            that it isn’t useful. If you have ever found useful information in
                                                                            this newsletter, then consider whether you have something to
                                                                            give back in return.
      By Bruce D. Schobel
                                                                            Some sections have inherent obstacles to publishing their mem-
                                                                            bers’ work. A lot of the work that actuaries do is proprietary.
                                                                            Employers, plan sponsors and other clients may not desire or
                                                                            agree to the publication of actuarial work that they paid to pro-
                                                                            duce, even if names are changed to protect the innocent—or

     I
                                                                            the guilty, as the case may be. Fortunately, work in the fields
        n October 2018, after serving for a year as chair of the Social     of social insurance and public finance tends to be much more
        Insurance and Public Finance (SIPF) Section Council, I              unfettered than is the work of most private-sector actuaries. For
        moved over to the equally demanding job of newsletter editor.       example, the work of U.S. Government actuaries cannot even be
      Section newsletters are critically important documents within         copyrighted, by law, and little to none of it is classified or even
      the SOA and the actuarial profession as a whole. They serve as        confidential (except as it may relate to individual beneficiaries
      an archive of the section’s most important activities, document-      who do have privacy rights).
      ing work that the section intends to preserve for posterity. Five
      years of back issues of this newsletter are accessible on the SOA’s   As editor, I ask every reader of this newsletter to look back on
      website here:                                                         your work during the past few years and try to find something
                                                                            that might be useful—or merely interesting—to other actuaries
      https://www.soa.org/sections/social-ins-pub-finsocial-ins-pub-fin-    with interests similar to yours. If you find something and have
      newsletter/                                                           time to describe it in a few pages, please prepare a draft article
                                                                            and send it to me. You are unlikely to become a famous author,
      Older issues are available through the SOA office.                    but you will be contributing to the vast body of knowledge that
                                                                            underlies actuarial science. We do have some practical limits on
      Many subjects of intense interest to section members may              article length, so if your contribution is too long, please attempt
      not be of broad enough interest to warrant publication in             to summarize it. Interested readers will be told how to contact
      The Actuary, SOA’s most widely circulated publication. Sec-           authors for additional background material.
      tion members hopefully know to look for articles of greatest
      relevance to them in their own newsletter. This applies to all        Thank you in advance for your contributions to this newsletter,
      sections, not just SIPF.                                              the SOA and the actuarial profession!

      Newsletters, however, don’t write themselves. All of the content
      in this and all previous newsletters was written by individuals—
      myself among them—who believed that they had information                                   Bruce D. Schobel, FSA, MAAA, is located in Winter
      worth sharing with their peers. A certain amount of hubris may                             Garden, Fla. He can be reached at bdschobel@
                                                                                                 aol.com.
      be required to look at something that you have done and believe
      that other people would like to read about it. And the rewards are

4   | JULY 2019 IN THE PUBLIC INTEREST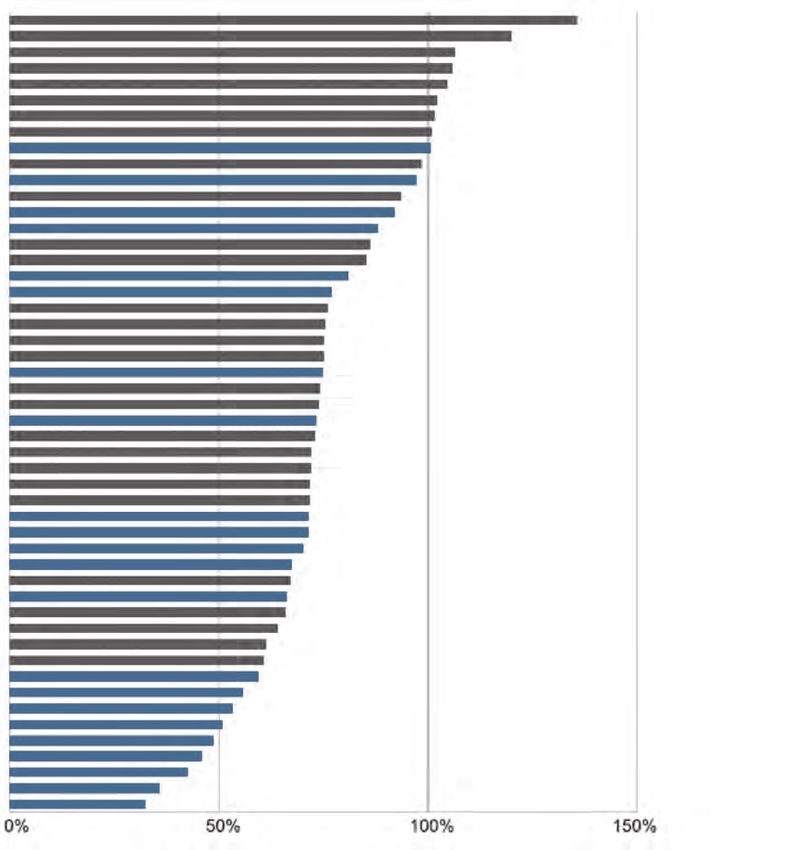
Decision-Useful Risk                                               Other ASOPs are relevant to pension plan actuarial valuations
                                                                         and include the following:

      Measures for Public                                                • ASOP 4—Measuring Pension Obligations and Determining
                                                                           Pension Plan Costs or Contributions
      Pensions                                                           • ASOP 27—Selection of Economic Assumptions for Measur-
      By William Fornia, Paul Angelo, Randy Dziubek and                    ing Pension Obligations
      Todd Tauzer
                                                                         • ASOP 35—Selection of Demographic and Other Noneco-
                                                                           nomic Assumptions for Measuring Pension Obligations

                                                                         • ASOP 44—Selection and Use of Asset Valuation Methods
                                                                           for Pension Valuations

      A
             ctuarial Standard of Practice (ASOP) No. 51 governs         ASOP 4 has a proposed revision that includes “Investment
             the “Assessment and Disclosure of Risk Associated with      Risk Defeasement Measure” (IRDM). This will be contrasted
             Measuring Pension Obligations and Determining Pen-          somewhat with various Decision-Useful Risk Measures used by
      sion Plan Contributions. ASOP 51 is now effective and requires     practitioners and presented in this article.
      identification and assessment of funding risks in actuarial val-
      uation. This article will address the new requirements with an     ASOP 51 presents several recommended practices:
      emphasis on providing useful information to public pension
      stakeholders. The authors include consulting actuaries, a public   • Identify risks that may be anticipated to significantly affect
      pension system actuary and a rating agency actuary, who will         plan’s future financial condition
      bring three different perspectives to the topic.
                                                                         • Assess these risks including potential effects

                                                                         • Recommend additional assessment if significantly beneficial

                                                                         • Calculate plan maturity measures that are significant to
                                                                           understanding risks

                                                                         • Identify historical measures that are significant to under-
                                                                           standing risks

                                                                         The risks to be evaluated under ASOP 51 are:

                                                                             a. Investment Risks (different returns from expected)
                                                                             b. Asset Liability Mismatch Risk (changes in asset values
                                                                                not matched by changes in liabilities)
                                                                             c. Interest Rate Risk (different from expected)
                                                                             d. Longevity and Other Demographic Risks (different
                                                                                from expected)
                                                                             e. Contribution Risk (not received)
                                                                         Several risk-assessment methods are discussed in the ASOP and
                                                                         will be presented in more detail in this article. These include:

                                                                         • Scenario Tests

                                                                         • Sensitivity Tests

                                                                         • Stochastic Modeling

6   | JULY 2019 IN THE PUBLIC INTEREST
interest and discussion of the more detailed quantitative risk
ASOP 51 is now effective and assessments.
requires identification and Volatility Ratios—Plan Maturity Measure and
assessment of funding risks in Quantitative Risk Assessment
actuarial valuation. Volatility ratios (sometimes called volatility indexes) are an
easy-to-calculate measure of the relative sensitivity of employer
contributions to changes in assets or liabilities. There are two
• Stress Tests common volatility ratios:
• Comparison of Present Values With Those Calculated at 1. Asset Volatility Ratio (AVR): Assets/Payroll
Minimal-Risk Discount Rates 2. Liability Volatility Ratio (LVR): Accrued Liability/Payroll
Likewise, several plan maturity measures are discussed in the These ratios are most commonly thought of as maturity mea-
ASOP and are presented in this article, including:
sures, along with ratios of retired to active members and ratios
of benefit payments to contributions. In particular, ASOP 51 lists
f. Ratio of Market Value of Assets to Active Payroll
(only) the AVR as an example of a plan maturity measure.
g. Ratio of Retiree Liability to Total Actuarial Liability
h. Ratio of Cash Flow to Market Value of Assets We find that the AVR and LVR give a more quantitative indica-
tion of future cost volatility than headcount ratios, and thus are
i. Ratio of Benefit Payments to Contributions
more useful as a risk assessment than some other plan maturity
j. Duration of Actuarial Liability measures. Also, while the AVR gets more attention (such as being
listed in ASOP 51) we find that the Liability Volatility Ratio
better captures intrinsic plan volatility. One way to see this is to
Finally, ASOP 51 suggests certain historical measures incorpo-
note that, as the plan approaches 100 percent funding, the AVR
rating risk:
approaches the LVR.
a. Plan Maturity Measures
We have found that the volatility ratios take some getting used
b. Funded Status to, and it takes some practice explaining them to trustees and
c. Actuarially Determined Contribution stakeholders. However, we find they are worth the effort for com-
d. Actuarial Gains and Losses municating directional trends in cost volatility and especially for
explaining the relative volatility for different tiers or plans.
e. Normal Cost
f. Plan Settlement Liability Here is a simple LVR example. Consider an employer with a gen-
In the pages that follow, three practitioners share their Deci- eral and a safety plan, or a single plan with separate general and
sion-Useful Risk Measures for Public Pensions. safety tiers and costs. Suppose the General Plan has an LVR of 5
and the Safety Plan has an LVR of 10. Then suppose the plan has
PRACTICAL EXAMPLES an assumption change that increases the Actuarial Accrued Liabil-
ity (AAL) of both plans by 10 percent.
This section presents some quantitative risk assessment tools
we have used with municipal (city and county) retirement sys-
tems that, by law, are funded based on an actuarially determined For the General Plan: AAL = 5 x Payroll, so ∆ AAL = 50%
contribution rate. These systems generally have enjoyed a high of payroll
level of Board involvement and stakeholder interest in actuarial For the Safety Plan: AAL = 10 x Payroll, so ∆ AAL =
decisions and results. These systems already have some qual- 100% of payroll
itative and quantitative ASOP 51 risk assessment information
in their actuarial reports, for example, the volatility ratios dis- This shows that the impact of the assumption change on the
cussed a little later in this article. However, the more detailed employer’s contribution rates will be roughly twice as great for
quantitative risk assessments have been performed only for Safety compared to General. A similar example using the AVR
some of the systems, and are generally provided outside the will show the relative impact of investment experience on the
actuarial reports. We expect that ASOP 51 may spur additional employer contribution rates for the two plans.
JULY 2019 IN THE PUBLIC INTEREST | 7Decision-Useful Risk Measures for Public Pensions
For a live example, Table 1 shows the progression of these ratios
over time for the General and Safety tiers of a particular county
retirement system.
Table 1
Progression of Ratios Over Time
General Safety
Year
AVR LVR AVR LVR
2017 6.4 9.0 12.9 13.8
2016 6.0 8.9 12.2 13.4
2015 6.2 8.9 12.3 13.1
2014 6.2 8.6 12.1 12.9
2013 5.5 8.1 10.8 12.9
Here we see that the AVRs and LVRs are substantially higher for
Safety than for General. Using the 2017 results we can observe
that, comparing Safety to General:
10% asset loss is 129% vs 64% of payroll—so Safety rates will
be twice as volatile
than assumed by some specific amount. In practice, we find this
10% change in AAL is 138% vs 90% of payroll—so Safety rate
particular set of scenarios has several advantages:
impact is over 50% greater
• It does not introduce a new and arbitrary good news / bad news
Practical Investment Return Scenario Test assumption parameter like “3% above or below the assumed
ASOP 51 lists several quantitative risk assessment methods: rate,” which makes it look less like a prediction. Also we find
everybody intuitively understands “zero” and “double.”
Scenario Tests—impact of future experience (“events”)
• Because it is a one-year variation, we find it is more credible
Sensitivity Tests—impact of assumption changes
than a specific multiyear variation because it shows a realis-
Stochastic Modeling—distribution of future experience tic range of outcomes. However, because it is a fairly mild
Stress Tests—impact of “adverse changes in factors affecting a “stress test,” it may not be an adequate risk assessment for
plan’s financial condition” (i.e., experience) systems that are already seen as financially stressed.
Comparison of valuation present values with present value
“using a discount rate derived from minimal-risk investments” • Because it is a one-year variation, it can be used by employ-
ers to estimate next year’s contribution requirements for
budgeting by interpolating based on actual returns as they
Here is a particular type of deterministic investment return sce-
nario test we have found very accessible and useful for both trustees emerge during the year.
and employers. It illustrates the projected effect of a single year of
investment returns above or below the assumed investment return. In Figures 1, 2 (Pg. 9) and 3 (Pg. 10), we show the effect of
these three scenarios on the funded ratio, the unfunded actuarial
Baseline: assets earn expected return every year accrued liability or UAAL (both on a smoothed assets basis) and
the employer contribution rate (aggregating all tiers together).
Bad news scenario: one-year return of 0%
Good news scenario: one-year return of 2 times assumed Finally, while we have not illustrated it here, we sometimes
return include a graph showing the new baseline scenario together
with baseline projection from last year. This shows very clearly
Note this is a relatively mild “stress test” compared to some the projected effect of one year of actual investment and demo-
recent proposals that would show multiple years of returns less graphic experience.
8 | JULY 2019 IN THE PUBLIC INTERESTFigure 1
Projected Funded Ratios (Actuarial Value of Assets Basis)
Under Three Market Return Scenarios for 2018/2019
Figure 2
Projected UAAL (on Actuarial Value of Assets Basis)
Under Three Market Return Scenarios for 2018/2019 ($ Millions)
JULY 2019 IN THE PUBLIC INTEREST | 9Decision-Useful Risk Measures for Public Pensions
Figure 3
Projected Employer Contribution Rates
Under Three Market Return Scenarios for 2018/2019 (% of pay)
Stochastic Modeling What is an acceptable probability of ruin? Stochastic mod-
A stochastic modeling projection shows a probability distribu- eling can assign a likelihood to undesirable outcomes, but
tion of future outcomes based on a specific matrix of capital cannot say what likelihood is acceptable. This means that
market assumptions. This gives a quantified estimate of the stochastic modeling may be more illustrative than specifically
likelihood of both relatively normal and extreme outcomes. decision useful.
We advise retirement systems that, like deterministic projec- While a stochastic modeling report will usually
tions, stochastic modeling outcomes are also entirely dependent include graphs of the full distribution of stochastic
on assumptions, but that dependence is not as apparent as it is outcomes, it is also helpful to summarize some specific
with deterministic projections. For example, users of stochastic probability results from the full distribution, as in Table
modeling should consider: 2. The CalPERS case study that follows in the next sec-
tion also includes examples of such probability summaries.
How fat are your tails? The probability of extreme outcomes
may be difficult to know with any reliability. If a stochastic In conclusion, Figures 4 (Pg. 11), 5 and 6 (Pg. 12) show the full
model shows that your “probability of ruin” (however defined) distribution of stochastic outcomes for funded ratio, UAAL and
is 5 percent, different capital market assumptions with fatter employer contribution rates. We show the 95th, 75th, 50th,
or narrower tails could show results of 7 percent or 3 percent, 25th, and 5th percentile outcomes, along with the baseline
respectively. deterministic projection.
10 | JULY 2019 IN THE PUBLIC INTERESTTable 2
Specific Probability Results
Any time in the next 20 years
Total Employer Rate Increases by at least
5% of Payroll 10% of Payroll 15% of Payroll
(to 32% of Payroll) (to 37% of Payroll) (to 42% of Payroll)
Probability 30% 22% 16%
Any time in the next 20 years
Total Employer Rate Spikes in a Single Year by
3% of Payroll 5% of Payroll 7% of Payroll
Probability 10% 3% 2%
Figure 4
Projected Funded Ratios (Actuarial Value of Assets Basis)
JULY 2019 IN THE PUBLIC INTEREST | 11Decision-Useful Risk Measures for Public Pensions
Figure 5
Projected UAAL (Actuarial Value of Asset Basis) ($ Millions)
Figure 6
Projected Employer Contribution Rates
12 | JULY 2019 IN THE PUBLIC INTERESTCASE STUDY—CALIFORNIA PUBLIC EMPLOYEES’ • Whether to make contributions to CalPERS in excess of
RETIREMENT SYSTEM (CALPERS) minimum requirements
CalPERS strives to provide comprehensive risk assessments
• Benefit-related decisions (limited to the addition of new tiers
regarding plan funding and sustainability consistent with the
or minor adjustments to certain plan provisions)
Board of Administration’s pension and investment beliefs. Our
4,000-plus annual valuation reports include metrics on plan • Whether to contribute to a section 115 trust and the selec-
maturity, sensitivity analysis, and risk analysis to aid in the tion of the investment mix for such assets
understanding of how plans are affected by investment return
volatility and other factors. • Whether to terminate the CalPERS contract
Below is a summary of the specific items included in the CalP- • Whether to request short-term contribution relief
ERS public agency reports intended to assess and disclose risks
associated with the plans. In addition to the annual reports for • Staffing decisions (potentially)
public agencies, CalPERS produces an Annual Review of Fund-
ing Levels and Risks report that looks at the system as a whole. Investment Risk
Exhibits from that report are also included below. All public agency reports include a four-year projection of
required employer contributions under various investment
Public Agency Annual Valuation Reports return assumptions. The alternate investment return scenarios
Many of the risk measures and accompanying text within our are based on the 5th, 25th, 75th and 95th percentile average
public agency reports were provided before the effective date of returns for the projection period. This provides some indication
ASOP No. 51. However, others were added recently based on of the likelihood of the alternate scenarios in addition to their
recommendations with ASOP No. 51. impact on required contributions.
Our participating agencies use this information for short- and Since the projections in Table 3 do not illustrate the impact of
long-term budgeting purposes as well as to assist them in mak- a single year “shock” scenario, we also provide the following
ing plan-related decisions including: accompanying text from our valuation reports.
Table 3
Single Year “Shock” Scenario
Projected Employer Contributions
Assumed Annual Return From 2018–20 through 2021–22 2021–22 2022–23 2023–24 2024–25
1.0%
Normal Cost 11.1% 11.1% 11.1% 11.1%
UAL Contribution $7,527,000 $7,665,000 $8,766,000 $10,051,000
4.0%
Normal Cost 11.1% 11.1% 11.1% 11.1%
UAL Contribution $7,417,000 $7,339,000 $8,122,000 $8,988,000
7.0%
Normal Cost 11.1% 11.1% 11.1% 11.1%
UAL Contribution $7,307,000 $7,007,000 $7,450,000 $7,857,000
9.0%
Normal Cost 11.3% 11.5% 11.8% 12.0%
UAL Contribution $7,128,000 $6,618,000 $6,815,000 $6,936,000
12.0%
Normal Cost 11.3% 11.5% 11.8% 12.0%
UAL Contribution $6,671,000 $5,652,000 $5,276,000 $4,752,000
JULY 2019 IN THE PUBLIC INTEREST | 13Decision-Useful Risk Measures for Public Pensions
“Required contributions outside of this range are also possible. Sensitivity Tests
In particular, whereas it is unlikely that investment returns Tables 4, 5 and 6 are provided in all public agency valuation
reports to provide agencies with expected impacts should long-
will average less than 1.0 percent or greater than 12.0 percent term experience vary from the actuarial assumptions.
over this four-year period, the possibility of a single investment
Contribution Risk
return less than 1.0 percent or greater than 12.0 percent in any
CalPERS agencies have the ability to voluntarily terminate
given year is much greater.” their contract. In addition, agencies that do not make minimum
Table 4
Discount Rate
Sensitivity Analysis
As of June 30, 2018 Plan’s Normal Accrued Liability Unfunded Funded Status
Cost Accrued Liability
7.00% (current discount rate) 18.529% $233,633,623 $85,963,182 63.2%
6.0% 22.941% $263,189,076 $115,518,635 56.1%
8.0% 15.123% $209,050,385 $61,379,944 70.6%
Table 5
Inflation (discount rate held constant)
As of June 30, 2018 Current Inflation -1% Inflation Rate +1% Inflation
Rate Rate
a) Accrued Liability $233,633,623 $219,159,383 $244,076,865
b) Market Value of Assets $147,670,441 $147,670,441 $147,670,441
c) Unfunded Liability (Surplus) [(a)-(b)] $85,963,182 $71,488,942 $96,406,424
d) Funded Ratio 63.2% 67.4% 60.5%
Table 6
Post-Retirement Mortality
As of June 30, 2018 Current Mortality 10% Lower 10% Higher
Mortality Rates Mortality Rates
a) Accrued Liability $233,633,623 $238,220,223 $229,397,264
b) Market Value of Assets $147,670,441 $147,670,441 147,670,441
c) Unfunded Liability (Surplus) [(a)-(b)] $85,963,182 $90,549,782 $81,726,823
d) Funded Ratio 63.2% 62.0% 64.4%
14 | JULY 2019 IN THE PUBLIC INTERESTrequired contributions are generally terminated involuntarily. If Maturity Measures
unfunded liability exists at the time of termination, by law future Each CalPERS public agency valuation report contains maturity
member benefits—including those of existing retirees—are measures (see Tables 8, 9 and 10). As suggested in ASOP No. 51,
reduced by the percentage necessary to bring liabilities in line commentary is also provided to aid the user in understanding
with assets. Table 7 provides information regarding the poten- the significance of the measures.
tial reduction in member benefits should the plan voluntarily or
involuntarily terminate. Annual Review of Funding Levels and Risks
A few months after the completion of the annual reports that
Given the liabilities in this exhibit are determined using Treasury establish required contributions for our agencies, CalPERS
rates, they also provide information regarding investment risk. actuaries produced the Annual Review of Funding Levels and
Table 7
Potential Reduction in Member Benefits
Table 8
Table 9
Table 10
JULY 2019 IN THE PUBLIC INTEREST | 15Decision-Useful Risk Measures for Public Pensions
Risks report that is presented to our Board. This report pro- Stochastic Analysis
vides systemwide results that the Board uses to make decisions Stochastic analysis is used extensively in the Annual Review of
regarding: Funding Levels and Risk report to determine the likelihood of
future events regarding funded status levels, contribution levels
• Investment policy
• Funding policy (including amortization policy) and contribution volatility. This analysis was used recently by
• Selection of actuarial assumptions (primarily economic) the Board to assist in the analysis of proposed changes to the
amortization policy which were presented and approved in
Figures 7, 8, 9 (Pg. 17) and 10 (Pg. 18) illustrate the results. February 2018.
Projections of Funded Status
Figure 7
PERF Funded Status Based on Market Value of Assets (June 30, 2005 to June 30, 2018)
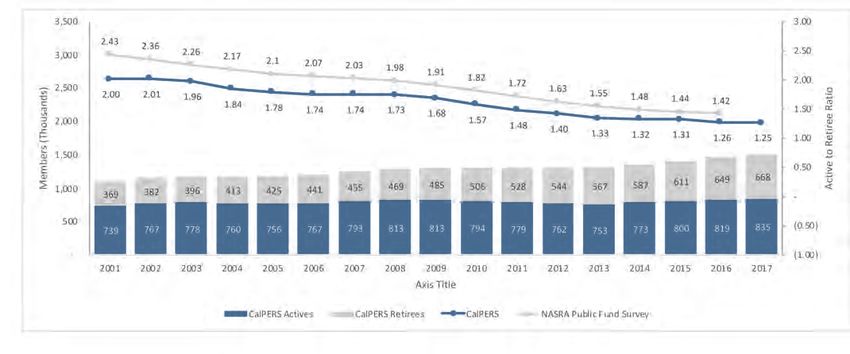
16 | JULY 2019 IN THE PUBLIC INTERESTMaturity Measures
Figure 8
Ratio of Active to Retirees
Figure 9
Ratio of Retiree Accrued Liability to Total Accrued Liability
JULY 2019 IN THE PUBLIC INTEREST | 17Decision-Useful Risk Measures for Public Pensions
Figure 10
Asset Volatility Ration (MVA to Payroll)
Table 11
Probability of Falling Below Given Funding Level (at any point in next 30 years)
40% 50% 60%
Plan
2017 2018 2017 2018 2017 2018
State Miscellaneous < 1% < 1% 6% 1% 48% 24%
Schools < 1% < 1% 3% 1% 33% 22%
CHP < 1% < 1% 15% 2% 100% 100%
POFF < 1% < 1% 6% 1% 52% 26%
PA Miscellaneous < 1% < 1% 5% 2% 38% 27%
PA Safety < 1% < 1% 9% 4% 54% 43%
Table 12
Probability of Employer Contribution Rates Exceeding Given Level (at any point in next 30 years)
Plan 30% of Payroll 35% of Payroll 40% of Payroll
2017 2018 2017 2018 2017 2018
State Miscellaneous 100% 100% 73% 56% 32% 28%
Schools 25% 36% 4% 11% < 1% 1%
PA Miscellaneous 45% 53% 11% 23% 1% 6%
Plan 50% of Payroll 55% of Payroll 60% of Payroll
2017 2018 2017 2018 2017 2018
CHP 100% 100% 100% 100% 100% 87%
POFF 97% 80% 69% 52% 38% 32%
PA Safety 97% 100% 78% 79% 54% 61%
18 | JULY 2019 IN THE PUBLIC INTERESTFigure 13
Probability of Employer Contribution Rate Increases of Selected Magnitudes (at any point in next 30 years)
Plan 3% of Payroll 5% of Payroll 7% of Payroll
2017 2018 2017 2018 2017 2018
State Miscellaneous 18% 53% < 1% 12% < 1% 6%
Schools 21% 41% < 1% 7% < 1% 4%
PA Miscellaneous 3% 40% < 1% 9% < 1% 5%
Plan 5% of Payroll 7% of Payroll 9% of Payroll
2017 2018 2017 2018 2017 2018
CHP 25% 59% 1% 27% < 1% 12%
POFF 8% 47% < 1% 18% < 1% 9%
PA Safety 12% 55% < 1% 20% < 1% 10%
Actual exhibits from the 2018 report are provided in Tables 11, To aid us in this determination, we use several risk metrics
12 and 13. of our own, two of which will be highlighted here. The first,
described in S&P Global Ratings’ U.S. States Methodology,
The report templates used by the CalPERS actuaries are is our minimum funding progress (MFP) metric, which
reviewed annually. We continually discuss possible additions or compares total contributions to the sum of the service cost,
improvements—especially in the critical area of risk analysis— interest cost on the NPL, and 1/30th of the NPL, as an
internally as staff and with our outside stakeholders. annual snapshot of contribution effectiveness. We generally
view negative amortization or even static funding poorly in
RATING AGENCY PERSPECTIVE credit analysis, especially when it lingers over a period of
As a credit rating agency, S&P Global Ratings provides intelli- time. Figure 11 displays that recently only nine out of 50
gence to the marketplace on the potential ability and willingness states have met or exceeded this metric. Given that we con-
of an issuer to meet its financial debt obligations in full and sider the MFP a measure of “minimum progress,” it is clear
on time, a concept we identify as creditworthiness. For U.S. that in our view there is room for significant improvement
state and local governments, evaluation of creditworthiness within contribution practices. We also examine whether or
encompasses several factors beyond an entity’s ability to meet not (indicated by gray or blue respectively) all state plans
its pension promises. However, pensions play a key role in in aggregate consistently and fully follow actuarially based
our assessment of creditworthiness because of their continual contributions as another indicator of liability management
and increasing pressure on states’ and municipalities’ finances, over time.
especially when considering the legal and political protections
generally afforded pensions. Figure 12 examines the discount rate, asset allocation mix, and
plan maturity for the largest pension plan in each state. Invest-
Our pension assessment starts with an examination of the cur- ment volatility is constantly in the news as a major driver of
rent funded position and size of liabilities and contributions, but cost variation for pension plans, but we firmly hold that a plan’s
quickly focuses in on funding discipline metrics such as prudent tolerance to that investment volatility depends on many factors,
assumptions, contribution practices, effective amortization of including but not limited to the demographic profile of the plan.
the unfunded liability, and related risk metrics including demo- This is one of the reasons why we believe there is little analytical
graphics. We are interested in knowing what kinds of historical support for us to adjust all plans by one single uniform discount
decisions and practices have led to today’s position, and similarly rate, even under the level cost method. And as plans grow more
how today’s policies will drive potential progress and cost tra- mature, the contribution rate sensitivity to investment volatility
jectory going forward. In short, we endeavor to anticipate the increases, even as plans have been increasing their allocation
potential for and scale of accelerating payments and increasing to complex and risky assets. The top left corner of Figure 12
budgetary stress over time in light of a municipality’s complete represents high risk plans that are both more mature and have
financial profile. more risky investment portfolios.
JULY 2019 IN THE PUBLIC INTEREST | 19Decision-Useful Risk Measures for Public Pensions
plan” in place to understand and address pension risk, which in
We endeavor to anticipate my opinion speaks directly to the heart of the ASOP.
the potential for and scale of As pension risk always ties back to current and future financial
accelerating payments and impact for us, we especially see great value in full baseline and
increasing budgetary stress over stressed projections of liabilities and costs going forward. It’s
surprising how many plan sponsors don’t know what their esti-
time in light of a municipality’s mated costs would be in five or ten years even if all assumptions
complete financial profile. are met. That lack of information can lead not only to poor
financial planning over time, but also to potentially ill-informed
perspectives and choices in benefits or funding practices that
While both assessments shown here are survey-based and not could have cost ramifications for decades to come.
necessarily reflective of future deviations from expected values,
The more ASOP 51 causes real and growing pension risks to be
the provisions of ASOP 51 still fit well into our forward-look-
taken seriously, discussed in earnest, understood, and ultimately
ing assessment of cost trajectory. In fact, we even have a score acted on from both the plan and plan sponsor perspective, the
adjustment based on whether or not the issuer has a “credible better the outlook will be for all parties involved.
20 | JULY 2019 IN THE PUBLIC INTERESTFigure 11
State Plan Minimum Funding Progress
New York State
South Dakota
Utah
Tennessee
North Carolina
West Virginia
Nebraska
Wisconsin
Idaho
Indiana
Washington
Maine
Oklahoma
Michigan
Louisiana
Delaware
Iowa
Montana
Georgia
Maryland
Ohio
Rhode Island
Kansas
New Hampshire
Florida
Virginia
Nevada
Arizona
Arkansas
Alabama
Vermont
North Dakota
California
Pennsylvania
Wyoming
South Carolina
Texas
Missouri
Connecticut
Mississippi
Alaska
New Mexico
Hawaii
Illinois
Massachusetts
Kentucky
Colorado
Oregon
Minnesota
New Jersey
Total plan contributions to accounting measures for annual minimum funding progress
Blue: Pension contributions do not have an actuarial basis or are not usually fully funded. Gray: Pension
plan contributions are actuarially based and usually meet or exceed required levels. *Alabama pension
figures include the Alabama Employees’ Retirement System agent plan measured as of fiscal 2016 as
reported in the state’s unaudited fiscal 2017 comprehensive annual financial report (CAFR). §The funded
ratio for Tennessee reflects 2016 plan information for the state’s agent plans as reported in Tennessee’s
fiscal 2017 CAFR.
Source: S&P Global Ratings.
Copyright ©2018 by Standard & Poor’s Financial Services LLC. All rights reserved.
JULY 2019 IN THE PUBLIC INTEREST | 21Decision-Useful Risk Measures for Public Pensions
Chart 12
Plan Demographics and Target Asset Allocations Largest State Pension Plans
Indiana’s pre-1996
Teacher’s Retirement Fund
and Washington’s Public
Employees’ Retirement System
(PERS) Plan 1 are closed to new
entrants. This Figure excludes
information for Alabama,
Georgia, Hawaii, and North
Carolina because 2012 or 2017
targeted asset allocations
for the largest plan were not
available in the Public Plans
Database (PPD). Missouri
State Employees’ Retirement
Systems is an outlier, with
a 25 percent reduction in
its targeted high-risk asset
allocation since 2012 and falls
outside the chart plot area.
Source: Pension plan and state reports.
Investment allocation information from PPD.
Copyright ©2018 by Standard & Poor’s
Financial Services LLC. All rights reserved.
CONCLUSIONS
ASOP 51 requires identification and assessment of funding Paul Angelo, FSA, is senior vice president &
risks in actuarial valuation. The purpose is to provide useful actuary with Segal Consulting. He can be
information to public pension stakeholders. The various contacted at pangelo@segalco.com.
approaches illustrated above have been found to be useful
by these experienced practitioners. As ASOP 51 is imple-
mented, these measures and other risk assessment measures Randy Dziubek, ASA, EA, MAAA, is deputy chief
will be incorporated to enhance the understanding of public actuary of Valuation Services, CalPERS Actuarial
pensions. Office. He can be contacted randall.dziubek@
calpers.ca.gov.
Todd Tauzer, FSA, CERA, FCA, MAAA, was director,
William (Flick) Fornia, FSA, is president of Municipal Pensions with S&P Global Ratings,
Pension Trustee Advisors, Inc. He can be US Public Finance at the time this article was
contacted at flick@pensiontrusteeadvisors.com. authored. He can be contacted at ttauzer@
segalco.com.
22 | JULY 2019 IN THE PUBLIC INTERESTAnnual Ranking of the satisfaction and popularity, enrollment success, flexibility to
improve, functioning mechanics, general market confidence,
ACA’s First Decade insurer profitability, legal challenges and victories, number of
participating insurers, operational aspects and premium levels.
On to the countdown. …
By Greg Fann
#10. 2016
In the third and final year of ACA markets having the benefit
of training wheels (reinsurance and risk corridors), it was clear
that the ACA was not ready for the real world. Numerous com-
plications1 arose after a relatively smooth-sailing prior year.
O
n Dec. 24, 1895, the United States Senate was in session Enrollment was less than half2 of its original projected size, the
to vote on a military affairs bill concerning employment population was skewed (older and sicker), insurer losses were
of former Confederate officers. The Senate didn’t vote substantial, and there was no cohesive plan3 to address the chal-
again on Christmas Eve until 2009. The latter occurrence, a fed- lenges. Assessment of blame included “self-inflicted wounds by
eral health care overhaul, signaled dramatic change in the health Obama and his administration”4 as well as allegations directed
care landscape in the 2010s. toward the usual suspects.
The Patient Protection and Affordable Care Act (ACA), col- 2016 was also the year that serious concerns regarding the ACA
loquially known as Obamacare, was passed by the House and risk adjustment methodology became publicly apparent. In
signed into law by President Obama in March 2010. As the ACA March, the Centers for Medicare and Medicaid Services (CMS)
is now in its 10th year, it is useful and instructive to consider the acknowledged this through facilitation of an industry confer-
rocky path of its inaugural decade. ence and the release of a white paper.5 Adjustments to the risk
adjustment methodology dominated the annual 2018 regula-
The layout of this article is a ranking of the first 10 years of tion,6 which was finalized7 in 2016, marking President Obama’s
the ACA in a countdown-style format. The ranking order is final fingerprints on his namesake law.
obviously subjective in nature; details, references, and rationale
are provided with each year. While I think the general indi- The risk adjustment challenges were so widespread that one
cators of the ACA’s high and low points are compelling, other of the first two Strategic Initiatives of the Society of Actuaries
commentators may logically choose a different ordering based (SOA) Health Section Council (charged to investigate ACA mar-
on alternative measures. For example, I concerned myself with kets and challenges) devoted its focus8 exclusively to ACA risk
market sustainability devoid of future funding challenges and adjustment complications while downplaying other pervasive
did not consider the impact on the federal deficit as a ranking concerns. A series of papers from a diverse group of actuaries
variable. Also, I didn’t contemplate difficult-to-measure societal had a common theme and mirrored comments9 submitted in
costs such as motivations for companies to limit the number of response to the proposed annual ACA regulation; the papers
full-time employees or incentives for individuals to minimize focused on risk adjustment inequities,10 volatility and solvency
personal income. anxiety, and disadvantages for low-cost insurers who effectively
manage care.11 As the Trump administration navigates its way
While this article is hopefully more entertaining than a typical through the ongoing legal challenges,12 unresolved methodol-
health insurance research paper, it is not a novelty exercise; it’s ogy concerns still remain13 today. The common theme expressed
a serious reflection of the ACA history, the challenges encoun- in the series of actuarial papers led to an unfortunate conclusion
tered, and the notable successes. Hopefully, it’s also engaging that “we all want young people to enroll in the market with only
and jam-packed with insights (abundant references to time-rel- two exceptions: young people and the health plan that would
evant quotes and articles are included) to consider as the ACA likely enroll them.”14
prepares for the 2020s.
In May, U.S. District Judge Rosemary Collyer ruled15 that
Although the ACA has broad impact on the health care system, the ACA’s cost-sharing reduction (CSRs) subsidies were not
the endurance of the legislation relies on the sustainability of appropriated by Congress and billions of Treasury funds were
the individual market which it fundamentally reshaped in 2014. unconstitutionally spent. While this decision was regarded as a
Accordingly, the rankings are aligned with individual market large blow to the ACA, it had a silver (pun intended) lining that
success and its outlook. Relevant factors include consumer manifested in 2018.
24 | JULY 2019 IN THE PUBLIC INTERESTThe troubled market catalyzed proposals16 from Republicans adopted. If allowed to be used appropriately, Section 1332
in Congress that also included federal subsidies to support the would allow states to correct premium subsidy imbalances24 and
individual market (direct federal funding for this market began attract a broader market.25
with the ACA), but in the form of age-based tax credits rather
than income-based subsidies and ACA-like mechanics.17 At the time, my assessment of the market outlook was gloomy
due to regulatory inaction and lack of appropriate attention. I
Bad news seemed to repeat itself with CO-OP plans falling like was concerned that stakeholders didn’t fully appreciate that
dominoes and major companies exiting markets, prompting fear the long-term market viability relied on financial fundamentals
of some counties potentially having no insurers in place. Dem- rather than the pomp and circumstance26 of the ACA’s early
ocrats joined Republicans in expressing doubts about the ACA’s years. I wrote27 “the most challenging period for the ACA is still
structural mechanics. Minnesota Governor Mark Dayton stated ahead of us, with a riskier market for all participating health
that “the reality is the Affordable Care Act is no longer afford- plans, waning enthusiasm as the initial promotional value wears
able”18 and later utilized state funds to absolve some of the off, and a new president who is not personally identifiable with
damages. At a campaign event in October, former President Bill the program. In my opinion, a long-term sustainability view-
Clinton referred19 to the ACA framework as a “crazy system” point will recognize the financial implications and inherent
and said the subsidy structure (limited to certain income levels) incentives, acknowledge the need of positive outcomes for both
in an inflated premium environment was “the craziest thing in health plans and consumers, and appropriately discount the
the world.” His description of premium cliffs was visibly clear early emotional activity associated with this new marketplace.”
with a simple graph-plotting20 of premium rates by income level.
The difficult environment influenced the presidential election.
In an exit poll, NBC reported that voters who thought the ACA
The best opportunity to correct ACA markets (without addi-
was an overreach “are breaking decisively for Trump, 80 percent
tional federal spending) in 2016 was the same as it is today.
to 13 percent.”28 Donald Trump’s victory obviously took some
Section 133221 of the legislation allows states to develop inno-
wind out of the ACA sails. In startling reality, his presidential
vation waivers and flex some of the ACA’s rigid rules to attract
actions have circuitously stabilized ACA marketplaces; but Mr.
a broader population. Unfortunately, tangible opportunities
Trump was elected under a mantra of “repealing and replacing”
were not well communicated and promulgation of guidance22
the ACA, and expectations were clearly in sync with his cam-
was released too late for states to make sweeping changes for
paign platform. The year ended with ACA markets in rough
2017. Also, the guidance was arbitrarily inflexible23 and offered
shape, insurer exits and high premium increases, consumer frus-
little more than “reinsurance waiver” options that some states
tration, and anticipation29 that the remaining days of the ACA
experiment were numbered.
#9. 2013
Near the end of 2013, the implementation efforts came into public
view. The beginning stage of ACA operations did not align with
its solid legislative and legal successes. As many states declined to
establish their own exchanges, the majority of states relied on the
federal exchange model. Initial reports of “website is experiencing
technical difficulties” were soon discovered to be grossly under-
stated. The implementation rollout was disastrous and President
Obama’s first appointed HHS Secretary Kathleen Sebelius accepted
responsibility30 for the debacle,31 saying “You deserve better … I
apologize … I’m accountable to you for fixing these problems and
I’m committed to earning your confidence back by fixing the site.”
Predictably, initial enrollment32 was light and skewed toward older
enrollees more likely to have medical conditions.
The year ended badly on other fronts as well. After earning
the Politifact.com “Lie of the Year” award33 with “If you like
your health care plan, you’ll be able to keep your health care
plan,” President Obama allowed states to extend “transitional”
(aka grandmothered) plans for several more years, effectively
JULY 2019 IN THE PUBLIC INTEREST | 25Annual Ranking of the ACA’s First Decade
changing the ACA enrollment dynamics. By this time, insurers The other initial Strategic Initiative (“Evolution of the Health
had already locked and loaded their initial rates for ACA mar- Actuary”) of the SOA Health Section Council was led by SOA
kets, and the rule change caught insurers and their actuaries34 Board Member Joan Barrett.44 In writing about the state of indi-
off-guard. The midyear changes plagued markets in the initial vidual markets and potential legislative disruptions, she spoke of
years; insurers rely on tight margins with premiums established high rate increases, insurers dropping out of markets, and levels
well in advance. Insurers need to understand the rules35 up of market uncertainty that one might think would have been
front to appropriately develop annual premium rates. While appropriate in 2014, not three years into the program. I echoed
it’s tempting to immediately solve an isolated problem, “gov- these comments on a podcast45 about Section 1332 waivers, “I
ernment leaders could logically be insensitive to potentially don’t think anyone really believes that the markets have settled,
inflicting market damage” and wound government’s reputation and the waivers actually could bring some stability to the mar-
as a reliable business partner.36 kets if they are tailored in the right way.”
Key stakeholders were troubled as well. A controversial 2.3 Despite warnings46 to the contrary, the ACA was unwaveringly
percent excise tax on medical devices in the ACA legislation touted as a one-size-fits-all solution for everyone not eligible
went into effect in 2013. Labor unions said the ACA was highly for other coverage. In reality, the unbalanced incentives caused
disruptive, claiming it would drive up the costs of union-spon- the market to fall 12 percent short of the required47 40 percent
sored plans, “ACA will shatter not only our hard-earned health of enrollees in the 18–34 age range. In June, the former Acting
benefits, but destroy the foundation of the 40-hour work week Administrator of the CMS Andy Slavitt acknowledged recog-
that is the backbone of the American middle class.”37 nition of the imbalance and his satisfaction with the uneven
pricing dynamics producing winners and losers. In an interview
After building momentum through the preimplementation with National Public Radio, he said “The problem our country
years, 2013 was a setback and clearly the ACA’s worst year before has is how to help people who are in the lowest economic straits,
going live in 2014. who have the most health challenges, get access to affordable
coverage and, indeed, get well. The problem we don’t have is
how to help 27-year-olds get cheaper insurance. That’s just not
#8. 2017 a national concern for us right now.”48
2017 will forever be known38 as the ACA’s year of high rate
increases and the failure of repeal efforts. It’s also the only year That admission was a far cry from ACA-architect David Cutler
of the ACA beyond the “training wheels” phase when insurers in 2013 advocating that ACA markets would be attractive to
were reimbursed for CSR payments, and the limited one-year young men, “I don’t think it (3:1 age curve) will have a huge
metric did not indicate the unadjusted ACA framework was sus- impact because it will be offset by the subsidies. Many young
tainable. Insurers exited39 ACA markets, and the uninsured rate men have relatively low incomes. Thus, the premium they face
began40 its post-ACA climb. In the second round of the SOA will not be the full amount, but rather the amount net of the
Health Section Strategic Initiatives focused on ACA markets, a subsidy. Put another way, the ACA has limits on the share of
2017 article noted, “It is often asked if the individual market is income that people will pay for health insurance. These limits
sustainable long term and if these issues can be fixed.”41 are sufficiently low that the price will not be a prohibitive factor
in determining whether to buy coverage or not.”49
The year began with President Trump’s first executive order
directing the Health and Human Services agency “to interpret While the mechanical combination of the ACA rating rules and
regulations as loosely as allowed to minimize the financial bur- unbalanced premium subsidies continued to afflict markets, leg-
den on individuals, insurers, health care providers.”42 This set a islator attention on market challenges was uncannily misdirected
new direction43 that provided expanded market flexibility. Much toward a “secret sabotage document”50 that sought to close
of the 2017 focus, however, was on federal legislative repeal loopholes51 and was quite underwhelming from a scandalous
efforts. viewpoint. With relief not coming through federal legislation or
robust Section 1332 efforts, two unlikely remedies surfaced in
2017.
2017 will forever be known
as the ACA’s year of high rate In May, an actuarial study52 revealed that the demographic
imbalance might be partially resolved by employers accessing
increases and the failure of the individual market for their employees. Notably, this activity
repeal efforts. suggested that individual markets offered some attractive value
for employers.53 Key findings of the study included:
26 | JULY 2019 IN THE PUBLIC INTERESTOverall, it was a bad year for the ACA. A significant improve-
ment in financial results, stemming from large rate increases, is
the only factor that keeps 2017 in the single digits on this list.
#7. 2014
The enrollment implications56 of the ACA’s rating rules and
pricing mechanics came into view, with influences from the
Supreme Court ruling on mandatory Medicaid expansion and
President Obama’s decision to allow transitional plans. The reg-
ulatory rating rules flirted with violations of actuarial principles,
which the ACA tried to overcome with a mix of federal sub-
sidies, a shared-responsibility payment requirement for those
avoiding coverage, and general promotional efforts. The first of
the three is the lifeblood of the market, and the market would
collapse without this financial assistance. The second was weak
and largely unenforced before being repealed. The third had
some short-term value but fundamentally does not offer long-
term value or sustain markets.
Rather than directly addressing the “important” problem of
high health care costs,57 the ACA provided financial incentives
for low-income individuals to obtain health insurance coverage,
• Relative to expectations and alleged sustainability require- but simultaneously created an “urgent” problem of disrupted
ments, the ACA did not attract the targeted cross section of insurance markets, which shifted focus away from the more
members in the individual market. The rating requirements important problem.
and the unbalanced allocation of tax subsidies attracted an
older and sicker population. This resulted in higher aver- The ACA’s redesign of market rules complemented by an
age costs and less favorable risk adjustment settlements for allotment of federal funds was effective in providing insurance
insurers, both of which have necessarily increased future incentives to previously uninsured individuals. At the same time,
premium rates. it increased premiums and disadvantaged some prior individual
market consumers. The unbalanced incentives created a skewed
• With the current framework and resulting population, the market58 and sustainability challenges.
individual market will continue to struggle with sustainabil-
ity. Population changes could be brought about by different Whether or not commentators believe it is the right social pol-
incentive structures through legislation, intelligent use of icy, almost everyone agrees that the ACA’s largest challenge is the
waivers via Section 1332, or through employer subsidies and disallowance of health status as a classification of pricing risk. In
material changes in distribution channels. highlighting the dangers of broad risk classes in a general insur-
ance sense, Actuarial Standard Of Practice No. 1259 warns in the
• Migration of workers from the traditional group market to background section: “Failure to adhere to actuarial principles
the individual market will lower the average age and increase regarding risk classification for voluntary coverages can result
stability in the individual market. in underutilization of the financial or personal security system
by, and thus lack of coverage for, lower risk individuals, and can
In October, President Trump stopped54 reimbursing insurers for result in coverage at insufficient rates for higher risk individuals,
CSR payments after receiving a legal recommendation from the which threatens the viability of the entire system.” Actuarial
Department of Justice. The market benefit of this action had principles are not theoretical ideas that can be overcome by
been previously discussed,55 but general public understanding of sheer force in a practical world. Highlighting the importance of
the paradoxical implications and market benefits is lacking, even actuarial mechanics, WellPoint Chief Executive Joseph Swedish
in today’s lower premium environment. admitted60 “the critical ingredient in terms of how our business
operates … without actuarial analysis, we really are shooting
2017 ended with tax legislation that repealed the individual man- in the dark.” The actuarial implications were decipherable61
date penalty (effective in 2019), concerning some stakeholders and expected to change enrollment dynamics of individual and
and putting the 2012 Supreme Court decision back into focus. group markets.
JULY 2019 IN THE PUBLIC INTEREST | 27You can also read